April 28, 2025
Updated: March 18, 2026
A data-led review of malware volume, delivery methods, and enterprise impact worldwide.
Mohammed Khalil
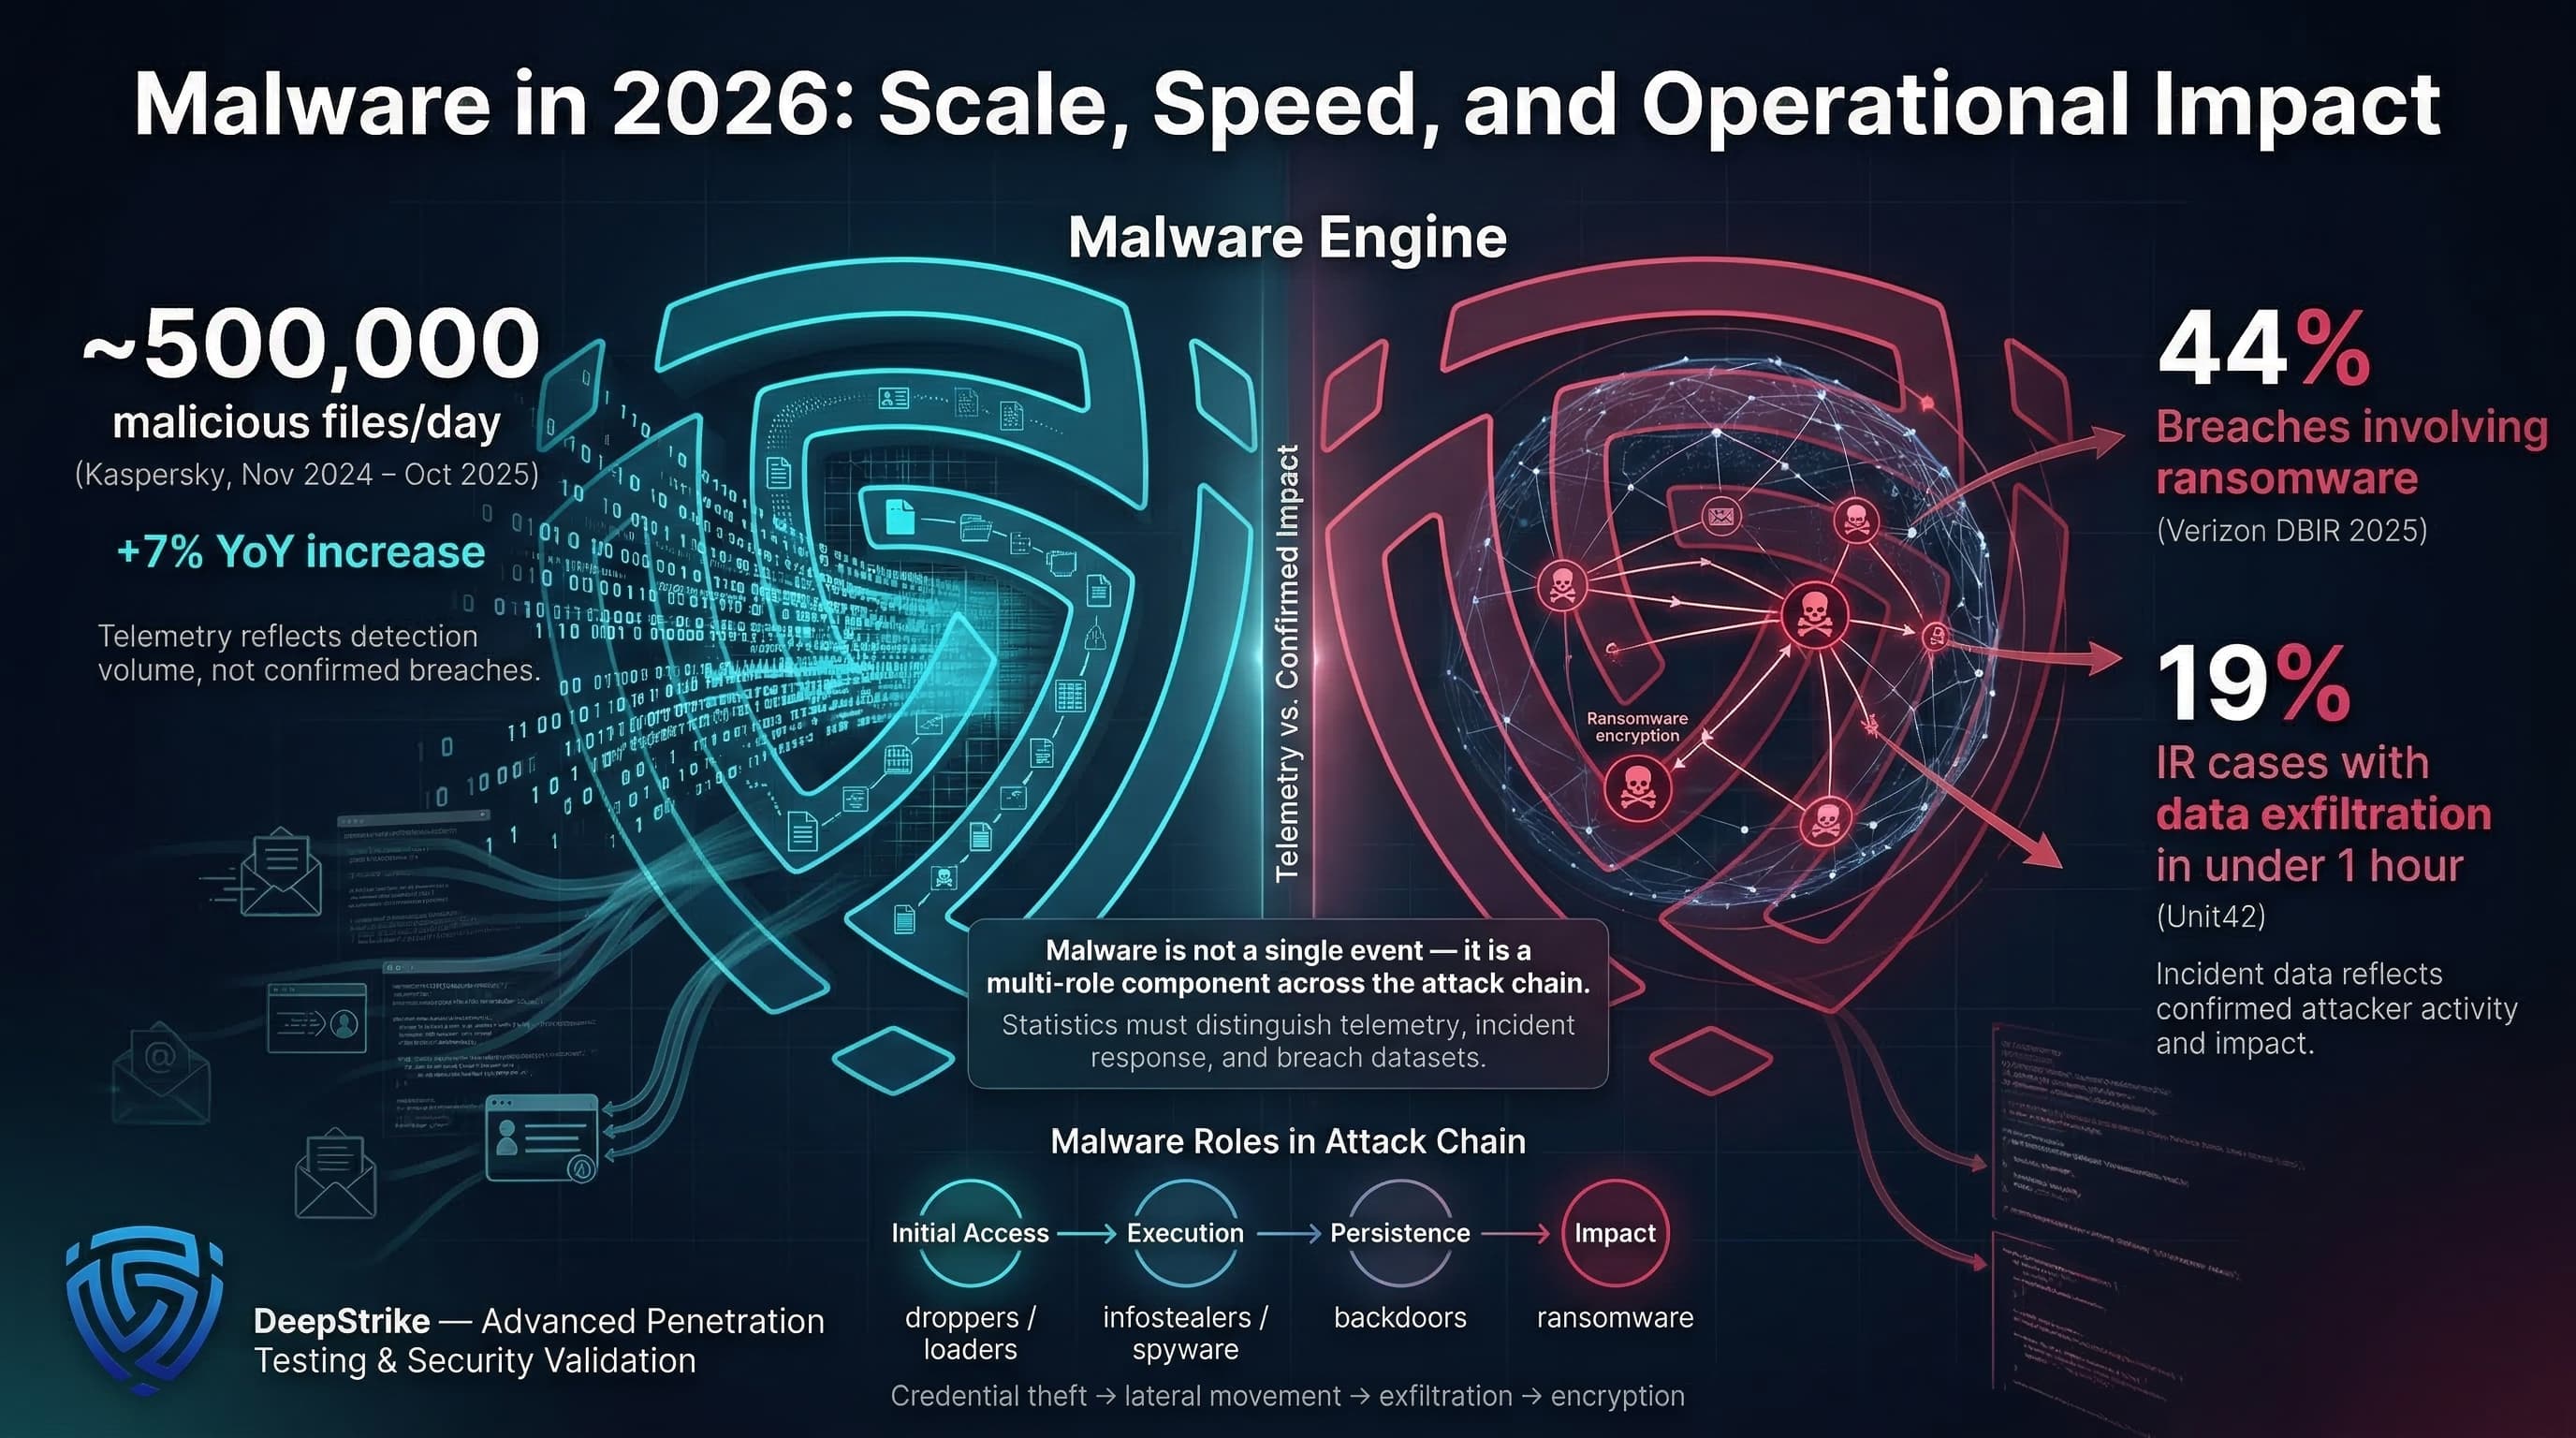
Malware statistics for 2026 combine scale (volume of malicious code) with operational impact. For example, Kaspersky’s latest window (Nov 2024–Oct 2025) shows an average ~500,000 malicious files detected per day, ~7% higher than the prior period. In parallel, Verizon’s 2025 DBIR (covering breaches analyzed up to 2024) reports ransomware involved in 44% of breaches, and Unit42 IR data shows 19% of cases exfiltrating data in under one hour. These figures underscore that malware remains a core access/execution mechanism (droppers, loaders), a credential-stealing tool (infostealers, spyware), a persistence/backdoor vector, and an enabler of disruption (ransomware). It intersects with phishing, malicious web scripts, endpoint compromise, and credential theft: compromised credentials often enable initial access, where malware injects further footholds (see Mandiant and DBIR data on initial vectors). Critically, this analysis uses the latest available 2025 data for 2026 planning and clearly distinguishes telemetry versus confirmed incidents versus sample repositories. Each statistic is labeled by source, year, and scope, since vendor detections (telemetry) differ from breach counts and sample collections.
Malware Statistics refer to quantified data about malicious software activity, including infection volume, detection trends, malware family distribution, delivery methods, victim impact, industry targeting, regional variation, and broader changes in how malicious code is used in cyber intrusions.
Malware statistics come from different measurement models:
Example distinction: 1,000 detections could reflect blocked activity, whereas even a small number of successful events such as a harvested credential enabling unauthorized access and later backdoor deployment can create disproportionate business impact. Telemetry counts indicate exposure, but an incident count (breach) shows actual compromise. Malware sample growth shows attacker creativity but doesn’t map 1:1 to company infections.
Each stat below is annotated with source and year. We avoid conflating vendor telemetry with global prevalence: for example, Verizon’s DBIR reports ransomware present in 44% of confirmed breaches, which is an incident dataset, whereas CrowdStrike’s “malware-free” figure describes the composition of detections, not breach outcomes.
| Metric | 2024 | 2025 (Latest) | Trend | Notes |
|---|---|---|---|---|
| Malicious files detected per day (Kaspersky) | ~467K/day | ~500K/day | Up | Kaspersky telemetry (Nov 2024–Oct 2025 window); ~+7% YoY. |
| Ransomware present in breaches (Verizon DBIR) | 32% (DBIR 2024) | 44% | Up | Confirmed breaches dataset (DBIR, 2025 report). Includes all ransomware presence. |
| Exploitation as initial access (Verizon DBIR) | ~15% | 20% | Up | “Exploited vulnerabilities” for initial breach; DBIR source. |
| Edge/VPN target share (Verizon DBIR) | ~3% | 22% | Sharp Up | Portion of exploitation actions via remote-edge (perimeter) access. |
| Password stealer detections (Kaspersky) | Index 100 | Index 159 | Up | 2024=100; 2025=59% higher volume (no absolute count). |
| ClickFix execution vector (ESET) | Baseline (H2) | +>500% (H1) | Sharp Up | ESET: rapid rise in “ClickFix” social-engineered launch points (scripts prompting user). |
Across these sources, the latest data point to (a) rapid growth in credential-stealer and spyware detections, (b) continued focus on perimeter and VPN exploitation, and (c) ransomware remaining ubiquitous in confirmed incidents. For example, ESET’s 500% jump for ClickFix usage is a delivery technique indicator, while Verizon’s “edge targeting” jump indicates more exposed perimeter services being hit. Together they imply attackers are extending reach (vulnerable edges) and improving phishing/script success rates to drop malware inside networks.
Raw detection volume is not equivalent to cost. Business impact arises when malware enables privileged access, rapid spread, or major disruptions: for example, stolen credentials leading to SaaS account takeovers, persistent backdoors enabling long undetected access, or fast exfiltration. Notably, organizations are increasingly resilient: Verizon’s DBIR shows median ransom payments fell to $115K in 2024 (from $150K previously), and 64% of victims refused payment (reflecting better backups or policies). However, response costs remain high because malware-driven incidents often trigger expensive containment and recovery.
| Indicator | Value | Change | Notes |
|---|---|---|---|
| Median ransom payment (DBIR) | ~$115,000 | –$35,000 | Verizon DBIR 2025: median paid (2024 data). |
| Ransom victims refusing to pay (DBIR) | 64% | Up (vs 50% in 2022) | Survey: 2025 report (2024 breaches). More organizations rebuild than pay. |
| Exfiltration <1 hour (Unit42 IR, 2024) | 19% of cases | Rapid “time-to-impact”; 2024 IR data. | |
| Median dwell time (Unit42) | ~7 days (2024) | –46% | Down from ~13 days in 2023, showing faster attacks. |
| Enterprise devices in stealer logs (DBIR) | 30% | % of infostealer-logged comps being enterprise-managed (2025 DBIR). |
Payment metrics can mislead: declining ransom amounts may simply indicate increased refusal, not lower risk. The critical dimension is speed and breadth. With 19% of IR cases having sub-hour exfiltration, containment and recovery (lockdown, credential resets, forensics) become major costs. In practice, downtime and post-incident labor often outweigh any ransom paid. These figures imply enterprises must budget for quick incident response (automation of isolation and credential revocation) and strengthen identity/backup strategies to mitigate impact, not just focus on reducing payments.
Verizon DBIR confirms ransomware in ~44% of breaches (2024 incidents). Microsoft reports human-operated ransomware encounters rising ~2.75× year-over-year (2023–24). Crucially, many operations stall short of encryption; even so, ransomware presence signals serious compromise. It often represents the final “impact” phase after an intrusion chain using credentials or exploits. Defenses: prioritize backup and recovery, network segmentation, and hardening privileged access. ESET notes ransomware victims surged ~40% YoY in 2025, underscoring continued growth. The persistence of ransomware-linked breaches means organizations should treat any detected ransomware artifact as an assumed wide compromise, triggering broad containment and resilience measures.
Stolen-credential malware underpins many intrusions. Mandiant highlights infostealers fueling initial access markets and extortion chains. Verizon’s 2025 DBIR found 54% of ransomware victims had credentials exposed beforehand (infostealer logs). DBIR reports ~46% of devices with corporate logins were unmanaged (BYOD) in infostealer logs, showing credentials from personal devices slip past enterprise controls. Kaspersky saw password-stealer detection jump +59%. This makes identity the critical battleground: protecting credentials with phishing-resistant MFA and account monitoring can cut off a major attack vector. Breached credentials also drive hidden lateral moves (think saved browser passwords or token reuse).
“Droppers” and “downloaders” remain common staging tools. Mandiant 2024 data shows downloaders and droppers (combined ~15%) frequently present during multi-stage intrusions. These Trojan-style loaders deliver final payloads (often infostealers or ransomware) post-exploit or phishing. For example, the ClickFix campaigns use HTML scripts (Click-to-Execute prompts) to load malicious payloads (e.g. via PowerShell). Operationally, loaders emphasize multi-stage chains: an initial benign-looking loader or script later fetches malware. Defenses: monitor script execution and block known malicious installers, employ allowlisting, and detect anomalous process chains.
Persistence through backdoors dominates observed malware. Mandiant reports backdoors in ~35% of IR-case malware families (2024 data). VMware/Unit42 data similarly show widespread remote admin tools. These give attackers undetected long-term access. Unlike one-shot malware, RATs matter for identity/credential hygiene: a breached account can be reused by RATs repeatedly. Remediation must include account resets and extended monitoring after any RAT detection. The prevalence of backdoors means "complete and clean" often requires rebuilding or time-consuming validation; it cannot be assumed a patched host is fully safe if credentials were captured.
Kaspersky telemetry shows spyware detections up ~51% YoY, reflecting renewed interest in surveillance and fraud. ESET’s H2 2025 report notes sophisticated mobile threats: Android NFC malware incidents rose ~87% YoY (e.g. new RAT-capable NFC Trojans), and ESET also described PromptLock as an early AI-linked ransomware demonstration, which is better treated as an emerging signal than as evidence of broad enterprise prevalence. Banking Trojans also persist (the “Trojan and loaders” category above covers many). Mobile platforms see adware/PUA surges (ESET reported Android adware detections +160% in H1 2025). Operationally, these trends expand malware risk beyond traditional endpoints into mobile fraud, OTP interception, and session theft. Enterprises should extend controls to mobile device management, fraud monitoring, and session-risk detection.
| Vector / Method | Share of Incidents / Relevance | Avg Impact / Cost | Notes |
|---|---|---|---|
| Exploited vulnerabilities (software flaws) | 20% of breaches (DBIR); 33% of intrusions (Mandiant) | High | Attackers target unpatched edge/VPN interfaces; can lead to swift domain-wide compromise. |
| Stolen credentials / credential abuse | ~22% of breaches (DBIR); 16% of intrusions (Mandiant) | High | “Login first, drop malware later.” Phishing or infostealer leaks enable deep access. |
| Phishing emails | 16% of breaches (DBIR); 14% of intrusions (Mandiant) | High | Often delivers loaders, ransomware or keyloggers. Top attack vector (combined with other social). |
| Malicious email attachments | 44.5% scripts, 24.2% executables (ESET H1 2025) | Med–High | Script-heavy attachments (Office macros, HTML/JS) drive many infections; sandbox and strict macros help. |
| Malvertising / SEO poisoning | 12% of social-engineering cases (Unit42) | Med–High | Ads or poisoned search results lead users to drive-by exploits or fake sites; calls for browser/DNS filters. |
| “ClickFix” social prompts | +500% spike (ESET) | Med–High | User-solicited execution: web prompt leads to local script execution. Converts clicks into loaders. |
| Supply-chain and dependencies | Hard to quantify, high consequence | High | Compromised updates or dependencies (e.g. npm packages or CI/CD pipelines) can inject malware widely without traditional endpoint triggers. |
These vectors often chain into multi-stage infections (MITRE ATT&CK: initial access → execution → persistence → credential theft → lateral movement → impact). For instance, phishing (Initial Access) might invoke a PowerShell (Execution) that installs a backdoor (Persistence) and harvests credentials (Credential Access), enabling exfiltration (Impact). Mapping defenses to ATT&CK tactics is more robust than matching specific malware names. Organizations should strengthen controls across Initial Access (patch management, phishing defense), Execution (script blocking), Credential Access (MFA, monitoring), and Lateral Movement (segmentation), reflecting how malware campaign phases unfold.
| Industry | Relative Exposure Level | Typical Impact Pattern | Key Notes |
|---|---|---|---|
| Healthcare | High | Disruption + data theft | DBIR: System Intrusion (incl. ransomware) is rising; patient data at risk. Critical care downtime is especially damaging. |
| Finance (Banking) | High | Credential abuse + fraud | Mandiant: finance was ~17% of IR cases (2024); financial sector faces banking trojans and credential theft for direct fraud. |
| Technology / Software | Medium–High | Supply-chain compromise + IP theft | Tech is often a staging ground (10.6% of IR cases in 2024) and suffers secondary supply-chain attacks. Software firms should guard development pipelines. |
| Manufacturing | High | Extortion + IP theft | IBM X-Force notes manufacturing was top target (27.7% of incidents in 2025); attackers aim for proprietary data and downtime. |
| Retail / E-commerce | Medium | Credential theft + outages | Payment/loyalty data theft is key; DBIR signals a shift beyond card skimmers to online account takeovers in retail breaches. |
| Government / Public Sector | Medium–High | Espionage + disruption | DBIR: public sector breaches have higher espionage motive share; ICS/SCADA malware is also a risk here. |
The sector differences arise from attack surface and tolerance: Healthcare has many endpoints and sensitive PII under strict regs, so ransomware and intrusion spikes (disrupting services) are highlighted. Finance has high-value accounts, so malware enabling fraud (banking Trojans, account takeover) is critical. Tech/software sees heavy supply-chain targeting (both to steal IP and propagate malware). Manufacturing’s prevalence (IBM: 27.7%) reflects high disruption potential (downtime kills production) and intellectual property theft. Retail sees both data theft and sporadic denial-of-service. Public sector often blends espionage (e.g. via RATs) with occasional disruption. These patterns suggest different priorities: e.g. healthcare must prioritize backup/segmentation for uptime, finance must sharpen identity and transaction monitoring, and manufacturing must invest in OT/ICS controls and data exfiltration monitoring.
| Region | Key Trend | Cost or Impact Signal | Notes |
|---|---|---|---|
| APAC | Surge in credential theft | More account takeovers | Kaspersky: password stealer detections +132% YoY in APAC. Suggests rising financial fraud and cloud account risk. |
| CIS | Web/mobile threats prevalent | Frequent drive-by and mobile infections | Kaspersky: web threats highest in CIS (34% of users); attackers often leverage browser exploits or malicious ads. |
| Africa | High local-threat detection | Widespread commodity malware | Kaspersky: 41% of detected threats in Africa are local (mostly older malware), reflecting high endemic risk environments. |
| Europe | Browser-script campaigns & infostealers | Banking trojan targeting | Microsoft notes ClickFix and other script vectors used widely across EU; historical focus on banking trojans still relevant (e.g. Dridex/Trickbot variants). |
The data are skewed by differing reporting and telemetry footprint, but patterns emerge: APAC’s high credential-stealer jump may tie to its large user base adopting new apps (and gaps in MFA). CIS’s web threat share implies many unpatched browsers/OS. Europe’s note refers to documented ClickFix and continued banking malware campaigns (which feed global financial crime). North America (not tabulated) would emphasize cloud/SaaS, as IBM found NA was 29% of X-Force cases in 2025. In all regions, the combination of local device hygiene and globalized attack methods means both boundary hardening and identity controls remain vital.
| Attribute | Malware Activity | Ransomware Operations | Broader Intrusion Activity |
|---|---|---|---|
| Primary Objective | Execute code for access, theft, persistence | Extort value via encryption and/or data theft | Achieve attacker goals (espionage, fraud, damage) |
| Typical Entry / Use | Phishing, web exploits, drive-by downloads, malvertising often to drop malware payloads in systems | Usually follows credential theft or exploits after network compromise | Exploits, stolen credentials, or insider misuse; may plant malware or use direct credential abuse |
| Business Impact | Variable from nuisance (spamware) to severe (mass compromise) | Often high: downtime + crisis response (for paid or unpaid events) | Depends: could be stealthy data theft (sometimes unnoticed) or direct disruption (if malware-deployed) |
| Detection Pattern | High volume of alerts (blocked malware samples); many get caught by AV/EDR | High-signal: detected by ransomware signatures or extortion notes | May involve subtle indicators (abnormal logins, data flow) or third-party notice |
| Recovery Complexity | Host cleanup and credential resets; depends on malware's persistence | Plus network restore (from backups), PR response; often multi-dept. recovery | Extensive IR and monitoring; may require identity rebuild and long-term surveillance |
| Executive Relevance | Indicates baseline threat level and control efficacy | Direct business interruption risk; board-level crisis concern | Defines overall cyber risk posture (fraud, IP theft, regulatory exposure) |
Malware attacks often form part of larger intrusion chains. For instance, a credential-harvesting infostealer (malware) can lead to full breach or ransomware deployment. As Mandiant data shows backdoors are more prevalent than ransomware in malware samples, and Unit42 highlights browser + identity fronts, executives should see “malware” not as isolated viruses but as tools attackers embed in networks. The full incident story typically spans initial access (could be malware-free), then malware installation, lateral movement, and ultimate impact (theft or extortion). Thus, metrics on “malware” activity alone understate the complexity; good strategy covers both preventing malware execution and detecting early intrusion signals.
The latest data converge on a clear priority shift for enterprise defense:
In summary, the numbers point to concrete actions: tighten identity/web controls, segment aggressively, and optimize detection/response workflows. Every stat such as 19% of cases reaching exfiltration in under an hour should trigger an operational question: How quickly can we isolate affected assets, revoke compromised access, and contain lateral spread?
Each control above directly targets an observed weak point: MFA breaks the stolen credential vector; email/script policies block the bulk of malware loaders; automation addresses speed; supply-chain checks counter hidden infestations.
Risk modeling translates these stats into dollars of expected loss:
Expected Loss=Probability of Malware IncidentBusiness Impact
By feeding real stats (breach frequency from DBIR, rapid exfil rates from IR) into loss models, CISOs can quantify how much to spend on preventive vs detective controls, and communicate cyber risk in business terms. For instance, if identity controls cut credential theft-based breaches by X%, that can be shown as Y dollars saved annually.
Quantified measures of malicious software activity, such as counts of detected malware samples or detections, prevalence of malware families, infection methods, and incident impacts. They capture trends in how malware is used to breach and compromise systems.
Very common, but the measurement model matters. AV-TEST reports roughly 450,000 new malware samples per day, while Kaspersky telemetry reported roughly 500,000 malicious files detected per day in its ecosystem. Those figures describe attacker output and detection activity, not confirmed enterprise compromise. Confirmed breach datasets such as DBIR should be interpreted separately.
Backdoors/RATs dominate many datasets. Mandiant’s 2024 IR cases show backdoors (remote access Trojans) at ~35% of malware families, with ransomware payloads only ~14%, and droppers/downloaders at ~8-12%. Credential-stealing malware is also common. In practice, many attackers deploy multi-stage chains, so info-stealers, trojans, and loaders all feature heavily.
Through familiar paths: exploits on internet-facing systems, stolen credentials used to log in and drop malware, phishing emails with attachments or links, malicious web pages/adverts (malvertising) infecting browsers, and via supply-chain or USB vectors. For example, Verizon and Mandiant data show exploitation and credential theft accounting for ~20-33% and ~10-22% of intrusions respectively. Recently, user-initiated script prompts (e.g. “ClickFix”) have also spiked as an inventive delivery mechanism.
All sectors see malware, but patterns vary. Mandiant’s 2024 data had finance (17.4%), tech (10.6%), government (9.5%), and healthcare (9.3%) most hit. IBM X-Force (2025) reports manufacturing topped at 27.7% of incidents. Healthcare often suffers high-impact ransomware, finance faces banking Trojans/credential attacks, and manufacturing sees extortion/IP theft focus. Public sector has a notable espionage component. Ultimately, any organization with sensitive data or critical operations is at risk, so industry differences inform nuance rather than elimination of threats.
“Malware” is any malicious software (viruses, Trojans, RATs, spyware, etc.) used for various goals. “Ransomware” is a subset of malware specifically designed to encrypt or leak data for extortion. Ransomware often appears late in an intrusion chain (after initial access by malware-free or other malware vectors). Not all malware is ransomware, and many breaches involve both: e.g., an infostealer Trojan may lead to credentials that are then used to deploy ransomware. So ransomware stats (e.g., 44% of breaches) reflect a particular outcome, whereas general malware stats include all payloads and attempts.
By layering defenses at each stage (see Best Practices above). Crucial measures include enforcing strong multi-factor authentication, isolating or filtering malicious email/web content, deploying advanced EDR/XDR for fast detection/containment, and practicing good patching/segmentation. User training and phishing simulations remain important because social engineering and user-executed scripts still feature prominently in modern malware delivery. Regularly reviewing telemetry (to catch new malware families) and testing incident response (to ensure rapid reaction to things like sub-hour exfiltration) further reduces risk.
No. Detections are sensor or AV alerts (often blocked automatically), whereas incidents are verified compromises. For example, AV-TEST tracks newly observed malware samples at scale, while DBIR analyzes confirmed breach cases. One describes attacker output and observed artifacts; the other describes successful compromises. Similarly, malware sample libraries grow, but many samples never reach enterprise endpoints. Analysts must treat detection counts and breach counts separately: a high detection volume means high threat activity, but a confirmed incident count reflects actual damage events.
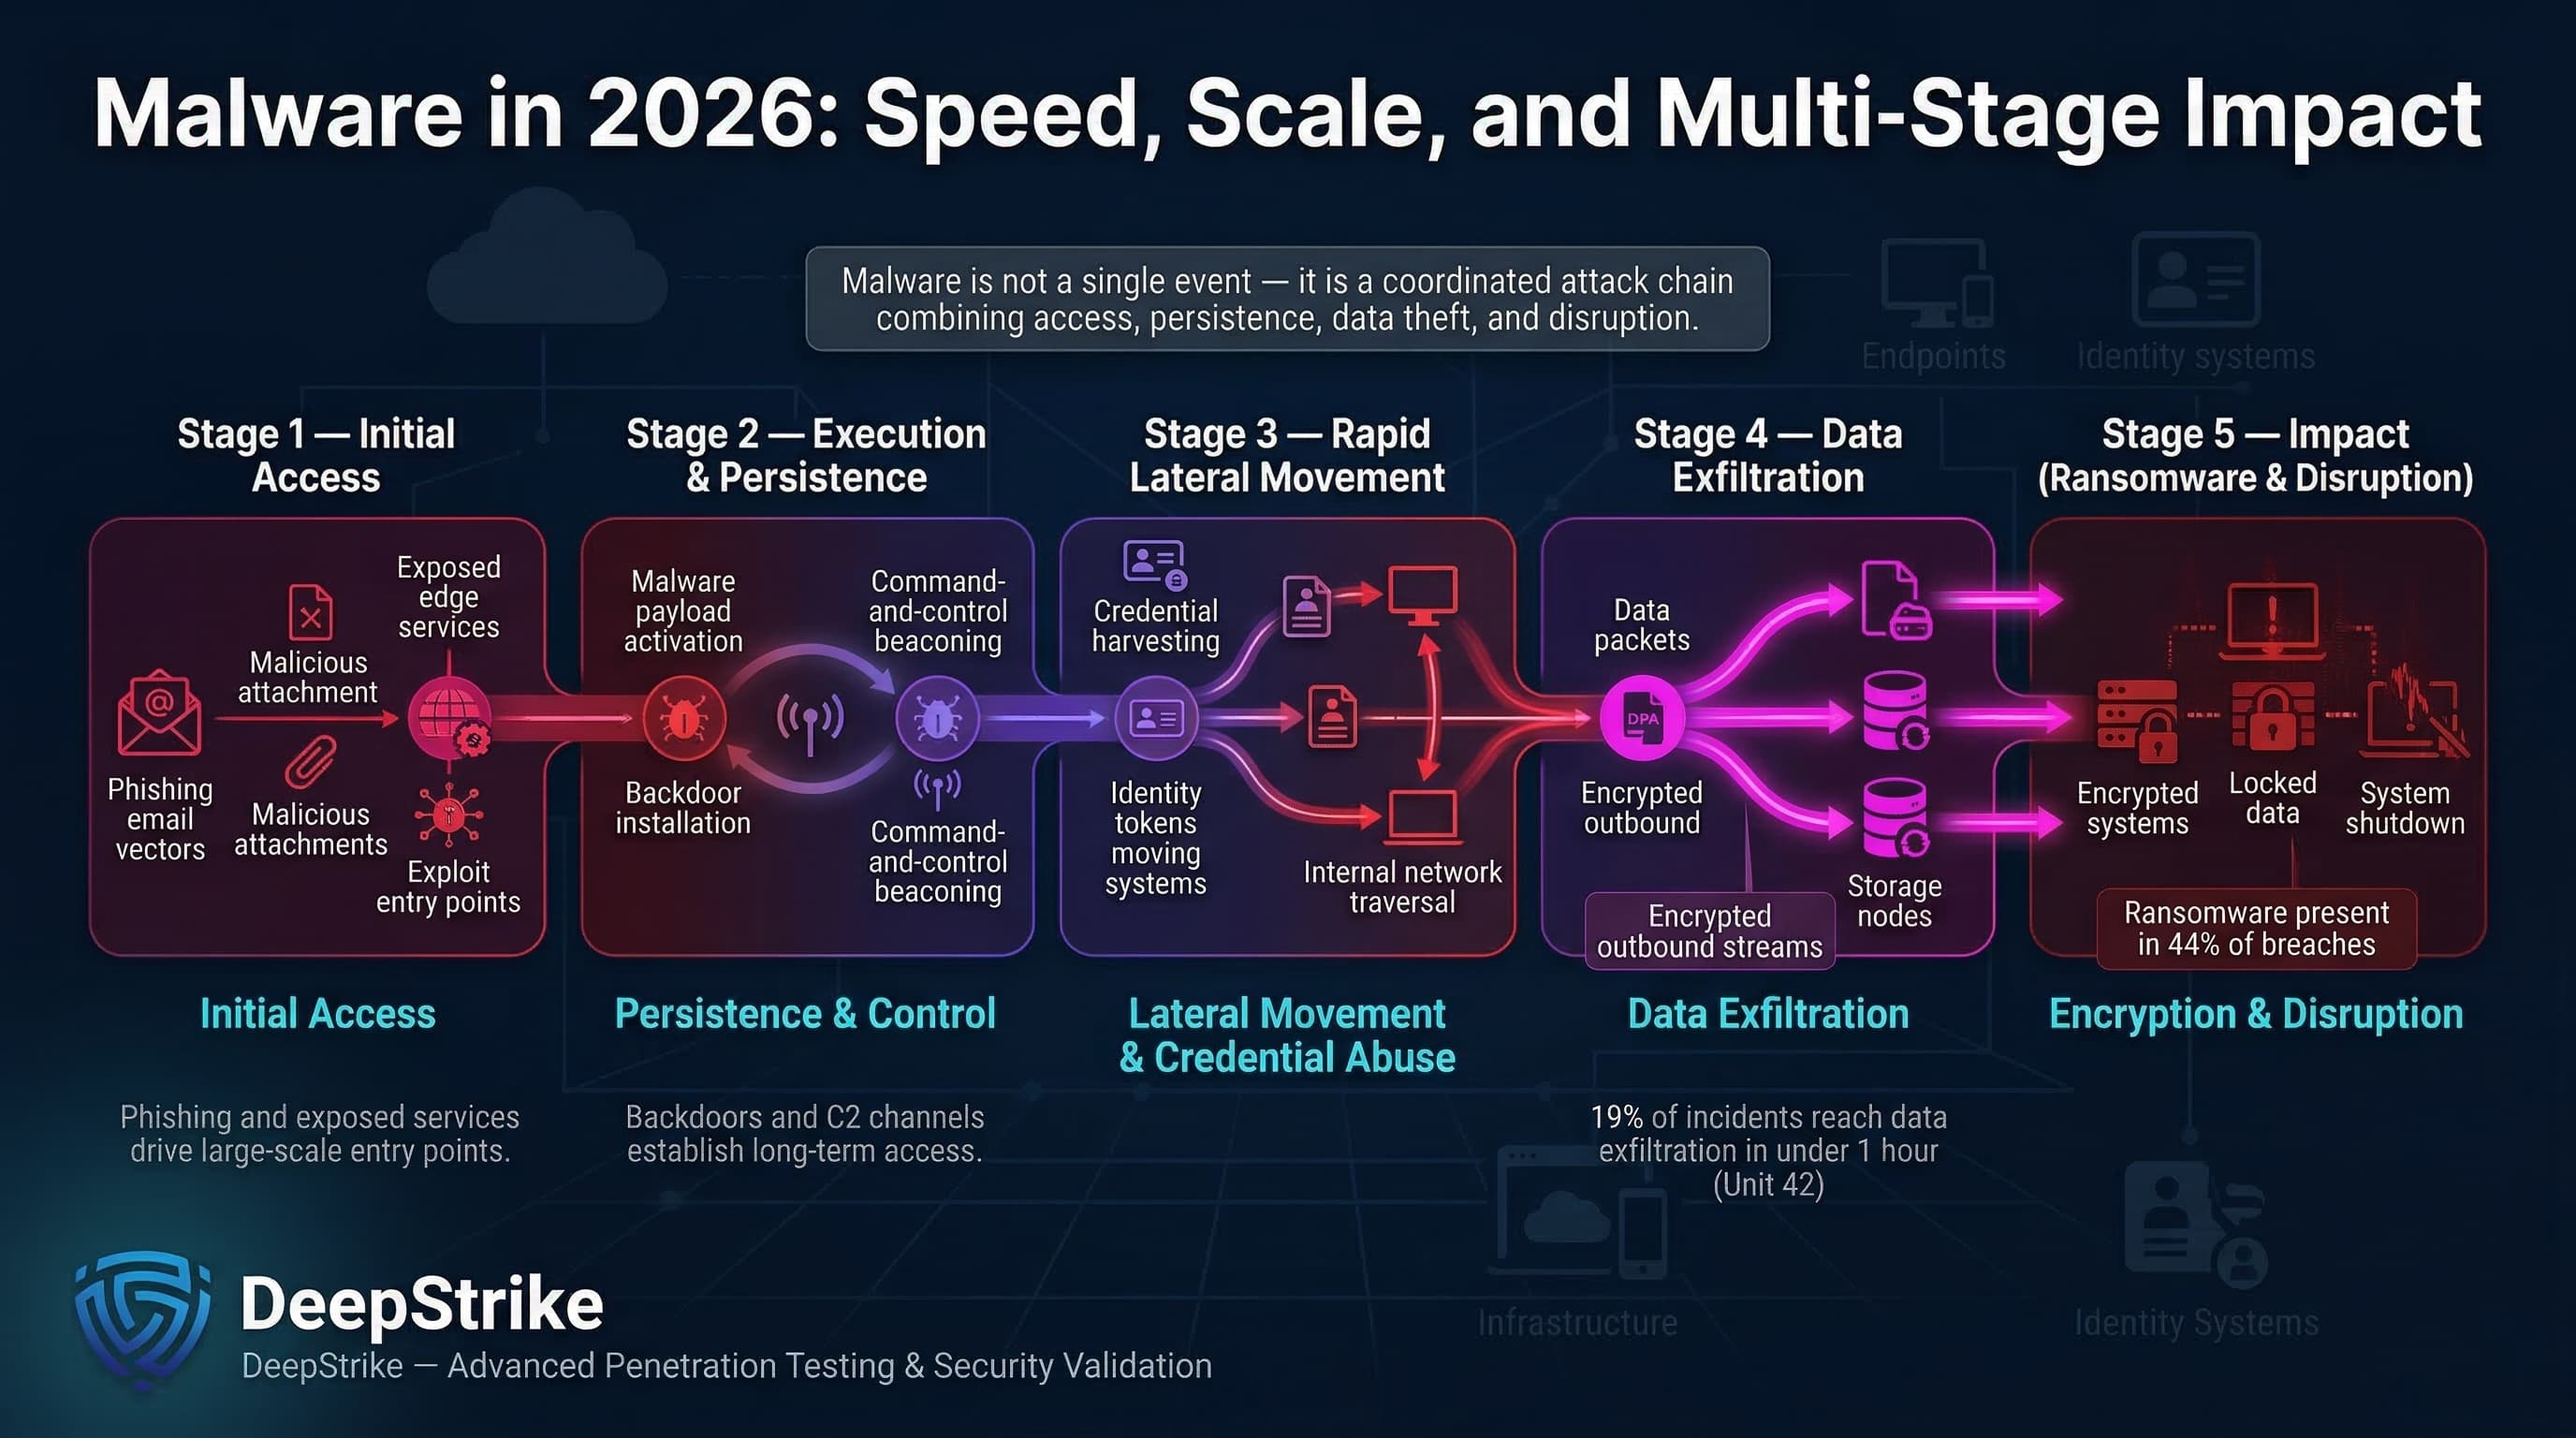
The latest malware statistics (from 2025 datasets) paint a picture of vast threat volume and swift impact. We see high-volume detections every day, often delivered via phishing and exposed edge exploits, leading to rapid intrusions: in Unit 42 incident-response data, about 19% of cases reached data exfiltration in under an hour. Ransomware remains ubiquitous (44% of breaches) but is only one stage of an attack chain. Malware collectively spans credential theft, persistence (backdoors), covert data theft, and disruptive encryption.
Organizations should not treat malware as just “viruses” but as a broad category of execution and intrusion tools. The statistics suggest concrete priorities: secure identities (to block 22% of breaches starting with stolen credentials), harden perimeter and application exposure, monitor browser/script activity, and enable response speed. By aligning security investments with these data for example, strengthening email and identity controls, segmenting networks, and automating isolation executives can turn raw malware figures into improved resilience and lower expected losses.
Mohammed Khalil is a Cybersecurity Architect at DeepStrike, specializing in advanced penetration testing and offensive security operations. With certifications including CISSP, OSCP, and OSWE, he has led numerous red team engagements for Fortune 500 companies, focusing on cloud security, application vulnerabilities, and adversary emulation. His work involves dissecting complex attack chains and developing resilient defense strategies for clients in the finance, healthcare, and technology sectors.

Stay secure with DeepStrike penetration testing services. Reach out for a quote or customized technical proposal today
Contact Us