October 4, 2026
Updated: November 5, 2026
Breach Data, Human Risk, AI, Insider Risk & Training Effectiveness
Abdalla Mohamed
Human error cybersecurity statistics show that people remain deeply involved in modern security incidents, but the numbers are often misunderstood. The Verizon 2026 Data Breach Investigations Report found that the non-intentional human element contributed to 62% of breaches. At the same time, vulnerability exploitation became the leading initial access vector at 31%. The lesson is not that employees “cause” every breach. Attackers routinely combine human decisions, identities, permissions, communication channels, and mistakes with technical weaknesses.
For a wider benchmark of threat activity beyond the human element, see DeepStrike’s cybersecurity statistics. This report stays focused on how human behavior, error, social engineering, identity compromise, insiders, and AI usage influence security outcomes.
| Statistic | Figure | Primary source |
|---|---|---|
| Non-intentional human element in breaches | 62% | Verizon DBIR 2026 |
| Breaches starting with vulnerability exploitation | 31% | Verizon DBIR 2026 |
| Mobile social-engineering success vs. traditional email phishing | 40% higher | Verizon DBIR 2026 |
| Frequent employee use of AI tools on corporate devices | 45%, up from 15% | Verizon DBIR 2026 |
| CISOs naming human risk their biggest cyber vulnerability | 79% | Proofpoint 2026 |
| CISOs saying departing employees played a role in material data loss | 93% | Proofpoint 2026 |
| CISOs viewing GenAI as a security risk | 78% | Proofpoint 2026 |
| CISOs saying employees may use AI in ways that expose sensitive data | 76% | Proofpoint 2026 |
| Baseline phishing susceptibility before training | 33.2% | KnowBe4 2026 |
| Phishing susceptibility after 12 months of continuous training | 4.2% | KnowBe4 2026 |
| Global average cost of a data breach | $4.99M | IBM 2026 |
| Malicious breaches that were AI-enabled (IBM study sample) | About 1 in 4 (up 56% YoY) | IBM 2026 |
| Organizations expecting email security challenges in 2026 | 96% | Mimecast 2026 |
| Organizations concerned about sensitive-data leaks through GenAI tools | 80% | Mimecast 2026 |
Source: Verizon 2026 DBIR
Source: Proofpoint 2026 Voice of the CISO
Source: KnowBe4 2026 Phishing by Industry Benchmarking Report
Source: IBM Cost of a Data Breach Report 2026
Source: Mimecast State of Human Risk 2026
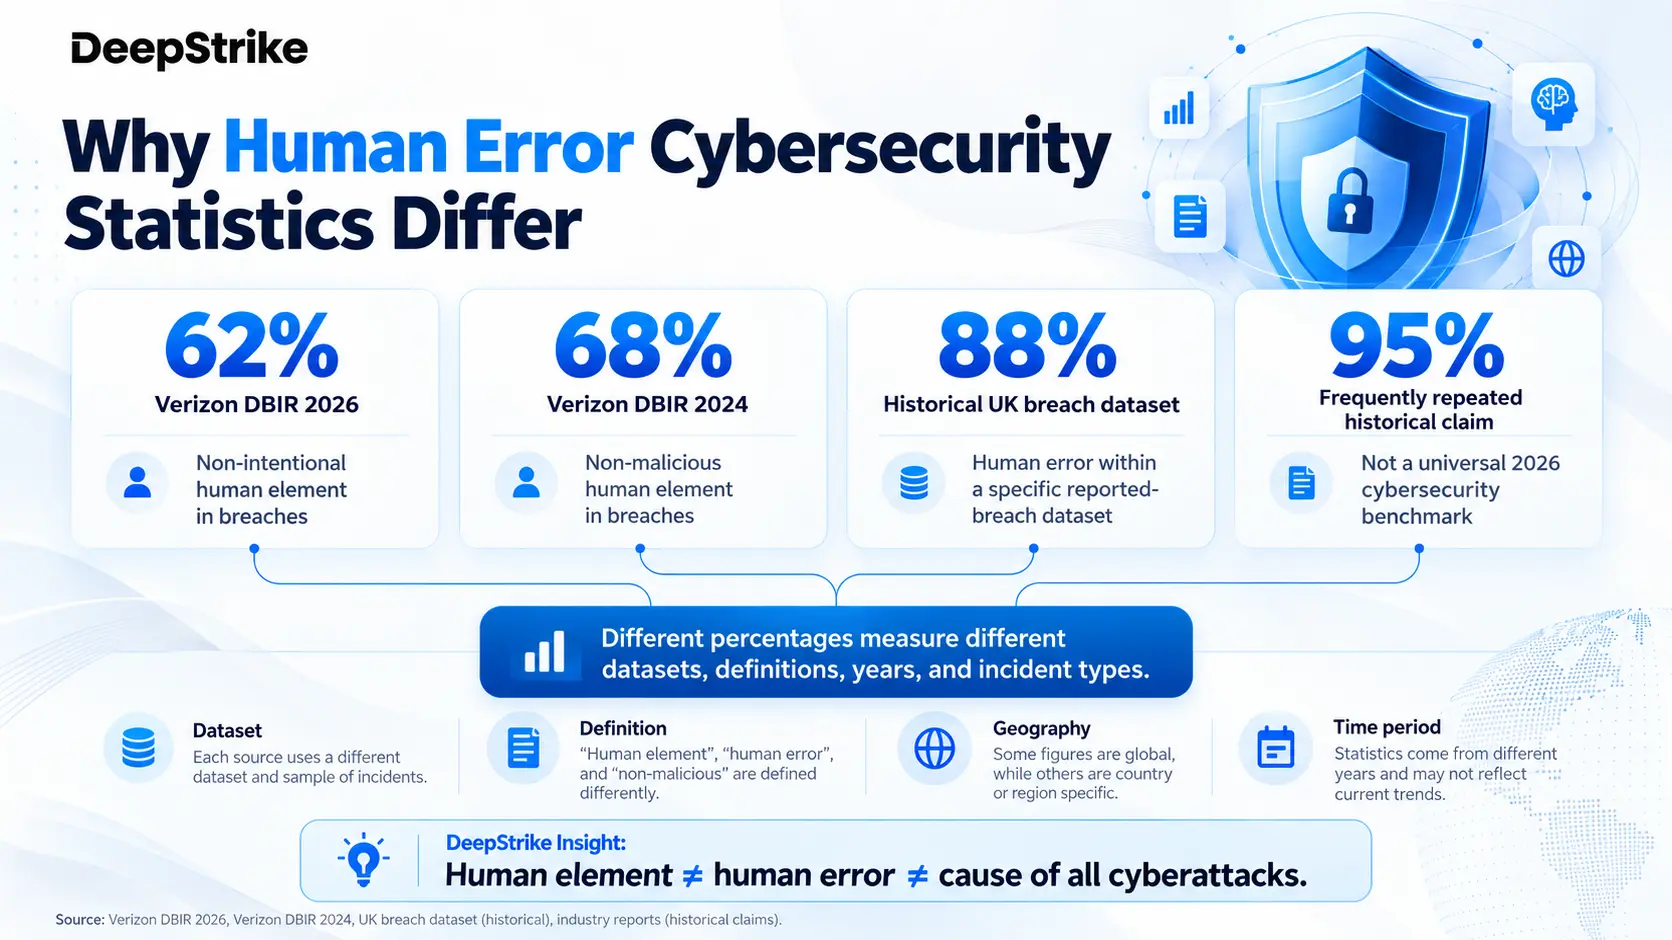
The strongest current benchmark is Verizon’s finding that the non-intentional human element reached 62% of breaches. Verizon recorded 60% in the previous edition, so the movement is modest rather than a dramatic shift.
That does not mean employees independently caused 62% of all cyberattacks. Verizon’s measurement captures a defined contribution to confirmed breaches and includes situations where a person makes an error or is targeted through social engineering. The attacker, the technical environment, and the security controls still matter.
The broader breach picture is important: 31% of breaches now start with vulnerability exploitation. This is why a mature security program cannot choose between “people problems” and “technical problems.” Real attacks often combine both.
Cybersecurity articles often quote very different percentages because the underlying studies use different definitions, incident types, populations, geographies, and time windows. “Human element,” “human error,” “insider risk,” and “social engineering” are not interchangeable. Verizon’s 2024 DBIR reported a 68% non-malicious human element under an earlier reporting window. The often-quoted 88% is attributed to older analyses of UK reported-breach data; we could not trace its original source or population, so treat it as a historical claim rather than a current benchmark.
| Avoid the 95% shortcut Do not write “95% of cyberattacks are caused by human error” as a current universal fact. The safest approach is to preserve the exact terminology, year, and denominator used by the original dataset. |
|---|
Human error in cybersecurity is an unintentional action or failure to act that weakens security, exposes information, or contributes to an incident. Examples include sending sensitive information to the wrong recipient, applying incorrect access permissions, using unsafe authentication practices, misconfiguring cloud resources, delaying patches, or approving a fraudulent request.
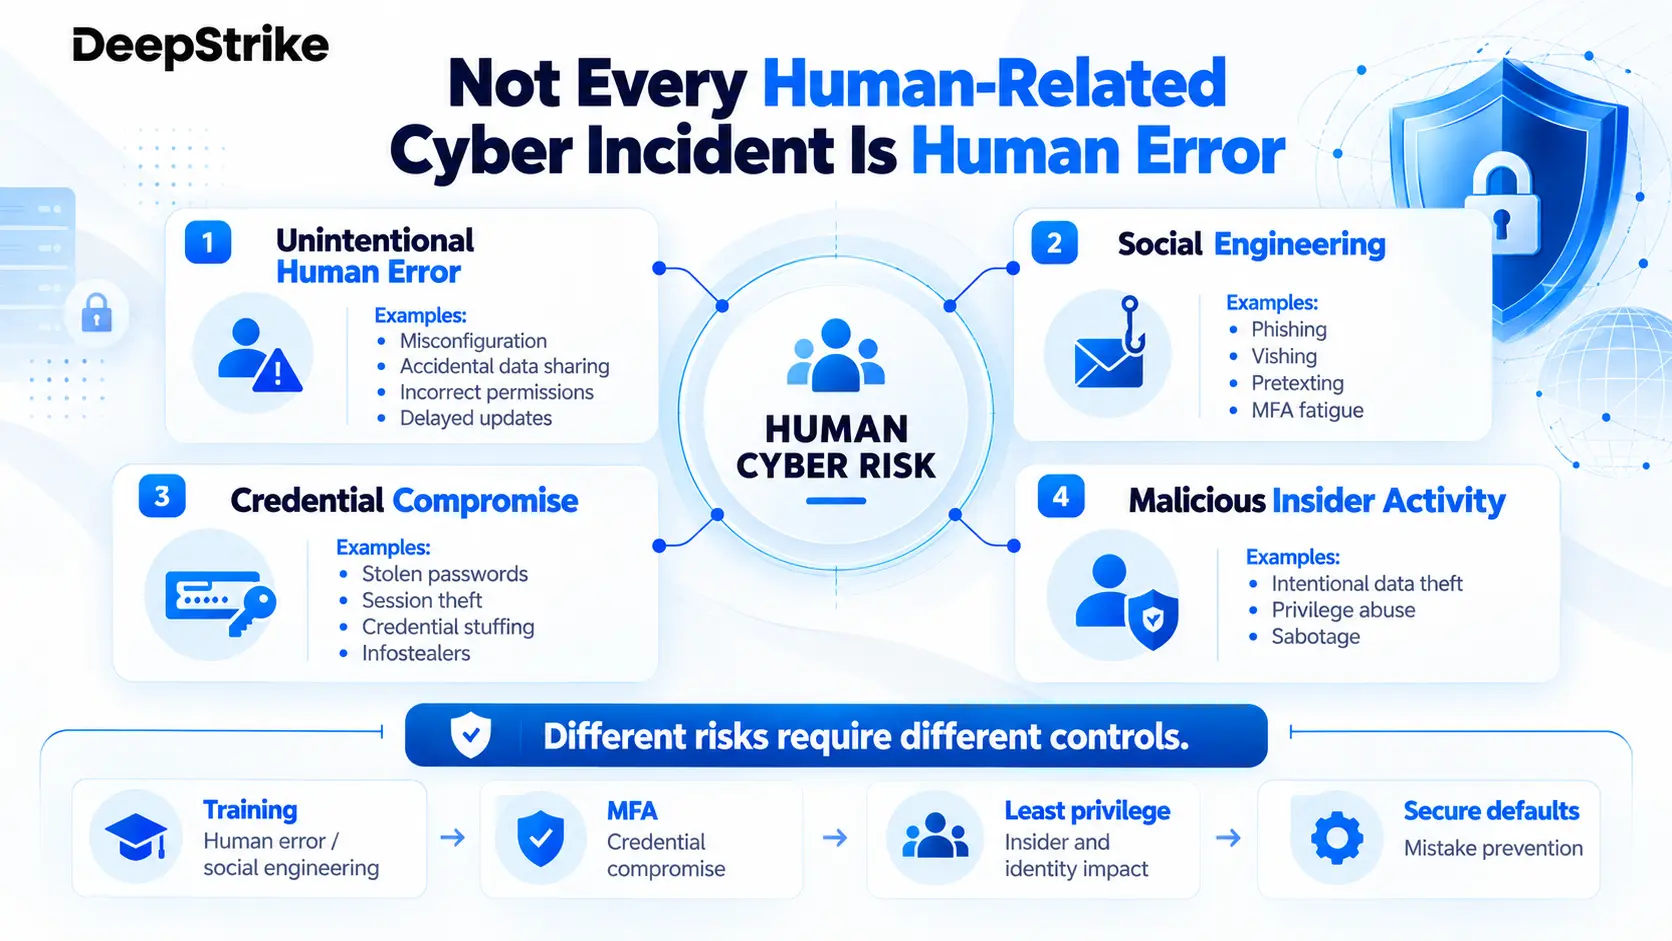
The definition becomes less useful when every incident involving a person is labeled “human error.” A malicious insider is a person, but intentional data theft is not an error. An account accessed with credentials stolen through malware involves identity risk, but the compromise may not originate from a user mistake.
| Category | Meaning | Example |
|---|---|---|
| Unintentional human error | A legitimate user makes an unintended mistake | Misconfiguring storage or sending data to the wrong recipient |
| Social engineering | An attacker manipulates a person into taking an action | Phishing, vishing, pretexting, MFA fatigue |
| Credential compromise | Authentication material is stolen or abused | Stolen passwords, session tokens, credential stuffing |
| Malicious insider activity | An authorized person intentionally acts against the organization | Deliberate data theft or sabotage |
| Human behavior | Potential security consequence |
|---|---|
| Clicking a malicious link or approving a fraudulent request | Credential theft, malware, account compromise |
| Reusing passwords | Credential stuffing and account takeover |
| Sharing authentication information | Unauthorized access |
| Misconfiguring cloud or SaaS resources | Public data exposure |
| Granting excessive privileges | Larger breach blast radius |
| Sending data to the wrong recipient | Confidentiality breach |
| Delaying security updates | Longer exploitation window |
| Using unauthorized SaaS services | Shadow IT exposure |
| Uploading sensitive data to unapproved AI tools | Shadow AI and data leakage |
| Approving repeated MFA prompts | MFA fatigue compromise |
| Failing to revoke former employee access | Insider or account misuse |
Repeated mistakes are often a design signal, not merely an employee-performance issue. Workload, poor interfaces, confusing approval flows, weak defaults, excessive privileges, alert fatigue, and unrealistic policy can all make unsafe actions more likely.
Phishing is one of the clearest examples of attackers deliberately targeting human decision-making. Verizon reports that mobile-centric social engineering such as fraudulent text messages and voice calls achieves a 40% higher success rate than traditional email phishing.
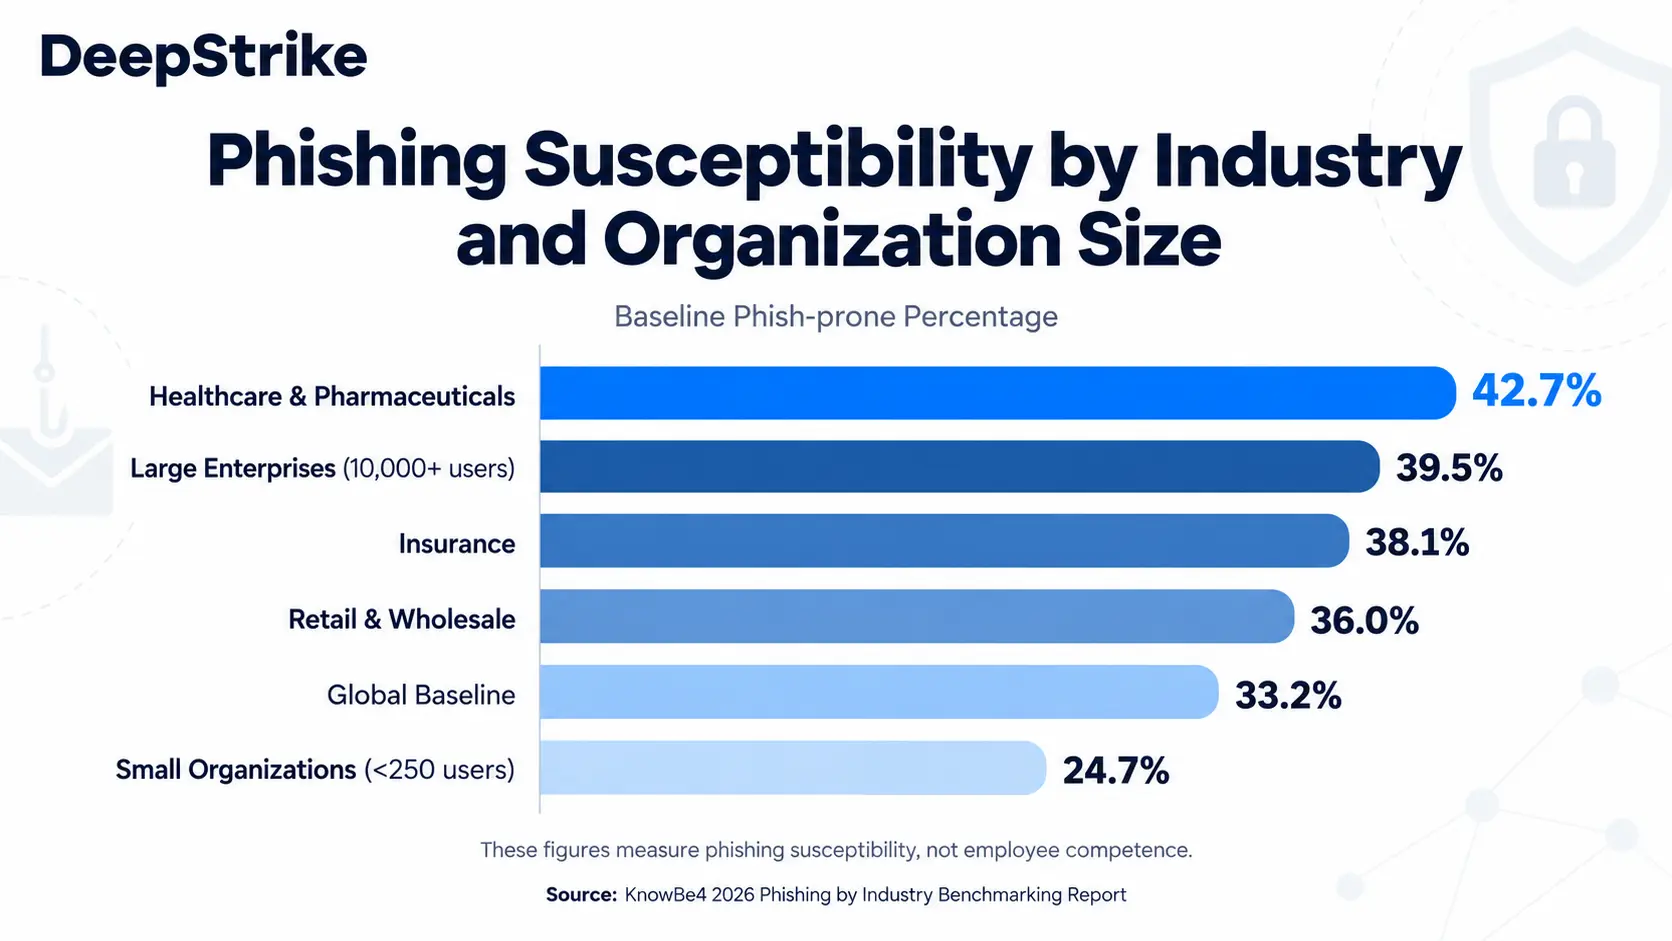
KnowBe4’s 2026 benchmark places the global baseline Phish-prone Percentage at 33.2%, while large organizations with more than 10,000 employees start at 39.5%. Healthcare and Pharmaceuticals, Insurance, and Retail & Wholesale are among the highest-risk industry groups at baseline.
For deeper attack-specific data, see DeepStrike’s phishing statistics and social engineering statistics. The purpose of this article is to connect those attack patterns to the broader human-risk picture rather than duplicate those pages.
A compromised identity may originate from password reuse, phishing, infostealer malware, session-token theft, MFA fatigue, weak recovery processes, excessive privileges, or poor employee offboarding. Some of these involve user behavior, while others exploit weaknesses in identity architecture.
This distinction matters because better passwords cannot compensate for poor access-control design. DeepStrike’s password statistics, credential stuffing statistics, and account takeover statistics cover the surrounding identity risks in more depth.
CISA recommends moving toward phishing-resistant MFA because some push, SMS, and OTP-based approaches can still be socially engineered or bypassed. Identity programs should pair strong authentication with least privilege, secure recovery, behavioral monitoring, and prompt offboarding.
Proofpoint’s 2026 Voice of the CISO surveyed 1,600 CISOs across 16 countries. Seventy-nine percent identified human risk as their organization’s biggest cyber vulnerability, up from 66% in 2025.
Among organizations that experienced material data loss, malicious or criminal insiders were cited by 46%, while careless and compromised insiders were each cited by 38%. These categories describe very different problems and should not all be labeled “human error.”
Offboarding is particularly important. Proofpoint reports that 93% of CISOs at organizations experiencing material data loss said departing employees played a role. Access revocation, token invalidation, privileged-account review, device recovery, SaaS removal, and unusual-transfer monitoring therefore belong in the human-risk program.
For a dedicated breakdown, see DeepStrike’s insider threat statistics.
AI is creating a new category of human cyber risk. Verizon reports that frequent employee use of AI tools on corporate devices rose from 15% to 45% in one year, while its executive summary notes that unauthorized GenAI services are increasingly involved in data-loss prevention events.
Proofpoint found that 78% of CISOs view GenAI as a security risk and 76% believe employees may use AI in ways that expose sensitive data. Mimecast separately reports that 80% of surveyed organizations are concerned about sensitive-data leakage through generative AI tools.
IBM’s 2026 Cost of a Data Breach research found that about one in four malicious breaches in its study were AI-enabled, a 56% increase over the previous year. AI lowers the cost of creating polished phishing content, voice and deepfake impersonation, personalized pretexts, and malware-assisted campaigns.
This weakens the value of old awareness advice built around obvious grammar mistakes and awkward language. Independent verification, strong authentication, transaction controls, and secure workflow design are increasingly important.
Employees can unintentionally disclose source code, customer data, confidential documents, internal strategy, credentials, legal material, or regulated information by pasting it into an unauthorized AI service. In many cases the employee is trying to work faster, not acting maliciously.
Organizations need approved AI platforms, data-classification rules, DLP coverage, access controls, logging, model governance, and realistic policy. Teams operating AI systems can also validate technical weaknesses through LLM and AI penetration testing.
Mimecast’s State of Human Risk 2026 surveyed 2,500 IT security and IT decision-makers across nine countries. Ninety-six percent expect email-security challenges in 2026, 71% expect negative business impact from collaboration-tool attacks, and 80% are concerned about sensitive data leaks through generative AI tools.
Attackers increasingly combine channels. A campaign can begin with email, move to Teams or Slack, continue by voice, and end with a fraudulent approval or credential reset. Correlating identity, email, endpoint, collaboration, cloud, and DLP signals gives security teams a better chance of seeing the whole attack path.
KnowBe4’s 2026 industry benchmark reports baseline phishing susceptibility of 42.7% in Healthcare & Pharmaceuticals, 38.1% in Insurance, and 36% in Retail & Wholesale.
| Industry / segment | 2026 baseline Phish-prone Percentage |
|---|---|
| Healthcare & Pharmaceuticals | 42.7% |
| Insurance | 38.1% |
| Retail & Wholesale | 36.0% |
| Large enterprises (10,000+ users) | 39.5% |
| Small organizations (<250 users) | 24.7% |
These figures are not employee competence scores. Different industries have different workflows, attack surfaces, threat actors, compliance obligations, access models, and exposure to external communication.
Organizations with distributed workforces can also compare the issue with DeepStrike’s remote work cybersecurity statistics.
There is no defensible universal price tag for “human error” because breaches usually involve several contributing factors. The better approach is to use broader breach economics to understand the financial environment surrounding identity compromise, deception, insider risk, and mistakes.
IBM’s Cost of a Data Breach Report 2026 places the global average breach cost at $4.99 million, up 12% year over year. IBM also found that about one in four malicious breaches in its study were AI-enabled (up 56% over the previous year), and it reports $1.93 million in average cost savings associated with extensive use of AI and automation in security.
The FBI 2025 Internet Crime Report received 1,008,597 complaints and recorded reported losses of nearly $21 billion. These are not “human error costs”; they show the financial scale of cyber-enabled fraud, phishing, extortion, and other internet crime.
DeepStrike’s cost of a data breach article provides broader context on breach economics and response costs.
Security awareness training statistics point in two directions. Vendor benchmarks show large drops in simulated-phishing failure after months of continuous training, while the largest independent controlled study found almost no difference between trained and untrained employees. Verizon’s data adds a third signal: recent training raises phishing report rates far more than it lowers click rates. The defensible conclusion is that training improves reporting and awareness, but it cannot be the main control against phishing.
| Statistic | Figure | Source | Source type |
|---|---|---|---|
| Median click rate, email phishing simulations | 1.4% (8,395 campaigns) | Verizon DBIR 2026 | Industry research |
| Median click rate, phone and SMS simulations | About 2% (40% higher than email) | Verizon DBIR 2026 | Industry research |
| Social Engineering share of breaches | 16% | Verizon DBIR 2026 | Industry research |
| Simulated-phish report rate, trained in last 30 days vs. base rate | About 21% vs. 5% | Verizon DBIR 2025 | Industry research |
| Click-rate improvement per recent training | About 5% (relative) | Verizon DBIR 2025 | Industry research |
| Failure-rate gap, embedded training vs. no-training control | 1.7 percentage points | UC San Diego, IEEE S&P 2025 | Peer-reviewed randomized trial |
| Employees who failed at least one simulation in 8 months | 56% | UC San Diego, IEEE S&P 2025 | Peer-reviewed randomized trial |
| Embedded training sessions ending within 10 seconds | More than half | UC San Diego, IEEE S&P 2025 | Peer-reviewed randomized trial |
| Users who formally completed embedded training | Less than 24% | UC San Diego, IEEE S&P 2025 | Peer-reviewed randomized trial |
| Baseline Phish-prone Percentage | 33.2% | KnowBe4 2026 | Vendor benchmark |
| Phish-prone Percentage after 12 months of training | 4.2% (87% below baseline) | KnowBe4 2026 | Vendor benchmark |
| Companies with a security awareness program | 99% | Proofpoint 2024 State of the Phish | Vendor research |
| Employees who knowingly took a risky action | 68% | Proofpoint 2024 State of the Phish | Vendor survey |
| Organizations combining regular training with continuous monitoring | 28% | Mimecast 2026 | Vendor survey |
Sources: Verizon 2026 DBIR, Verizon 2025 DBIR, the UC San Diego and University of Chicago paper Understanding the Efficacy of Phishing Training in Practice, the KnowBe4 2026 benchmark and Proofpoint’s 2024 State of the Phish. KnowBe4, Proofpoint and Mimecast sell security awareness or email security products, so their figures are labeled as vendor data.
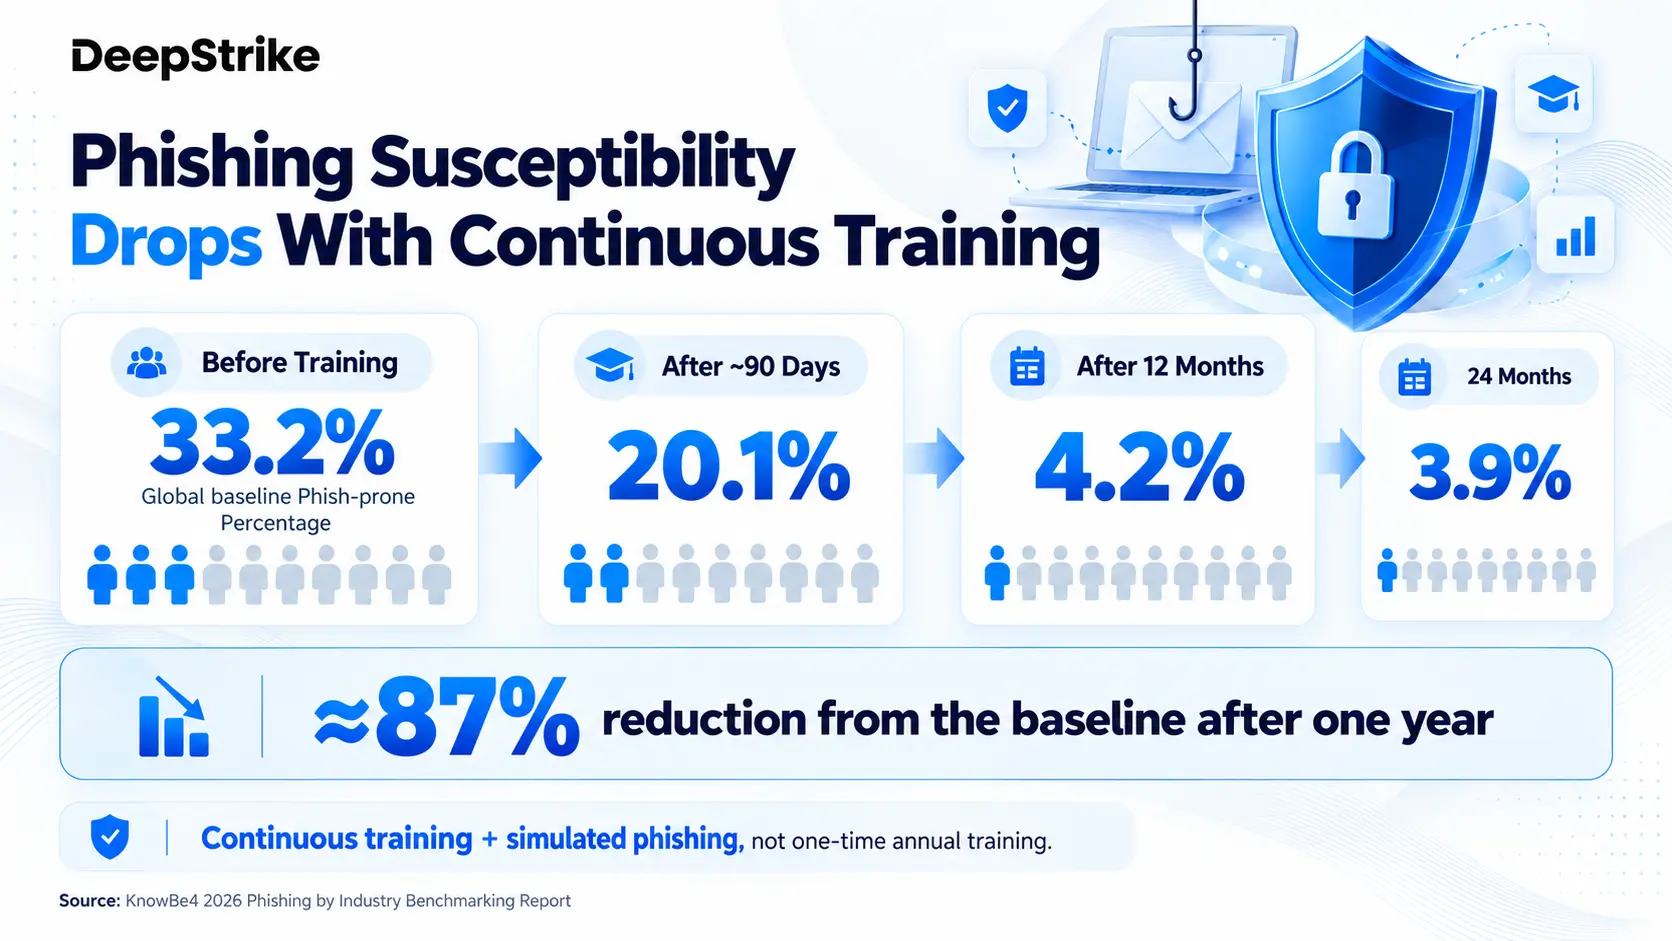
KnowBe4’s 2026 Phishing by Industry Benchmarking Report analyzed millions of simulated phishing interactions and found the global average Phish-prone Percentage fell from 33.2% before training to 20.1% after roughly 90 days and 4.2% after 12 months of continuous training and simulation.
| Training stage | Global Phish-prone Percentage |
|---|---|
| Baseline | 33.2% |
| After approximately 90 days | 20.1% |
| After 12 months | 4.2% |
| After 24 months | 3.9% |
KnowBe4 describes the 90-day result as a 40% drop and the 12-month result as an 87% reduction from baseline, with North American organizations at 4.0% after a year and large healthcare organizations starting as high as 54%. Two caveats matter. The Phish-prone Percentage counts users who click, open or otherwise engage with a simulated phish, so it is not the same metric as a click rate. And the data comes from organizations using KnowBe4’s platform, without a no-training control group, so it shows what happens in customer programs rather than proving that training alone caused the change.
Proofpoint’s research shows the gap between awareness and behavior. Proofpoint says 99% of companies have a security awareness program, yet in its 2024 State of the Phish survey 71% of working adults admitted taking a risky action, such as reusing a password or clicking a link from an unknown sender, and 96% of them knew the action was risky. That means 68% of employees knowingly took the risk. Most cited convenience, saving time or urgency, and 94% said they would prioritize security if controls were simpler to use.
The Verizon 2026 DBIR puts the median click rate of email phishing simulation campaigns at 1.4%, based on 8,395 campaigns supplied by simulation providers. Simulations delivered by phone or text message had a median closer to 2%, which is the 40% increase Verizon highlights for mobile-centric social engineering. The phone and SMS sample was small, only 35 campaigns, and Verizon says it hopes to collect more for the 2027 report.
Verizon does not treat training as a cure. Social Engineering was the third most common breach pattern at 16% of breaches, 41% of Social Engineering breaches involved vectors other than email, and pretexting reached 6% of all breaches. Verizon notes that email-focused simulation does little to prepare help desk and support staff for an attacker on the phone who builds a believable story in real time.
Reporting is where training shows its clearest effect. In the 2025 DBIR, users who had completed training within the previous 30 days reported simulated phishing at about 21%, against a base rate of 5%, a fourfold relative increase. The effect on clicking was much smaller, about a 5% relative improvement per training, and in the median organization roughly 1.5% of employees kept clicking despite repeated training. Verizon’s conclusion was to encourage and automate reporting, because a fast report helps the security team block the message and find anyone who already clicked.
The strongest independent evidence comes from Understanding the Efficacy of Phishing Training in Practice, presented at the 2025 IEEE Symposium on Security and Privacy by researchers from UC San Diego and the University of Chicago. The team ran an eight-month randomized controlled experiment with ten simulated phishing campaigns sent to more than 19,500 employees of UC San Diego Health, including a control group that received no embedded training.
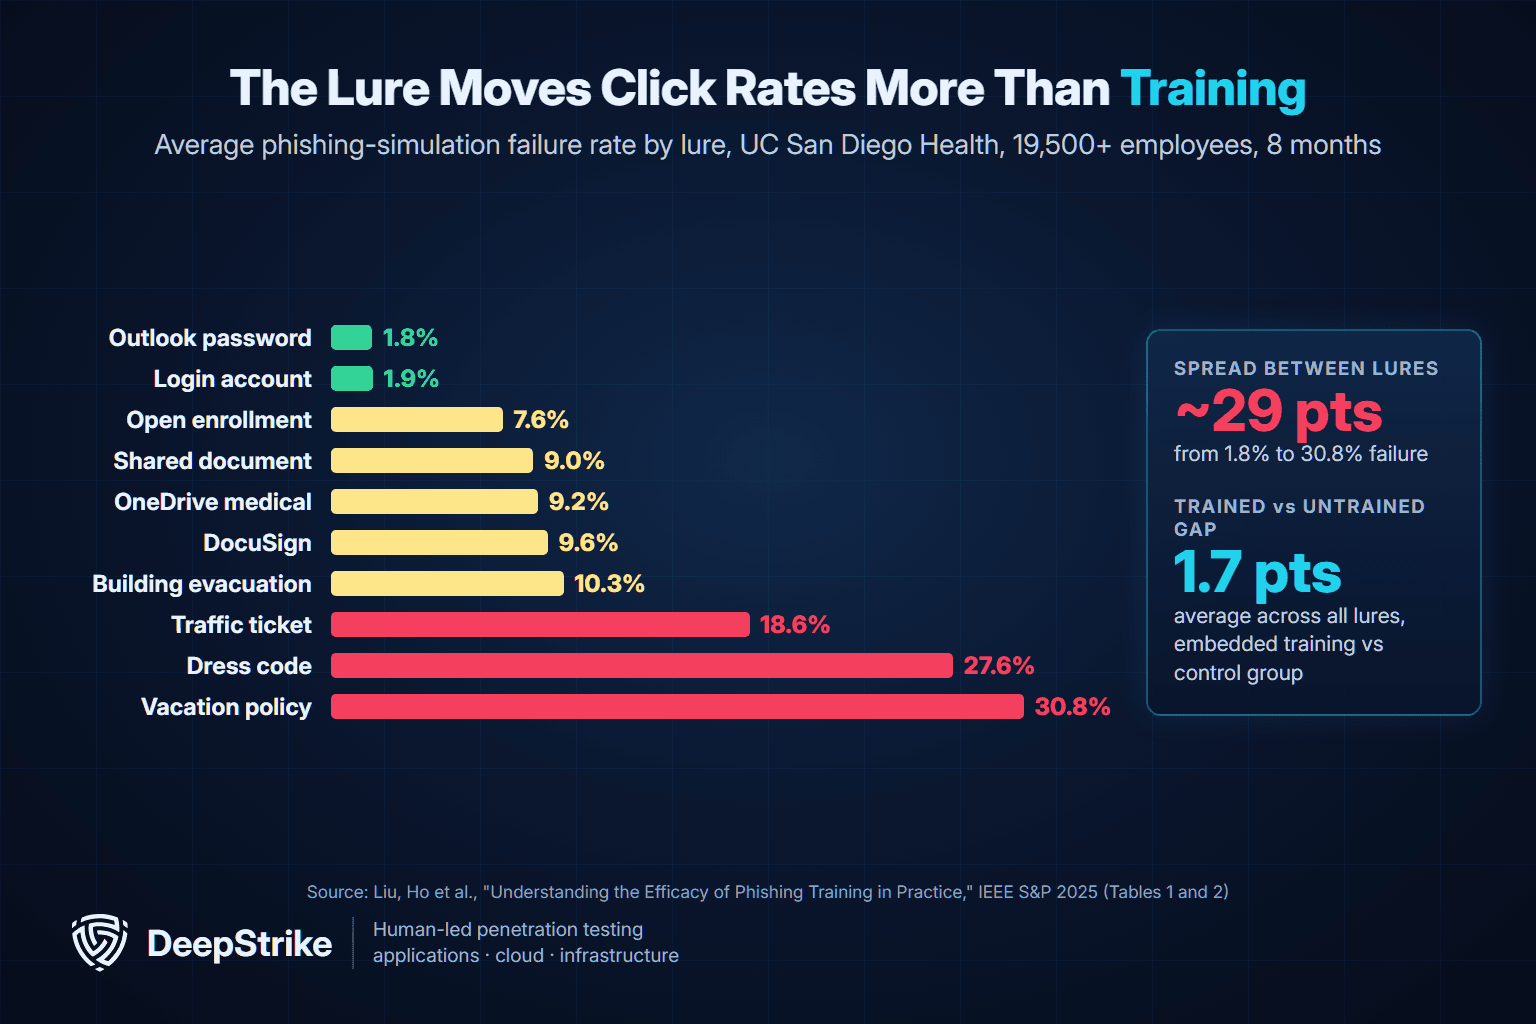
Verizon reviewed the paper in its 2025 DBIR and reported similar click-rate results in its own data, while finding that reporting kept improving with continuous training. Read together, the two sources agree more than the headlines suggest: training changes reporting more reliably than it changes clicking.
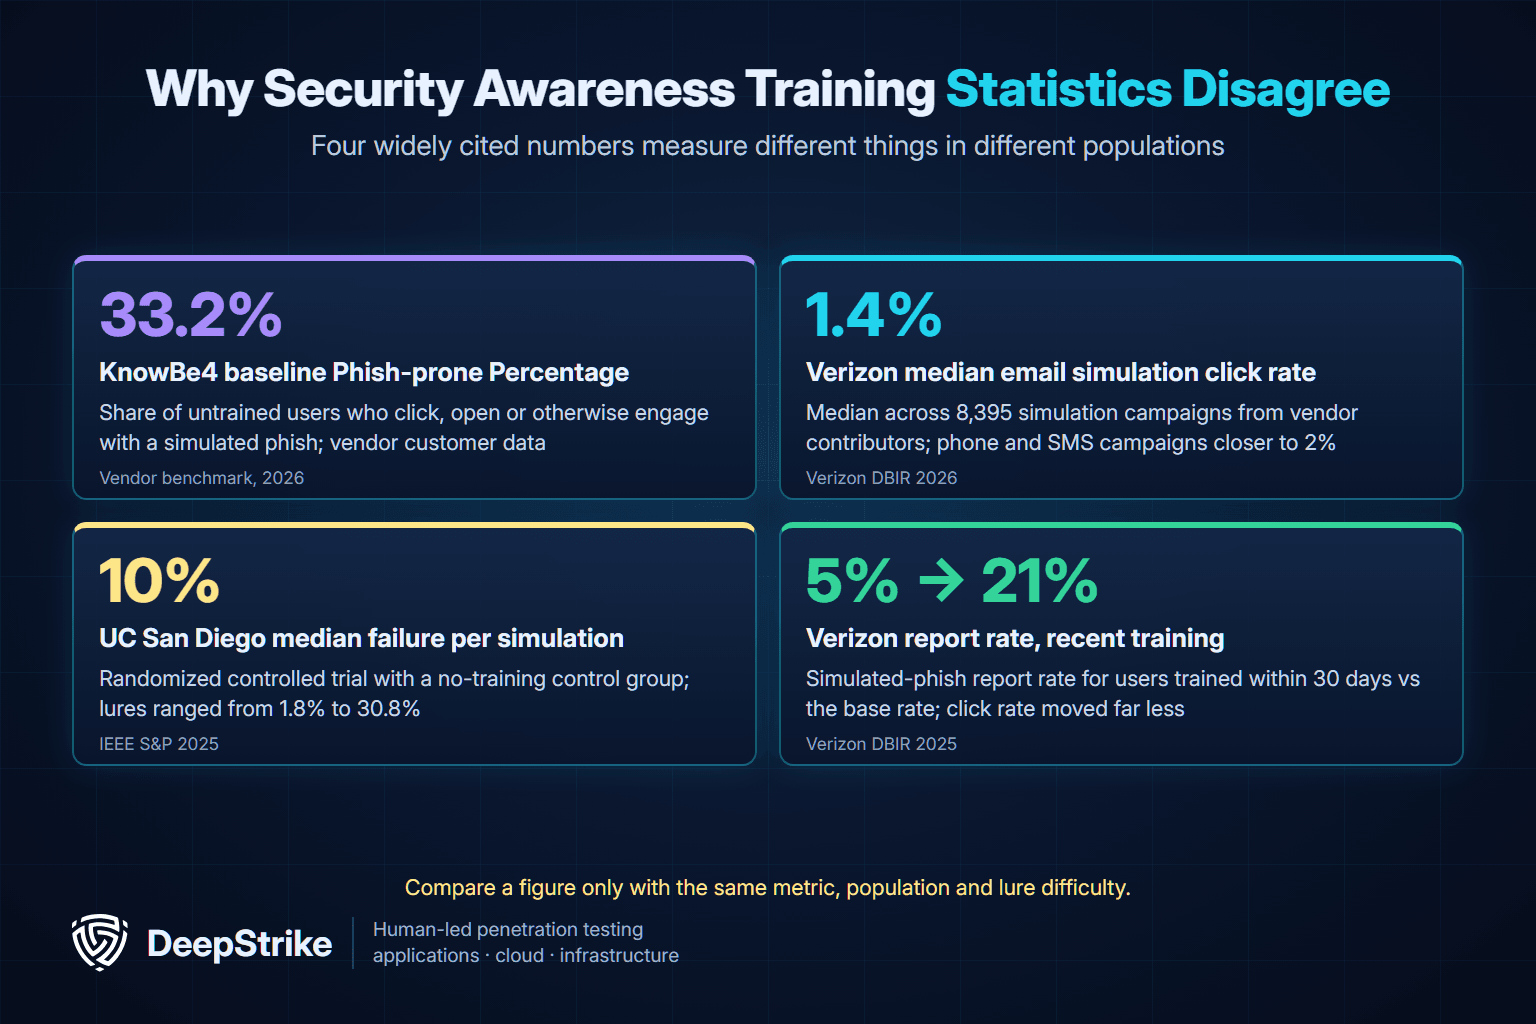
A 33.2% baseline from KnowBe4, a 1.4% median from Verizon and a 10% median failure rate per simulation at UC San Diego Health can all be accurate, because they measure different things in four ways:
NIST’s Phish Scale User Guide (Technical Note 2276, November 2023) addresses the difficulty problem directly. It notes that click and reporting rates give only a single point of insight, and it gives training teams a method to rate how hard each simulated email is to detect, based on its visible cues and how closely its premise fits the audience. Rating each lure before comparing campaigns stops an easier template from looking like progress.
The practical lesson is that sustained programs matter more than one-time annual training. Attack techniques change, employees change roles, new employees join, AI introduces new workflows, and collaboration tools create additional communication paths.
Mimecast reports that only 28% of organizations combine regular awareness training with continuous monitoring. Training works best when technical controls reinforce it.
NIST SP 800-50 Rev. 1, Building a Cybersecurity and Privacy Learning Program, published in September 2024, frames training as a lifecycle program aimed at changing behavior as part of risk management. It includes suggested metrics and evaluation methods so the program can be improved over time, which is a higher bar than annual completion rates.
CISA treats training as one layer, not the whole defense. Its October 2023 phishing guidance, written with the NSA, FBI and MS-ISAC, is aimed at network defenders and software manufacturers and includes a section for small and medium-sized businesses. CISA separately recommends phishing-resistant MFA because some push, SMS and one-time-code methods can still be phished.
Training data is most useful when it drives decisions. Based on the evidence above, DeepStrike recommends that security teams:
Training completion is not the same as risk reduction. A useful human-risk program tracks whether users become less likely to perform risky actions, more likely to report suspicious activity, and less able to turn one mistake into a major breach.
| Human-risk metric | What it shows |
|---|---|
| Phish-prone Percentage | Susceptibility to simulated phishing |
| Phishing reporting rate | Whether users actively identify suspicious messages |
| Time to report | How quickly security gains visibility |
| Repeat-failure rate | Whether risky behavior persists among the same users |
| MFA / phishing-resistant MFA coverage | Strength of authentication coverage |
| Privileged-account exposure | Potential blast radius of a compromised identity |
| Offboarding completion time | How quickly former-employee access disappears |
| Sensitive-data sharing events | Data-handling risk |
| Shadow IT and shadow AI usage | Activity outside approved systems |
| Misconfiguration recurrence | Whether teams repeatedly reintroduce the same technical weakness |
| Measurement rule If training completion rises but phishing susceptibility, reporting time, credential exposure, misconfiguration recurrence, or risky data sharing do not improve, the program has not demonstrated meaningful risk reduction. |
|---|
Organizations cannot eliminate human mistakes. They can make mistakes less likely and dramatically reduce the consequences when they occur. The strongest programs combine behavior-focused controls with architecture that assumes a user, administrator, developer, or executive will eventually make the wrong decision. Supporting those controls with clear internal communication and employee feedback can also help organizations reinforce security expectations, and employee engagement software can provide a structured way to keep teams informed and aligned.
CISA recommends phishing-resistant MFA wherever feasible. Pair it with least privilege, secure account recovery, strong offboarding, and monitoring of privileged activity.
Cloud storage should begin private. Sensitive repositories should require explicit access. High-risk administrative actions should require stronger verification. External sharing should be visible and controlled. Secure defaults reduce the number of perfect decisions required from users.
Email filtering, MFA, DLP, endpoint controls, browser protection, patching, logging, and access controls should absorb mistakes before they become business-impacting incidents. Human risk management is strongest when it is not a substitute for engineering.
The NIST Cybersecurity Framework 2.0 emphasizes governance, risk management, roles, policy, and continuous improvement. Human risk belongs inside that wider governance model rather than being treated as a standalone awareness problem.
Authorized security testing can validate whether phishing-resistant controls, account recovery, privilege boundaries, reporting channels, and technical defenses work under realistic conditions. DeepStrike’s penetration testing services assess the technical controls around those human decisions rather than reducing the finding to “someone clicked.”
| Statistic | Figure | Year | Source |
|---|---|---|---|
| Human element in breaches | 62% | 2026 | Verizon |
| Vulnerability exploitation as initial access | 31% | 2026 | Verizon |
| Mobile social-engineering success increase | 40% higher | 2026 | Verizon |
| Frequent employee AI-tool use | 45% | 2026 | Verizon |
| CISOs naming human risk top vulnerability | 79% | 2026 | Proofpoint |
| CISOs (orgs with material data loss) citing departing employees | 93% | 2026 | Proofpoint |
| CISOs viewing GenAI as a security risk | 78% | 2026 | Proofpoint |
| CISOs expecting employees to expose data via AI | 76% | 2026 | Proofpoint |
| Malicious insiders cited in material data loss | 46% | 2026 | Proofpoint |
| Careless insiders cited in material data loss | 38% | 2026 | Proofpoint |
| Compromised insiders cited in material data loss | 38% | 2026 | Proofpoint |
| Baseline phishing susceptibility | 33.2% | 2026 | KnowBe4 |
| After 90 days | 20.1% | 2026 | KnowBe4 |
| After 12 months | 4.2% | 2026 | KnowBe4 |
| Healthcare/Pharma baseline PPP | 42.7% | 2026 | KnowBe4 |
| Insurance baseline PPP | 38.1% | 2026 | KnowBe4 |
| Retail/Wholesale baseline PPP | 36.0% | 2026 | KnowBe4 |
| Average global breach cost | $4.99M | 2026 | IBM |
| Malicious breaches that were AI-enabled (IBM study sample) | About 1 in 4 (up 56% YoY) | 2026 | IBM |
| Security AI/automation savings | $1.93M | 2026 | IBM |
| Expected email security challenges | 96% | 2026 | Mimecast |
| Concern about GenAI data leakage | 80% | 2026 | Mimecast |
| Training + continuous monitoring | 28% | 2026 | Mimecast |
| IC3 complaints | 1,008,597 | 2025 | FBI |
| Reported internet crime losses (IC3 complaints) | Nearly $21B | 2025 | FBI |
There is no reliable universal percentage for all cyberattacks. Verizon’s 2026 DBIR found the non-intentional human element in 62% of breaches. That is not equivalent to saying humans independently caused 62% of all cyberattacks. For how often breaches happen and their other causes, see our data breach statistics.
The 95% figure is widely repeated from older research and secondary citations, but it should not be presented as a current universal breach rate. Modern datasets use more specific definitions and denominators.
Human error is an unintended action or omission that weakens security or contributes to an incident, such as misconfiguring access, mishandling data, delaying updates, or approving a fraudulent request.
Examples include password reuse, accidental disclosure, cloud misconfiguration, excessive permissions, delayed patching, unsafe MFA approvals, unauthorized AI usage, and poor offboarding.
Not automatically. Phishing is an intentional social-engineering attack created by an adversary. A victim may take an unsafe action, but the attack also reflects the adversary’s manipulation and the controls that did or did not stop it.
Training helps, but less than vendor benchmarks suggest. KnowBe4 reports the Phish-prone Percentage falling from 33.2% to 4.2% after 12 months of continuous training, while a 2025 UC San Diego randomized trial with more than 19,500 employees found only a 1.7-point average difference between trained and untrained users. Verizon found recent training raised report rates from about 5% to 21%. Pair training with phishing-resistant MFA and fast reporting workflows.
The most cited figures are Verizon’s 1.4% median click rate for email phishing simulations and about 2% for phone and SMS simulations (DBIR 2026), Verizon’s finding that recently trained users report phishing at about 21% versus a 5% base rate (DBIR 2025), KnowBe4’s 33.2% baseline and 4.2% 12-month Phish-prone Percentage, and the UC San Diego study’s 1.7-point average effect of embedded training.
There is no universal target, because click rates depend on lure difficulty and on how the metric is defined. Verizon’s 2026 median for email simulations is 1.4%, but a single workforce can range from under 2% to over 30% depending on the lure. Rate lure difficulty with the NIST Phish Scale and track report rate and time to report alongside clicks.
Use secure defaults, least privilege, phishing-resistant MFA, DLP, strong offboarding, continuous training, monitoring, patching, and realistic security testing so one mistake does not automatically become a breach.
Track outcomes such as phishing susceptibility, reporting rate, time to report, repeat failures, MFA coverage, privileged exposure, offboarding time, shadow AI usage, and misconfiguration recurrence rather than training completion alone.
This report prioritizes primary research and preserves the terminology used by each source. Verizon DBIR figures refer to breaches and Verizon’s own human-element methodology. Proofpoint figures are CISO survey responses. KnowBe4 figures are simulated phishing benchmarks. IBM figures describe breach economics. FBI figures are complaint and reported-loss data. Mimecast figures are survey findings. The UC San Diego figures come from a peer-reviewed randomized controlled trial at one healthcare organization, and the NIST and CISA documents are guidance rather than statistics.
Statistics from different datasets are not combined as though they measure the same population. The article also separates accidental errors from social engineering, credential compromise, and malicious insider behavior because each requires different controls.
Human error remains an important part of cybersecurity risk in 2026, but blaming employees is not a security strategy. Verizon shows that people remain involved in a large share of breaches while technical exploitation is simultaneously becoming more important. Proofpoint shows growing CISO concern around human behavior and AI use. KnowBe4 demonstrates measurable reductions in phishing susceptibility through sustained training. IBM shows how expensive modern breaches have become when controls fail.
The practical goal is not to create employees who never make mistakes. It is to build an environment where mistakes are harder to make, easier to detect, and less damaging when they happen. Human behavior is one layer of the attack surface and should be managed with the same rigor applied to applications, networks, APIs, cloud systems, identities, and AI.

Stay secure with DeepStrike penetration testing services. Reach out for a quote or customized technical proposal today
Contact Us
