July 7, 2026
Updated: September 14, 2026
A 2026 planning guide to IBM/Ponemon breach-cost benchmarks, ransomware and AI cost drivers, regional and industry differences, and practical risk-reduction controls.

Mohammed Khalil
| Category | Statistic | Source (Year) | Scope | Why It Matters |
|---|---|---|---|---|
| Global average breach cost (2025) | $4.44 million per incident (9% drop) | IBM Cost of a Data Breach (2025) | Global | Baseline for budgeting; first decline in five years, driven by faster response. |
| U.S. average breach cost (2025) | $10.22 million per incident (↑9%) | IBM Cost of a Data Breach (2025) | United States | Highest globally; reflects heavy fines, higher labor, and complex environment. |
| Healthcare breach cost (2025) | $7.42 million per incident | IBM Cost of a Data Breach (2025) | Healthcare sector | Consistently highest; due to PHI, regulatory fines, and critical-service disruption. |
| Financial services breach cost (2025) | $5.56 million per incident | IBM Cost of a Data Breach (2025) | Financial services | High value of financial data and fraud risk; stringent compliance. |
| Malicious insider breach cost (2025) | $4.92 million (highest by attack type) | IBM Cost of a Data Breach (2025) | All industries | Insider attacks (fraud, sabotage) are costly to detect and remediate. |
| Phishing-driven breach cost (2025) | $4.80 million (avg. by initial vector) | IBM Cost of a Data Breach (2025) | All industries | Phishing remains common; costs include credential theft and extortion ransom demands. |
| Ransomware-related breach cost | $5.13 million (incidents involving ransomware) | IBM Cost of a Data Breach (2025) | All industries | Significantly above average; includes ransom + recovery + downtime. |
| Mean time to identify & contain | 241 days (2025 global average) | IBM Cost of a Data Breach (2025) | Global | Longer dwell time increases cost. Notably, >200-day breaches cost ~$5.49M vs $3.61M if <200 days. |
| Security AI/Automation impact | –$1.9 million saved (for orgs using AI extensively) | IBM Cost of a Data Breach (2025) | All industries | Use of AI/automation in security significantly lowers costs and speeds breach response. |
| Shadow AI impact | +$670,000 per incident (avg. added cost) | IBM (Ponemon) findings (2025) | All industries | Unauthorized AI use increases risk and cost; 97% of AI-related breaches lacked controls. |
| Average ransom payment (2025) | ~$1.0 million | Sophos State of Ransomware (2025) | Global | When paid, ransom demands average ~$1M, adding to breach expense. Recovery and downtime often cost more. |
| Average ransomware recovery cost | ~$1.5 million (excluding ransom) | Sophos State of Ransomware (2025) | Global | Costs to recover encrypted data (restoration, alternate systems) average ~$1.5M, plus any ransom paid. |
| Average cost per record (2023) | $165 per record | IBM Cost of a Data Breach (2023) | Breaches 2,200–113,000 records | Per-record cost has risen slowly; useful for breach-size estimates but hides large variation by breach scale. |
Understanding breach cost benchmarks helps boards, C-suite, and risk teams quantify cyber risk in financial terms. It informs budgeting (how much to spend on security), cyber insurance decisions, and incident response planning. For example, knowing that U.S. breaches average ~$10M or that a healthcare breach can top $7–9M highlights which business units need extra focus. Cost data also drives decision-making around controls: if faster detection saves millions, leaders may invest more in monitoring and response.
However, averages can mislead if used out of context. Ponemon/IBM metrics are survey-based benchmarks (global, multi-industry) and not precise predictions for any single firm. Industry mix (e.g. highly regulated sectors) and breach size can skew the average. Likewise, “cost per record” metrics vary by breach size and data type and should not be extrapolated linearly. Boards and CFOs should view breach cost stats as guidelines: they highlight risk factors (like detection time, regulatory fines, reputational loss) and allow comparisons, but each organization’s true exposure depends on its own data value, customer contracts, and incident maturity. In short, cost studies and broader cybersecurity statistics inform risk assessments and control priorities, but should not replace detailed risk modeling.
Cost of a breach is typically defined as all direct and indirect expenses stemming from an unauthorized data exposure. Key components (as defined by IBM/Ponemon methodology) include:
Note that not all reports include every category or label them the same way. Ponemon’s IBM reports combine some categories (for example, they often group notification/credit monitoring under “post-breach response”). Always check what a given source includes. For instance, IBM’s reports generally exclude direct fines (counted separately as regulatory cost) and treat ransom as a conditional factor.
To ensure accuracy and relevance, we applied strict criteria to select cost figures (see table below). Key filters:
| Criterion | Requirement | Why It Matters |
|---|---|---|
| Source credibility | Use authoritative, original sources (IBM/Ponemon, NIST, etc.) | Ensures data are reliable and research-based, not hearsay or marketing. |
| Publication year | Prefer 2023–2025; flag older data as historical | Cyber risk evolves; outdated figures may mislead current planning. |
| Cost-specific | Must explicitly measure breach cost or financial impact | Avoids conflating breach cost with unrelated cyber losses or crime stats. |
| Definition clarity | Clear scope (per-incident vs per-record, mean vs median) | Prevents misinterpretation of what the number actually measures. |
| Average vs median | Noted whether stat is mean or median | Averages skew by large breaches; median may differ substantially. |
| Per-record vs per-incident | Identify if stat is cost per record or total breach cost | Per-record is normalized metric; misusing it can under/overstate impact. |
| Geographic scope | Region or country clearly specified | Laws and costs vary by jurisdiction; global avg isn’t the same everywhere. |
| Industry/sector | Industry clearly identified | Some industries (healthcare, finance) have consistently higher costs. |
| Breach size/sample | Mention size range or number of breaches if given | Cost averages depend on breach magnitude; big breaches dominate means. |
| Attack vector attribution | Attack vector explicitly named (phishing, insider, etc.) | Cost drivers differ by vector; blending them hides specific risks. |
| Ransomware/extortion caveat | Distinguish ransom paid vs total recovery cost | Ransom is part of cost, but not always largest component; clarify scope. |
| Regulatory fine caveat | Separate regulatory penalties from breach costs | Fines can be huge (e.g. GDPR); not part of Ponemon’s “breach cost” bucket. |
| Insurance claim caveat | Label data from claims or insurance surveys accordingly | Industry claim data reflect insured losses, not total market costs. |
| Survey methodology caveat | Note when data are survey-based (IBM/Ponemon) vs observational | Survey responses may over/understate costs; claim data has different biases. |
| Reproducibility | Statistic traceable to a published source | Ensures every figure can be verified by readers or auditors. |
| Risk relevance | Data should inform security and financial risk decision-making | Exclude generic cybercrime stats without direct breach context. |
IBM’s annual Cost of a Data Breach Report (Ponemon Institute) is the most cited source for breach cost stats. It is a global survey (600 organizations in 2025) that calculates “average total cost” of a breach incident, including both direct response costs and business losses. Key points for readers:
In summary, IBM/Ponemon data is useful for industry benchmarks and trend analysis, but every organization should interpret the figures in its own context (specific breach scenarios, internal IR maturity, data criticality). Use IBM’s data to understand where your costs might come from and which factors (like compliance or AI adoption) significantly change the average.
Many online summaries fall into similar traps. They often repeat the headline IBM global average without noting it is survey-based and includes global expenses (labor, legal, notification, etc.), leading readers to assume this is the cost their company will see. Good analysis avoids presenting one number as universal.
Common gaps include:
Our goal is to connect the numbers to decisions: why a CFO might fund more IR drills, or a CISO might push for MFA after seeing credential theft losses. Every statistic used here is accompanied by its source and context, to avoid these pitfalls.
| Year | Average Cost | Source (Year) | Scope | Notes |
|---|---|---|---|---|
| 2022 | $4.35M | IBM/Ponemon (2023) | Global | Baseline for 2023 comparison |
| 2023 | $4.45M | IBM/Ponemon (2023) | Global | 2.3% increase vs 2022 |
| 2024 | $4.88M | IBM/Ponemon (2024) | Global | 10% increase vs 2023 (highest spike) |
| 2025 | $4.44M | IBM/Ponemon (2025) | Global | 9% decrease vs 2024 |
| 2026 | Pending official IBM/Ponemon report | Refresh when published | Not yet available | Use 2025 as the latest verified benchmark until official 2026 figures are released. |
Trend interpretation: After rising from ~$4.35M in 2022 to $4.88M in 2024, Ponemon/IBM reports show a drop in 2025 to $4.44M. IBM attributes this partly to faster breach lifecycles in the dataset (average containment improving). It remains to be seen if the 2026 data (when released) shows a rebound. These global averages are weighted by incident count, so even a few very costly breaches (e.g. ransomware or major healthcare incidents) can influence the trend.
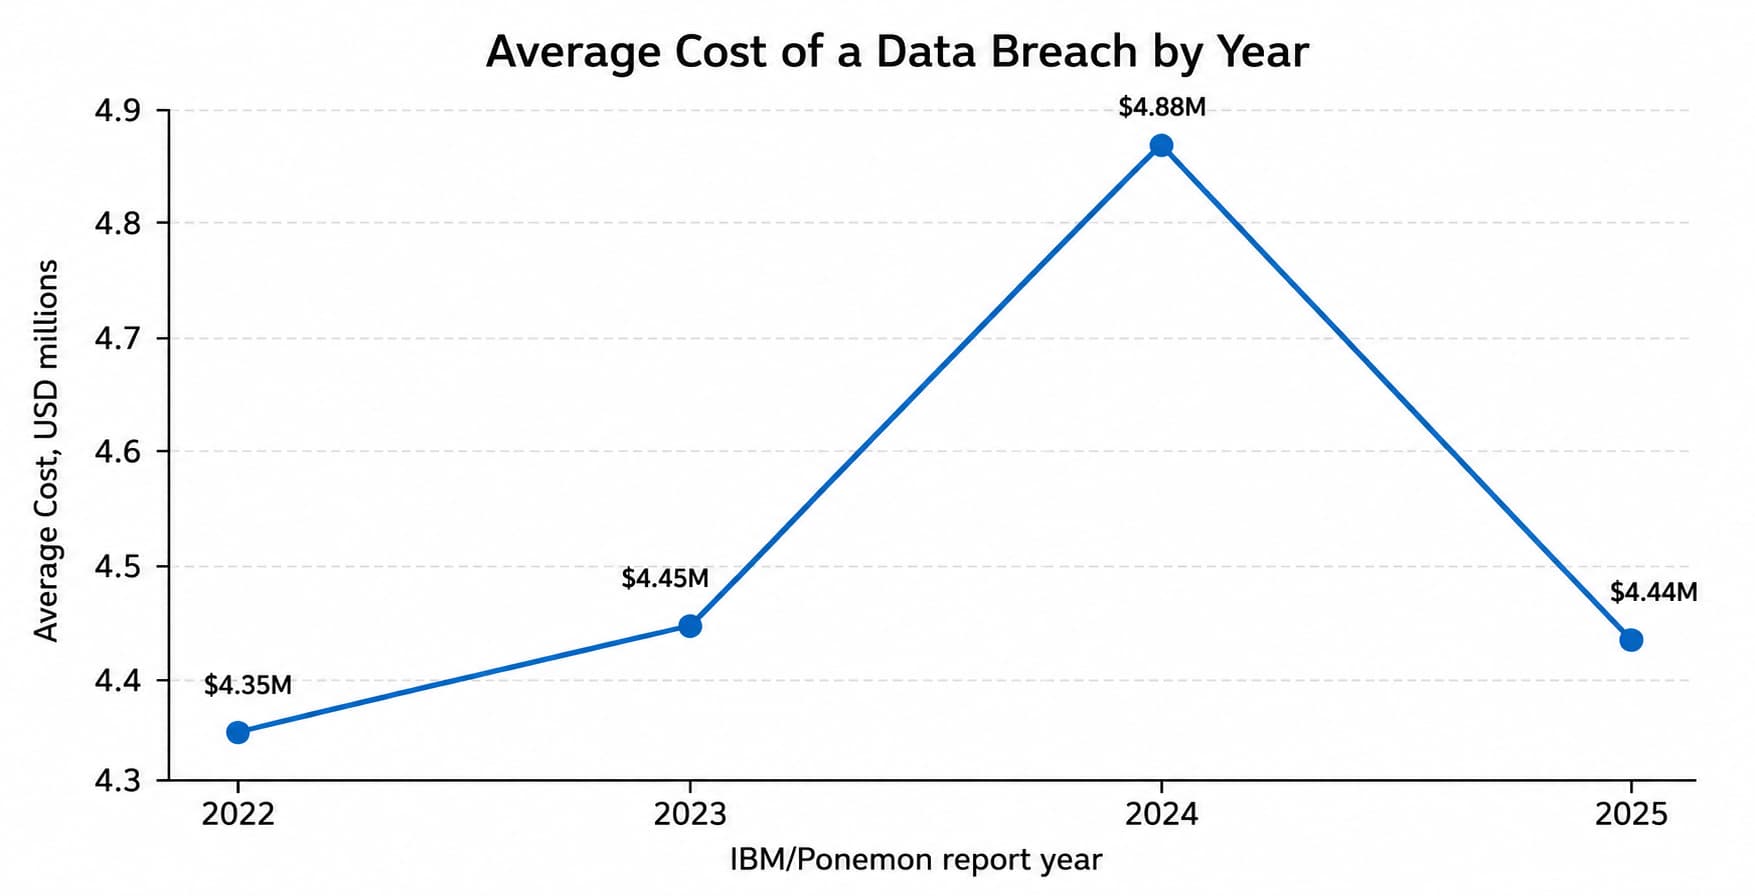
Figure 1: IBM/Ponemon global average breach-cost trend. 2026 should remain pending until official data is verified.
Cost per record is useful for directional modeling, but it should not be treated as a simple multiplication formula. IBM’s 2023 benchmark reported an average of $165 per compromised record, but that figure came from a defined breach-size range and blends fixed incident costs with variable record-related costs.
The main risk is misuse: 100,000 records multiplied by $165 does not automatically equal the true cost of a real incident. Forensics, legal review, executive response, notification setup, public relations, and recovery work create fixed costs even in smaller breaches. At the same time, very large breaches may have lower per-record economics because some response costs scale sublinearly.
Use cost-per-record data only as a secondary estimate. For board planning, start with total incident benchmarks, then adjust for record type, jurisdiction, industry, detection time, operational downtime, and whether ransomware or extortion is involved.
| Use Case | How to Interpret Cost Per Record | Planning Caution |
|---|---|---|
| Small breach estimate | Helps approximate the added impact of exposed PII, PHI, or financial records. | Fixed response costs can dominate; the total may be higher than a simple per-record calculation. |
| Large breach estimate | Can show why record volume matters to notification, credit monitoring, legal, and support costs. | Do not assume linear scaling; large incidents often have non-linear costs and special legal/PR exposure. |
| Board risk modeling | Useful as one variable in a breach scenario model. | Pair it with total breach cost, industry average, detection lifecycle, and downtime assumptions. |
| Quick-answer use | Answers the common “average cost per record” question directly. | Keep the caveat visible so readers do not misuse the statistic. |
Publishing caveat: Company-size rows in this section are planning guidance, not official IBM/Ponemon size-band benchmarks. Use them to model exposure, not to claim a verified IBM SMB or enterprise average.
Company size changes breach economics, but it is not as clean a benchmark as industry, region, or attack vector. IBM/Ponemon does not provide a single universal “SMB vs enterprise” cost table that applies to every organization. A smaller company may have a lower absolute loss but a higher survival risk; a large enterprise may absorb the loss but face higher legal, regulatory, operational, and customer-trust exposure.
| Company Size | Typical Cost Pattern | Why It Changes the Breach Cost | Priority Controls |
|---|---|---|---|
| Startup / SMB | Lower absolute cost than large enterprises, but higher business-continuity risk. | Limited legal budget, smaller security teams, fewer response retainers, and greater reliance on cloud/SaaS providers. | MFA, patching, managed detection, secure backups, basic incident response plan, and periodic web/API testing. |
| Mid-market SaaS or ecommerce | Often close to or above the global average when customer data, payment data, APIs, or cloud workloads are exposed. | Customer notification, contractual penalties, lost sales pipeline, and cloud investigation work can quickly escalate costs. | Cloud IAM hardening, API security testing, logging coverage, vendor risk reviews, and tested IR runbooks. |
| Large enterprise / multinational | Can exceed country or industry averages when a breach crosses regions, business units, or regulated datasets. | More systems, vendors, jurisdictions, legal teams, data stores, and public scrutiny increase coordination cost and downtime exposure. | Centralized detection, segmentation, executive crisis drills, legal/regulatory playbooks, red team exercises, and third-party risk monitoring. |
Practical interpretation: use company size as an exposure multiplier, not as a standalone statistic. The most useful model combines size with data sensitivity, breach lifecycle, region, industry, ransomware involvement, and response maturity.
| Industry | Average Cost (USD) | Source (Year) | Scope | Security Implication |
|---|---|---|---|---|
| Healthcare | $7.42 million | IBM/Ponemon (2025) | Hospitals/clinics worldwide | Handles sensitive health records; breach can endanger patient safety and incur heavy HIPAA fines. Emphasize data encryption, network segmentation, and continuity plans. |
| Financial Services | $5.56 million | IBM/Ponemon (2025) | Banking/insurance companies | High value of financial/identity data and regulatory scrutiny. Prioritize transaction monitoring, identity fraud controls, and rapid fraud response. |
| Industrial/Manufacturing | ~$4.7–5.0 million* | IBM/Ponemon (2025) | Global industry sector | Many critical operations; downtime impacts production. Focus on OT security, network isolation, and resilience of control systems. |
| Technology/Software | ~$4.5–5.5 million* | IBM/Ponemon (2025) | Software/hardware firms | Intellectual property and customer data at risk. Emphasize secure SDLC (DevSecOps), vendor code reviews, and API security. |
| Retail & Consumer | ~$4.0–4.5 million* | IBM/Ponemon (2025) | Retail chains, e-commerce | Credit card data and customer PII. Important to tokenize payment data, secure e-commerce platforms, and enforce strong user authentication. |
| Small/Medium Business | ~$1–3 million† | Planning guidance (not an official IBM/Ponemon size band) | SMBs (varies greatly) | Lower absolute costs but often have fewer resources. Even a breach of a few million can be devastating. Promote basic controls (MFA, patching) and cyber insurance. |
| Large Enterprise | >$10 million† | IBM/Ponemon Global (2025) | Multinational corporations | Complex IT, multi-jurisdiction legal exposure. Require sophisticated IR capability, executive crisis planning, and regular red teaming. |
Notes: The industry figures labeled with * (“~”) are approximations. IBM/Ponemon reports publish select industries; others come from related analyses and sector reports. Healthcare and financial services consistently report the highest averages. Differences arise from data sensitivity and regulation (e.g. HIPAA fines, GDPR). SMB and enterprise rows are planning guidance, not official IBM/Ponemon company-size averages. IBM/Ponemon is strongest for per-incident, regional, industry, and vector benchmarks; company-size exposure should be modeled using record sensitivity, operational dependency, legal exposure, and incident response maturity.
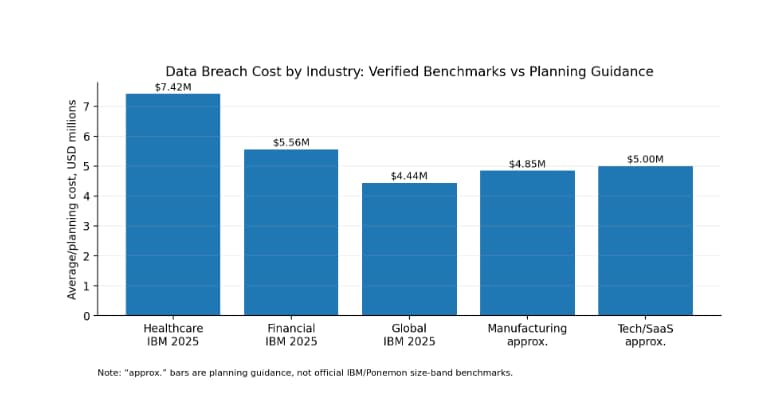
Figure 2: Industry comparison with verified IBM/Ponemon benchmarks and clearly labeled planning estimates.
| Region/Country | Average Cost (USD) | Source (Year) | Scope | Notes |
|---|---|---|---|---|
| United States | $10.22 million | IBM/Ponemon (2025) | US businesses | Highest in the world; driven by high labor/legal costs and fines. |
| Middle East | $8.75 million | IBM/Ponemon (2024) | ME (Saudi/UAE) | Second-highest (2024 data); regional regulations and incident types are factors. |
| Germany | $5.31 million | IBM/Ponemon (2024) | German companies | Costs rose in 2024; strong privacy laws (GDPR) and breach disclosure practices increase expenses. |
| United Kingdom | $4.53 million | IBM/Ponemon (2024) | UK businesses | Near global average; substantial fines under GDPR/UK law exist. |
| Global (weighted) | $4.44 million | IBM/Ponemon (2025) | Worldwide | This is an average across all surveyed countries. |
Regional averages reflect differences in regulatory environment, labor costs, and breach severity. The U.S. consistently tops the list (e.g. $9.36M in 2024, $10.22M in 2025) due to high litigation, expensive forensic investigations, and larger breach sizes. Europe and other regions see lower averages (e.g. Germany ~$5.3M), partly due to smaller breach impacts or differences in cost categories. Always use the specific region’s data when planning budgets; global averages can mask much lower or higher costs per region.
| Attack Vector | Cost Signal | Source (Year) | Scope | Security Takeaway |
|---|---|---|---|---|
| Phishing (social engineering) | ~$4.8 million per breach | IBM/Ponemon (2025) | All industries | Leading initial attack (16% of breaches). Strengthen phishing-resistant MFA and staff training. |
| Malicious Insider | ~$4.92 million per breach | IBM/Ponemon (2025) | All industries | Most expensive vector. Indicates need for strict access controls, user monitoring, and insider threat programs. |
| Stolen/Credential Attacks | (IBM 2024: longest detection time, ~$5M range) | IBM/Ponemon (2024) | All industries | Credential compromise often leads to slow, costly breaches (longest dwell). MFA and credential hygiene are critical. |
| Ransomware / Extortion | ~$5.13 million total (inc. downtime) | IBM/Ponemon (2025) | All industries | Breaches involving ransomware tend to exceed averages. Emphasize backups, segmentation, and IR playbooks. |
| Third-Party/Supply Chain | (Significant but variable) | Verizon DBIR (2024) [Industry reports] | Multi-sector | Supply-chain attacks are costly due to multi-victim impact. Vet vendors and monitor their security. |
| Cloud Misconfiguration | (~$5–6 million per breach*) | Various (reported in 2024, 2025) | Cloud-centric breaches | Often high-impact; ensure proper cloud IAM and automated configuration checks. |
IBM’s reports don’t list every vector’s cost, but highlight that malicious insiders ($4.92M) and phishing ($4.8M) are among the costliest. Ransomware/Extortion is not an “initial vector” in IBM’s terms, but it inflates costs (IBM 2025 reports ~$5.13M when an attack is ransomware-related). Note these figures are averages; actual costs vary widely. For example, some cloud-related or supply-chain breaches have reached tens of millions, but Ponemon only includes up to ~113k records in their sample. Security takeaway: focus on common high-cost vectors – enforce phishing-resistant MFA, monitor privileged insiders, and apply the “assume breach” strategy for third-party/cloud exposures.
| Cost Driver | What It Includes | Why It Increases Cost | What Teams Should Measure |
|---|---|---|---|
| Detection & Response | Forensic investigation, IR team labor, security tools, assessments | Longer discovery (“dwell time”) allows attackers deeper access. High forensic/investigation costs if tools or expertise are inadequate. | Mean time to detect (MTTD) and contain (MTTC), incident response readiness (e.g., IR plan maturity), SOC coverage. |
| Notification & Communication | Regulatory breach filings, customer notifications, PR, call centers, credit monitoring | Regulatory requirements (GDPR/HIPAA) can be costly (legal notices, outreach). Call center surge and credit protection services add expense. | Number of affected individuals, time to regulatory reporting, communication plan readiness, cost per notification. |
| Legal & Regulatory | External legal counsel, compliance investigations, settlements, fines | More stringent laws (GDPR, HIPAA) mean higher fines/legal costs for sensitive data breaches. Complex litigation (class actions) drives up fees. | Engagements of external counsel, number of regulatory inquiries, total fines or settlements paid. |
| Systems Recovery & Remediation | IT engineering time, data restoration, patching/upgrades, new cybersecurity projects | Major breaches often require rebuilding systems or applying emergency fixes, which consumes resources. Post-breach security improvements may be needed. | Time to restore critical systems, percentage of backups tested, patch lag time, remediation project budgets. |
| Lost Business & Reputation | Operational downtime, lost sales, terminated contracts, customer churn | Downtime halts revenue; lost customers and deals can far exceed direct costs. Damage to brand can slow growth long-term. | Business continuity uptime metrics, customer churn rates after breach, pipeline and sales impact. |
| Ransomware/Extortion Specific | Ransom payment (if paid), negotiation costs, separated data recovery | Ransom demands can be substantial; the act of remediation (decrypting or rebuilding) adds cost. Paying ransom may induce regulatory liability (e.g. OFAC). | Ransom amount demanded/paid, whether insurer covers ransom, time and cost to remove malware and recover data. |
Why these drivers matter: Ponemon’s data consistently shows that longer breach lifecycles (detection/containment) and lost business are the largest fractions of total cost. For example, breaches identified externally cost much more than those caught by an internal team. Failing to measure and improve detection time leads directly to higher costs. Similarly, having to notify millions of customers or paying large fines multiplies the expense. Teams should track metrics like MTTD/MTTC (mean time to detect/contain), time to notify, and customer retention post-breach. Incident response teams should quantify how quickly they can activate IR plans (e.g. tabletop exercise intervals) and how often backups are tested, since these affect both containment cost and lost-business cost.
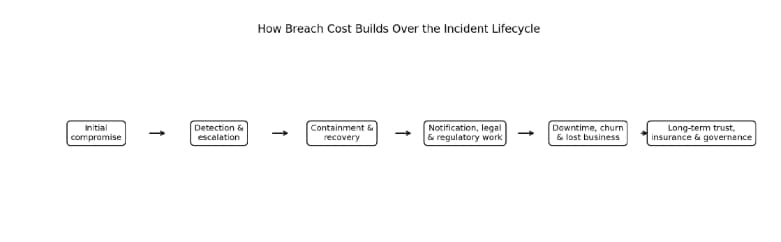
Figure 3: Breach cost usually builds across the full incident lifecycle, not from one line item.
Ponemon reports emphasize the breach lifecycle: how long it takes to detect and then contain an incident. In IBM’s 2025 study, the average combined time to identify and contain a breach fell to 241 days (a nine-year low). In 2024 it was 258 days, and in 2023 it was even higher (around 277 days). The data show a clear correlation: each additional day of dwell increases cost.
In summary, faster detection and containment is the single largest cost reducer. The statistics above back the adage “time is money” in cybersecurity. Measuring and continually improving MTTD/MTTC should be a strategic priority for all security operations.
Ransomware is now a major driver of breach costs. Ponemon/IBM reports and other surveys distinguish between the ransom payment and the total cost of a ransomware incident (which includes downtime and recovery).
Key takeaway: Ransomware attacks are typically more expensive than “ordinary” breaches because of the combination of ransom/extortion, the complexity of remediation, and extended downtime. Companies should prepare with offline backups, segmented networks, and tested recovery plans. Paying a ransom does not guarantee full recovery – often only part of data is restored, requiring parallel recovery efforts.
| Buyer Type / Sector | Main Cost Risk | What the Data Suggests | What To Prioritize |
|---|---|---|---|
| Healthcare | PHI exposure, HIPAA fines, clinical downtime | Highest avg breach cost (~$7–9M). Sensitive patient data and service outages elevate risk. | Encrypt PHI and medical data at rest; segment networks for critical systems; maintain offline backups to preserve patient care; devote strong oversight to cloud/systems storing PHI. |
| Financial Services | Customer PII, fraud exposure, regulatory scrutiny (SEC, GDPR) | Above-average costs (~$5–6M). Identity theft/fraud is a major concern, plus complex regulations (e.g. GLBA). | Harden authentication (MFA, phishing-resistant MFA methods) and transaction monitoring; encrypt customer data; coordinate IR with legal/regulatory teams (FDIC, SEC filings). |
| SaaS / Tech Companies | Intellectual property theft, API/credential attacks, brand damage | Likely near or above global avg due to many records/customer data. Tech reliance means breaches can cascade (support systems, dev environments). | Emphasize secure development (DevSecOps saves ~$0.2M); test APIs for injection/abuse; implement strict cloud IAM policies (least privilege, zero trust); invest in bug bounty/pen-testing to catch bugs before release. |
| Retail / E-commerce | Payment data theft, supply-chain attacks, consumer PII leakage | Often high-volume breaches of cardholder data. Public consumer trust at stake. | Use tokenization or P2PE for payment data; secure e-commerce and POS systems; monitor third-party vendors (e.g. service providers, ad networks); ensure breach notification readiness (millions of customers may need contact). |
| Small/Medium Business (SMB) | Limited security budgets, high % impact, fewer experts | Absolute costs tend to be lower ($2M–$3M*) but relative impact is huge. Many SMBs lack IR plans and may face business closure after a breach. | Focus on basic hygiene: network segmentation, regular patching, MFA on admin accounts, and insurance coverages. Develop a simple IR plan. Consider managed services for log monitoring or incident response support. |
| Large Enterprise | Global operations, cross-border regs, complex tech stacks | Likely to see some of the highest total costs (IBM cites US firms ~$10M). Long chains of vendor/software dependencies increase potential impact. | Formal incident response program (regular drills, assigned roles); executive crisis management readiness; centralized breach response coordination (legal, PR, IT, compliance); robust supply-chain risk management; scale-out recovery options (alternative data centers, global backup strategies). |
(*) SMB estimates are qualitative and drawn from various industry sources; formal breakdown by size is not provided by IBM/Ponemon. In all cases, teams should align these risk factors with controls – e.g. healthcare’s high breach cost implies prioritizing encryption and rapid patching of medical devices, while financial firms should stress fraud detection and legal coordination.
In summary, cloud and AI amplify both risk and response capability. The net effect on breach cost depends on an organization’s maturity: firms that treat AI and cloud security as core (with governance, visibility, automated IR) tend to reduce costs, whereas those that adopt new tech haphazardly see higher exposure.
Investing in certain controls has been statistically linked to lower breach costs. The table below highlights control areas from IBM and NIST frameworks and their cost relevance:
| Control Area | Cost Relevance | What To Validate |
|---|---|---|
| Incident Response Plan | Reduces detection and containment time; minimizes lost business. Well-prepared teams act faster. | Ensure an up-to-date IR plan exists; conduct regular tabletop exercises and simulate breach scenarios. Validate that roles, communication channels, and decision processes are documented. |
| Logging & Monitoring | Early breach detection is key. Broad visibility (network, endpoint, cloud logs) shortens dwell time. | Verify SIEM/XDR deployment; test log collection coverage (incl. endpoints, cloud services, legacy systems). Ensure logs are retained for months and actively monitored. |
| Security Automation (SIEM, XDR) | Automated threat detection/response tools reduce manual effort. IBM: organizations with extensive AI/security automation saw ~$1.9M lower costs. | Check if advanced analytics (AI/ML) are enabled to correlate alerts. Validate integration between tools (e.g. EDR alerts feeding SIEM). Evaluate response playbooks in automated tools. |
| DevSecOps & Patch Management | Faster patching and secure coding reduce vulnerability window. IBM: DevSecOps maturity saved ~$227K. | Review the software development lifecycle: ensure code is scanned, dependency vulnerabilities are managed, and production code is routinely tested. Confirm patch management program (frequency and scope of patches). |
| Multi-Factor Authentication (MFA) | Prevents many credential-based breaches. NIST SP 800-63 recommends strong MFA for all sensitive accounts. | Confirm MFA (preferably phishing-resistant, e.g. hardware keys or passkeys) is enabled for all high-privilege and customer-facing accounts. Test that backup account recovery processes are secure. |
| Data Protection (Encryption, DLP) | Encrypting data at rest/in transit limits the value of stolen data. IBM: encryption usage corresponded to ~$208K lower costs. | Validate that sensitive databases and filesystems are encrypted. Check Data Loss Prevention (DLP) or rights management policies on critical data. Review key management practices (rotation, hardware security modules). |
| Backup & Disaster Recovery | Allows rapid restoration of systems and data, especially after ransomware or destruction. Minimizes downtime losses. | Verify backups cover all critical data, are stored offline (or immutable), and are regularly tested for restore success. Confirm RTO/RPO requirements and recovery playbooks with IT teams. |
| Cloud Security Posture Management (CSPM) | Automatically finds cloud misconfigurations (a rising breach cause). Reduces risk of wide breach. | Ensure a CSPM or equivalent tool is in place for major cloud providers. Check configuration baselines (public S3 buckets, open DB ports, etc.) regularly. |
| Endpoint/Network Security (EDR, Firewalls) | Limits attacker movement and malware spread. Endpoint detection can flag breaches early. | Ensure EDR is deployed on workstations/servers with active response. Validate network segmentation/firewall rules prevent unnecessary lateral movement. |
| Third-Party Risk Management | Reduces likelihood of breach via vendor channels. E.g. PCI 4.0 requires vendor security validation. | Maintain a process for assessing vendor security posture. Require SOC 2 or ISO27001 reports from critical vendors. Monitor third-party access logs and restrict privileges. |
| Employee Training & Phishing Tests | Increases the chance that staff spot phishing or handle data properly. | Conduct regular (at least annual) security awareness training and phishing simulations. Validate that training covers new threats (e.g. deepfakes, social engineering). |
No single control guarantees cost reduction, but data-backed strategies do reduce exposure. For example, IBM 2025 correlates broad security automation with an 80-day shorter breach lifecycle. Enterprises should prioritize controls that both lower probability (e.g. strong MFA to prevent credential compromise) and improve resilience (e.g. tested IR and backups to limit downtime). Each control should be validated in practice: e.g. test MFA resilience, audit backup restoration, and update IR plans post-incident.
Use this worksheet before budget reviews, tabletop exercises, cyber insurance renewals, or board risk discussions. It turns benchmark statistics into an organization-specific scenario instead of treating the IBM average as a universal forecast.
| Planning Question | What To Estimate | Why It Matters |
|---|---|---|
| What data would create the largest loss if exposed? | PII, PHI, payment data, credentials, source code, business secrets, or regulated records. | Data sensitivity drives notification, legal, customer trust, and regulatory exposure. |
| Which systems create the highest downtime cost? | Revenue systems, production apps, patient/financial operations, customer portals, identity systems, and cloud control planes. | Lost business and recovery work often exceed the headline technical response cost. |
| How quickly would the team detect and contain the incident? | Current MTTD/MTTC, SOC coverage, log retention, alert quality, and escalation readiness. | IBM/Ponemon lifecycle data shows delayed detection materially increases cost. |
| Could ransomware or extortion be involved? | Backup maturity, segmentation, privileged access controls, and recovery time objectives. | Ransomware adds downtime, negotiation, forensics, restoration, and possible ransom payment exposure. |
| Who must be involved in the first 24 hours? | Security, IT, legal, PR, finance, executive leadership, insurer, outside counsel, and regulators where applicable. | Slow coordination increases legal risk, public messaging risk, and business interruption. |
| Which controls would reduce the most cost first? | MFA, encryption, logging, IR exercises, backups, cloud IAM, vulnerability management, and penetration testing. | Budget should follow the controls most likely to reduce detection time, blast radius, and recovery cost. |
This worksheet gives executives a practical way to apply the statistics instead of leaving them with a list of numbers.
Use this checklist to compare your organization against cost-related risk factors:
| Security Area | What the Cost Data Suggests | What Teams Should Check |
|---|---|---|
| Critical Data Inventory | Knowing your crown-jewel data helps focus protection. | Ensure all sensitive data stores (PII, PHI, IP) are identified and classified. |
| Data Classification & Access | Data sprawl increases containment time and impact. | Verify that sensitive data has strict access controls and is encrypted. Review role-based permissions. |
| Incident Response Readiness | Faster response cuts costs (Ponemon shows huge cost savings). | Check IR plan currency; conduct tabletop exercises and live drills annually. |
| Detection Coverage | Many breaches detected >30 days after intrusion. | Audit log coverage (SIEM, XDR, cloud logs). Test that alerts trigger IR workflows promptly. |
| Network Segmentation | Limits blast radius (Ponemon shows cross-domain breaches cost more). | Validate segment boundaries between critical networks (e.g. dev/ops, DMZ/internal, cloud/onsite). Perform internal pen tests to map network trust zones. |
| Identity & Access Mgmt (IAM) | Compromised credentials were top breach cause. | Review multi-factor auth rollout; audit admin account usage; test privileged access management. |
| Application Security | Web/API flaws can lead to large breaches. | Ensure regular penetration testing (web, mobile, API). Check OWASP Top 10 controls are in place. |
| Cloud Security | Misconfigurations are a major breach factor. | Use cloud security posture management; audit public bucket access, IAM policies, and network ACLs. |
| Vulnerability Management | Unpatched systems are easy entry points. | Confirm patching cadence (especially for critical CVEs) and track remediation metrics. |
| Logging & Monitoring | Visibility is essential to detect breaches early. | Check that all endpoints, servers, and cloud apps send logs to a central system. Verify retention. |
| Backup & Recovery | Offline backups limit ransomware impact. | Verify backups exist for all business-critical data, stored offline/immutable, and test restores. |
| Third-Party Risk Management | Vendor breaches can implicate you. | Inventory all third-party connections. Require security attestations (e.g. SOC reports). Monitor third-party security alerts. |
| Cyber Insurance | Can cover part of breach cost, but policy terms vary. | Review cyber policy coverage limits, exclusions (e.g. social engineering, supply chain). Practice meeting insurer requirements (e.g. IR planning). |
| Legal & Compliance Planning | Regulatory fines add to cost. | Ensure breach notification procedures comply with laws (GDPR, HIPAA, etc.). Pre-identify legal counsel and notification templates. |
| Executive Engagement | Board must understand breach impact beyond IT. | Use cost benchmarks in board reports. Check if C-level and board have been briefed on breach scenarios and their financial impact. |
| Penetration Testing | Finds gaps before attackers do (reducing cost exposure). | Ensure regular external pen tests covering network, web, mobile, and API. Track remediation of findings over time. |
This checklist translates cost factors into actionable steps. For instance, Ponemon shows encrypted breaches cost ~$200K less, so confirm encryption of databases. If dashboards show long detection times, increase logging coverage. Use internal audits to verify that “lessons learned” from past breaches are incorporated (e.g. after a phishing test incident, implement email filtering improvements).
In summary, treat every breach cost figure with a grain of context. Scrutinize definitions and sources, and always map numbers back to concrete risk and control decisions.
1. What is the average cost of a data breach?
The “average” varies by source and scope. IBM’s latest (2025) global average is $4.44 million per breach, but with wide variation. U.S. breaches average ~$10.2M. Smaller breaches (e.g. affecting few thousand records) will cost much less; large incidents (millions of records or involving critical systems) can cost 10x the average. Industry and region also matter: healthcare breaches averaged ~$7.4M, whereas many consumer-services breaches are closer to $3–4M. In practice, calculate an estimate by combining likely breach size, industry, and response maturity (faster detection and mature IR can lower costs significantly).
2. What is the IBM Cost of a Data Breach Report?
It’s an annual benchmark study by Ponemon Institute, sponsored by IBM, that surveys hundreds of companies worldwide to compute breach costs. The latest available (2025) studied ~600 breaches (up to 113K records) and reports metrics like average total cost, per-record cost, time to detect, and cost breakdown by phase. It’s widely cited because of its consistent methodology over 18+ years. However, note it’s survey-based (self-reported costs) and represents a composite “average” across the sample. Companies should use it for benchmarking, not as an exact prediction of their own breach costs.
3. What is included in the cost of a data breach?
Most reports include both direct costs and some indirect costs. Direct costs: forensic investigation, incident response labor, crisis management, legal counsel, credit monitoring/notifications, public relations, and regulatory fines. Indirect costs: business disruption, lost sales, customer churn, and productivity loss. For example, Ponemon’s data typically splits costs into (a) “detection & escalation” (forensics, IR), (b) “notification” (communications, credit monitoring), (c) “post-breach response” (legal, PR, identity protection), and (d) “lost business” (downtime and churn). Ransom payments are reported separately by vendors (IBM excludes actual ransom paid from its breach cost metric, counting the added impact instead). Always check a source’s methodology: some may omit or include fines differently, and credit monitoring may only be for U.S. victims, etc.
4. Why do data breach costs vary by industry?
Different industries have different data and regulatory profiles. Healthcare breaches are costliest (IBM 2025: ~$7.42M) because of sensitive patient data, mandatory HIPAA notification, and clinical system downtime. Financial services also see high costs ($5.56M) due to identity theft risks and heavy compliance regimes (GLBA, PCI). Retail/ecommerce costs are driven by payment card and PII theft (requiring compensation and new payment rails). Industries with less regulation or lower data sensitivity (e.g. some manufacturing or hospitality) often see costs nearer the global average or below. Regulatory fines (HIPAA, GDPR, etc.) and industry trust factors (e.g. patient safety, banking security) largely explain the cost differences.
5. Which industry has the highest data breach cost?
By most measures, healthcare. IBM’s reports have placed healthcare at the top for many years. In 2025, healthcare breaches averaged ~$7.42M, far above the global average (~$4.4M). Even though healthcare is only ~2% of Ponemon’s sample, the costs are consistently highest, driven by Protected Health Information, disruption to care, and strict reporting laws. Other high-cost industries include financial services and often industrial/energy sectors (due to critical infrastructure downtime).
6. Why is the cost of a healthcare data breach high?
Health data is highly regulated and sensitive. Breaches often involve Protected Health Information (PHI), which under HIPAA can lead to steep fines and mandatory credit monitoring for patients. Additionally, attacks can cripple hospital systems, impacting patient care (a critical “consequence beyond dollars” that nonetheless drives up liability and recovery efforts). Ponemon’s analysis finds that from 2020 to 2023, healthcare breach costs grew over 50%, reflecting more aggressive regulation and larger breach scopes. For example, a 2023 report noted healthcare’s average was ~$10.93M. (In 2025 it fell slightly, but remains highest.) This means healthcare organizations must invest heavily in specialized controls (encrypted patient records, network segmentation, continuous monitoring of medical devices) to avoid extremely large incident costs.
7. What is the average cost per record in a data breach?
IBM’s 2023 report found $165 per stolen record on average (up slightly from $164 in 2022). However, this metric depends on breach size: smaller breaches tend to have higher per-record cost (due to fixed costs) and large breaches lower per-record. Importantly, “cost per record” is an average for breaches within a certain size range (2,000–113,000 records in IBM’s study). A breach of 1,000 records isn’t simply $165,000; baseline response costs keep per-record values inflated in small events. Use per-record figures cautiously – they help estimate marginal cost of larger breaches, but focus on total cost for budgeting (IBM’s total incident cost includes fixed overhead which dominates small breaches).
8. How does ransomware affect data breach cost?
Ransomware dramatically increases cost in two ways: attackers encrypt or steal data, adding a ransom demand, and cause business disruption. IBM reports that breaches involving ransomware average $5.13M total cost, compared to $4.44M overall. Paying the ransom is just one line item – Sophos finds the average paid was about $1.0M. However, downtime and recovery often cost even more (~$1.5M on average per Sophos). Moreover, paying ransom can slow recovery (legal investigations) and doesn’t guarantee full data restoration. Since 63% of organizations opt not to pay, they must rely on backups and other recovery processes, which still incur extensive downtime. Overall, ransomware tends to multiply breach costs; organizations should strengthen offline backups, network segmentation, and IR playbooks specifically for ransomware to mitigate this factor.
9. How does breach detection and containment time affect cost?
Significantly. Both Ponemon and industry experts emphasize that longer breach lifetimes cost much more. IBM/Ponemon explicitly found breaches contained in under 200 days averaged $3.61M, whereas those over 200 days averaged $5.49M. That’s ~50% higher. The “sweet spot” is reducing detection to the shortest feasible time. In IBM’s 2025 data, the global mean time to detect-and-contain was 241 days (a nine-year low). Organizations with mature SIEM/XDR and strong IR processes (e.g. automated alerts, trained IR teams) consistently show lower costs. In practice, teams should track MTTD/MTTC metrics: each 30-day improvement can save hundreds of thousands in breach impact. Short dwell times mean attackers steal less data and defenders spend less time and money in extended investigations.
10. Do AI and security automation reduce data breach cost?
According to IBM’s research, yes, notably. Organizations with extensive use of AI-driven security and automation reported substantially lower breach costs – on average $1.9 million less – and much shorter breach lifecycles. In effect, advanced detection, automated incident workflows, and real-time analytics catch breaches sooner and reduce manual effort. However, these tools must be implemented well: our sources also note that using AI without governance introduces new risks. The key is to use AI-enabled defenses responsibly (under policies) so that it genuinely shortens response time without opening new attack channels. General automation (like SOAR runbooks and auto-isolation on alerts) similarly shrinks the window attackers have.
11. How should small businesses estimate breach cost?
Most large studies focus on enterprises, but smaller firms should adapt the concepts. An SMB with a few thousand customer records might see breach costs in the low millions or less, but that can still be financially devastating. Often, smaller companies have higher lost-business percentage (they can’t absorb downtime). They should estimate incident costs by scaling down fixed costs (IR consulting, legal fees) and smaller-scale notification. Industry reports (FTC, SBA) suggest even a $100K–$500K breach loss can be catastrophic for a small company. Hence, SMBs should weigh cyber insurance (as even partial cover) and emphasize cost-effective security measures: endpoint protection, simple network segmentation, and cloud backups. Collaborating with MSSPs or using free resources (e.g. CISA ransomware guidance) can help reduce costs. Ultimately, it’s safer to consider worst-case scenarios (most of an SMB’s budget spent on incident recovery) when planning.
12. How can companies reduce the cost of a data breach?
The data suggests reducing breach impact via preparation and controls. Key actions include:
By addressing the top cost drivers (detection time, lost business, regulatory penalties), these measures can substantially shrink the expected breach bill. As the IBM report notes, layering multiple modern controls (AI detection, DevSecOps, encryption, threat intel sharing) has a compounding effect, effectively “pre-paying” millions in breach costs.
The cost of a data breach is a critical risk metric for today’s organizations. Benchmark studies (notably IBM’s Cost of a Data Breach Report) show that 2025’s global average breach cost is $4.44M, with major variations by industry, region, and attack type. Healthcare and financial firms continue to lead in cost per incident, reflecting the sensitivity of their data and regulatory stakes.
Analysis of cost drivers reveals that time and preparedness matter most: breaches contained within 200 days cost far less than prolonged ones. Factors like legal fees, customer notification, and lost sales all add up – executives should not underestimate these “invisible” costs. Ransomware and extortion further inflate losses; victims often face multi-million-dollar recovery efforts in addition to any ransom paid. Meanwhile, emerging domains like AI and cloud can either reduce or raise costs: robust AI-enabled defenses have cut breach lifecycles by ~80 days, but uncontrolled “shadow AI” usage added ~$670K to breach costs.
For CISOs, CFOs, and boards, the takeaway is clear: these benchmarks should inform security validation, not replace it. Use breach cost data to prioritize where to harden defenses: e.g. accelerate breach detection (SIEM/XDR), fortify critical data (encryption, MFA), and test resilience (pen tests, IR drills). DeepStrike supports these goals by offering targeted penetration testing (web, API, cloud, and red teaming) and remediation validation – helping ensure your real-world security posture aligns with the risk levels implied by the cost data. In short, cost-of-breach statistics highlight the “pain points” in security programs; controlling those points through well-planned defenses and response readiness is the best way to lower the financial impact of any future breach.
Use these as the primary source links or Sanity footnotes for the benchmark, ransomware, incident-response, and control guidance used in this article.
• IBM Cost of a Data Breach Report
• Verizon Data Breach Investigations Report
• NIST Computer Security Incident Handling Guide
• NIST Cybersecurity Framework
Mohammed Khalil is a Cybersecurity Architect at DeepStrike, specializing in advanced penetration testing and offensive security operations. With certifications including CISSP, OSCP, and OSWE, he has led red team and application security engagements across technology, finance, healthcare, cloud, and regulated environments. His work focuses on real-world attack path validation, application vulnerabilities, API security, cloud security, identity exposure, breach-risk reduction, and adversary emulation.

Stay secure with DeepStrike penetration testing services. Reach out for a quote or customized technical proposal today
Contact Us
