December 7, 2025
Updated: April 23, 2026
A data-driven overview of breach frequency, costs, vectors, and industry/regional impacts for security leaders.
Mohammed Khalil

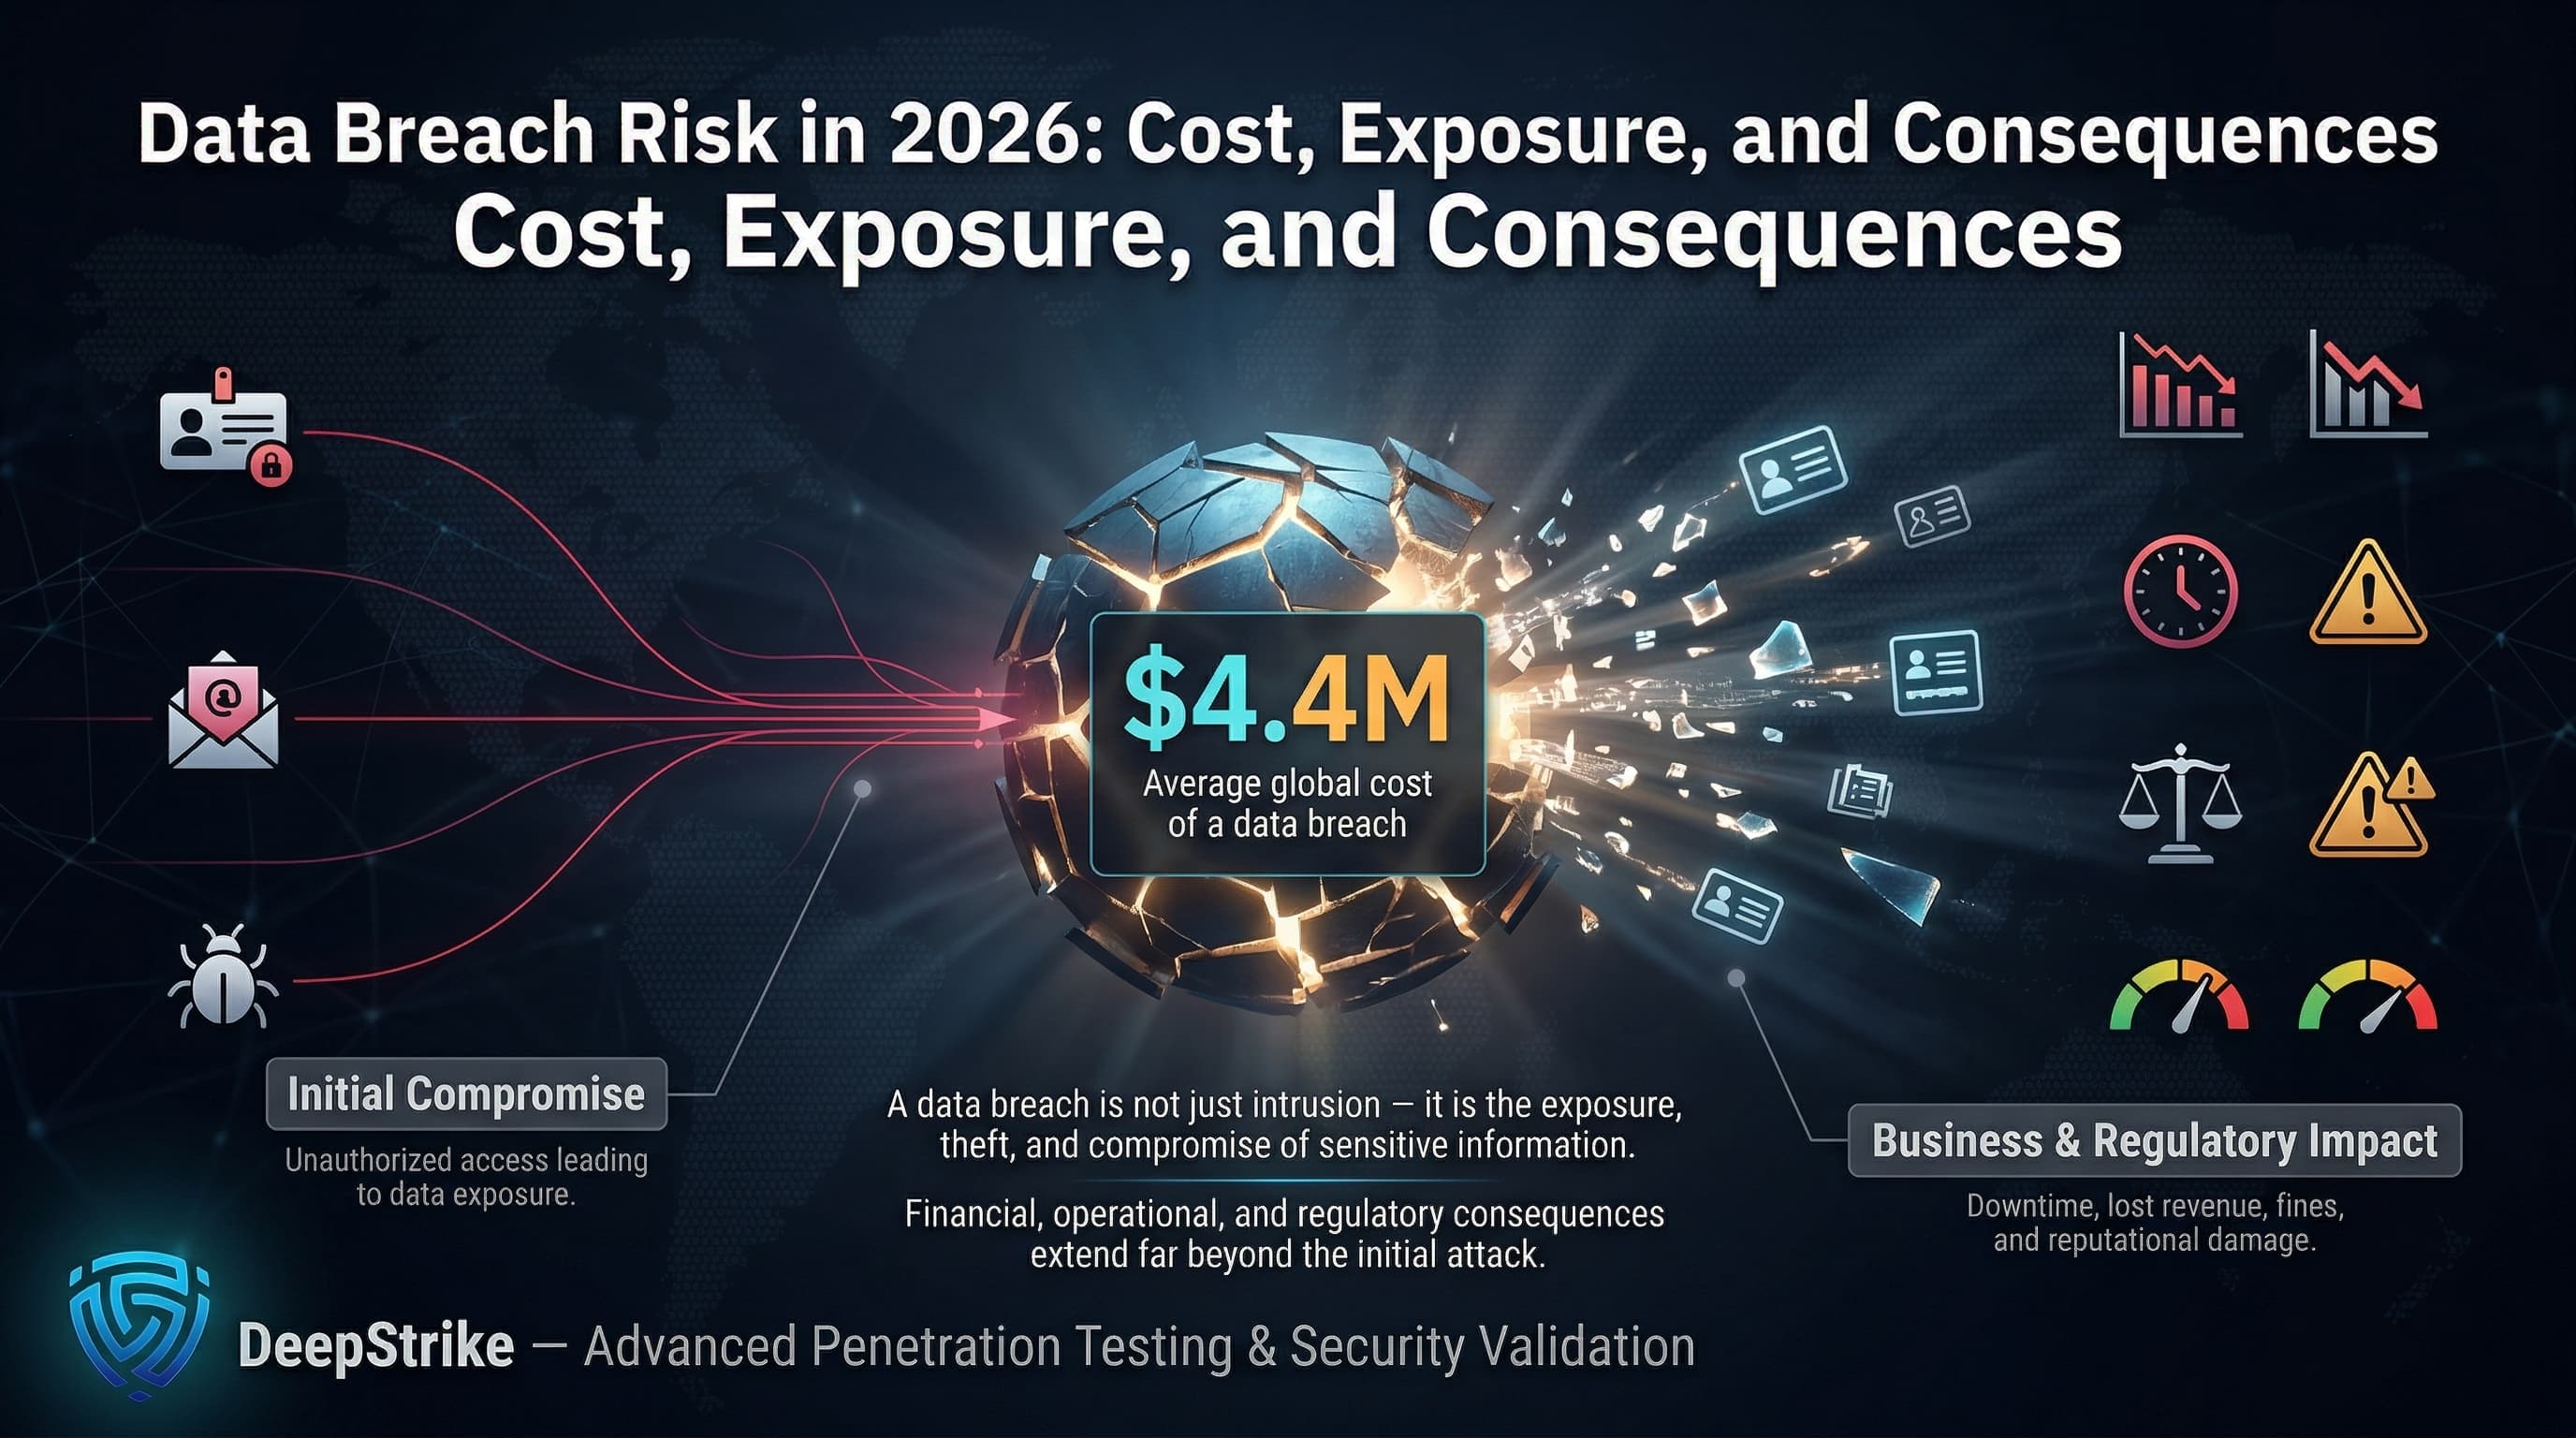
Data breach statistics paint a stark picture of organizational risk. In 2025, the global average cost of a breach stood at about $4.4 million, and analysts are monitoring record volumes of leaked data and rising identity theft patterns. These figures matter because a breach is not just a cyber-intrusion, it's the unauthorized exposure, theft, or compromise of sensitive data, with far-reaching financial, operational, and reputational fallout. Breaches trigger costly containment and notification efforts, drain revenue through downtime and lost business, and invite regulatory fines (GDPR, HIPAA, SEC etc.).
In 2025, breaches remain a nexus of threats: they often start with credential theft or phishing, exploit cloud misconfigurations and API gaps, exploit third-party relationships, or ride in on ransomware exfiltration. For example, IBM reports that stolen credentials took an average 292 days to resolve, while breaches using stolen data (passwords, tokens) drove the highest costs of any vector. Public sector, finance and healthcare are especially targeted, with nation-state espionage or highly regulated data at stake.
Why keep a pulse on breach stats? Because they convert complex incident data into decision-making insight. A multi-billion record leak (like a publicly exposed database or ransomware exfiltration) immediately signals enterprise risk: poor access controls, critical vulnerabilities, or inadequate vendor screening. High breach costs (IBM shows $375M for 50M-record breaches) translate into boardroom urgency insurance rates, security budgets, and legal planning must adjust. And trends such as faster AI-driven phishing or skyrocketing identity leaks demand new defenses (e.g. phishing-resistant authentication or identity monitoring).
In short, by 2025 data breaches will be understood not as isolated hacks but as major business events: identity compromises tied to tangible losses, regulatory headaches, customer churn, and strategic impairment. These statistics help CISOs, boards, and risk teams allocate controls and funding to prevent and survive such breaches, from phishing-resistant MFA to robust IR playbooks.
Definition: Data Breach Statistics refer to quantified data about incidents involving unauthorized access to, disclosure of, theft of, or exposure of sensitive information, including breach frequency, financial impact, time to identify and contain, attack methods, industry targeting, regional variation, and broader trends in how organizations lose control of critical data.
Data breach statistics encompass several distinct measures, each capturing a different aspect of the problem:
Illustrative Example: Suppose a company suffers one breach in a year. It reports 1 breach incident; that incident exposes 1,000,000 customer records. IBM’s study might assign an average cost of, say, $4.5M for a breach of that scale. However, the true business impact could include lost market share or long-term reputation harm not captured in the cost study. Meanwhile, industry stats might show this sector typically sees 20 breaches/year (breach count) and $200/record (cost per record). All these measures count, records, cost look at the event differently, so data breach statistics provide a multi-faceted view of risk.
Breaches are measured via breach-response surveys (for cost), public notifications (for counts/records), incident-response findings (for technical vectors), and regulatory filings (for enforcement). These sources are not interchangeable: a breach reported to regulators may not include all details, while a forensic team’s case data may cover only specific attack types. Analysts must interpret each stat in context (survey bias, disclosure laws, detection delays) to understand the broader trend.
| Metric | 2024 or Latest (Global) | 2025 | Trend | Notes |
|---|---|---|---|---|
| Avg. Breach Cost (USD) | $4.88M (2024) | $4.44M (2025) | ↓9% | IBM/Ponemon global average (includes all sectors). US cost spiked to $10.22M. |
| Time to ID/Contain (days) | 258 total (194+64) (2024) | 241 total (181+60) | ↓ | Mean time from breach start to containment (IBM). Nine-year low in 2025, aided by AI detection. |
| Phishing/Social Eng. Vector | ~15% (IBM/DBIR) | 16% of breaches (IBM) | ↑ | IBM identifies phishing as a leading breach vector in 2025, while other datasets continue to emphasize credential-based initial access. These figures are directionally aligned but not fully interchangeable. |
| Cloud/Config Exposure | 40% breaches multi-env (2024) | 30% multi-env (2025) | ↓ reported share | IBM: share of breaches with data in multiple locations fell from 40% to 30%. IBM reported that breaches involving multiple environments remained materially more expensive than single-environment incidents. |
| Ransomware Presence | 32% (2024) | 44% (2025) | ↑37% | From DBIR 2025: ransomware (with or without encryption) in 44% of breaches. Median ransom paid fell to $115K. |
Additional contextual signals: Public notification volumes, identity-related exposure indicators, third-party involvement, and regulatory enforcement trends are useful for interpreting breach severity and governance pressure, but they often come from different reporting systems and should not be treated as directly comparable year-over-year metrics in the same summary table.
Note on cost-per-record comparisons: IBM reported an overall average cost per record of roughly $173 in 2024, while certain record classes, such as intellectual property, can carry higher modeled costs. This should not be treated as a strict year-over-year comparison.
In 2024–2025 the global picture saw some cost easing but more breaches. IBM’s data breach report shows average costs dropping (driven by faster detection and containment), yet record-level breaches continued to rise in sheer volume. Cloud/multi-environment breaches decreased in share, possibly reflecting better cloud hygiene or reporting, though those incidents remain costlier. Meanwhile, third-party and supplier-related exposure became materially more important in recent breach reporting, reinforcing the need to treat vendor risk as a core part of enterprise breach prevention. Ransomware’s role in breaches kept climbing, present in 44% of cases.
Interpretation: Faster response (241 days in 2025 vs 258 in 2024) helped lower costs, as IBM notes. But the explosion of exposed data (US notifications up 211%) suggests organizations are still struggling with perimeter vulnerabilities and overlooked systems. Third-party risk has become acute, with vendor and service-provider exposure appearing more prominently in recent breach reporting. Many metrics come from breach response studies (Ponemon/IBM) and public notifications; methodologies differ, so comparisons should focus on direction (up/down) not exact values.
Breaches inflict multifaceted costs. We can segment:
Here is a comparative summary of cost indicators:
| Indicator | 2024 | 2025 / Latest Available | Trend | Notes |
|---|---|---|---|---|
| Average Total Breach Cost | $4.88M | $4.44M | ↓ | IBM global average breach cost declined as detection and containment improved. U.S. breach costs remained materially higher than the global average. |
| Breach Lifecycle (Identify + Contain) | 258 days | 241 days | ↓ | Faster identification and containment reduced overall breach cost and shortened business disruption. |
| Cost per Record (Contextual Benchmark) | ~$173 | Context-dependent | — | Cost per record varies materially by data class, sector, geography, and breach scale. It should be used as a modeling aid, not as a strict year-over-year benchmark. |
| Lost Business Impact | ~$1.58M | ~$1.47M | ↓ | Lost business remained one of the largest cost components, including downtime, churn, and reputational fallout. |
| Legal and Regulatory Exposure | High and variable | High and variable | ↑ | Legal, disclosure, and regulatory costs remain highly case-specific and can materially increase total breach impact in regulated sectors. |
| IR Preparedness Effect | Contextual | Contextual | — | Tested incident response capabilities and faster escalation materially reduce breach cost, even when they do not eliminate the incident itself. |
Interpretation: The direct financial impact of a breach extends beyond technical remediation. Faster detection and containment reduce total breach cost, but long-tail losses such as customer churn, legal exposure, operational disruption, and executive attention remain significant. Cost-per-record figures are useful for context, but they should not be confused with total business impact.
Cyber insurance should be treated as a secondary financial control rather than a primary breach-mitigation measure, especially as premiums, exclusions, and claims scrutiny rise after major incidents.
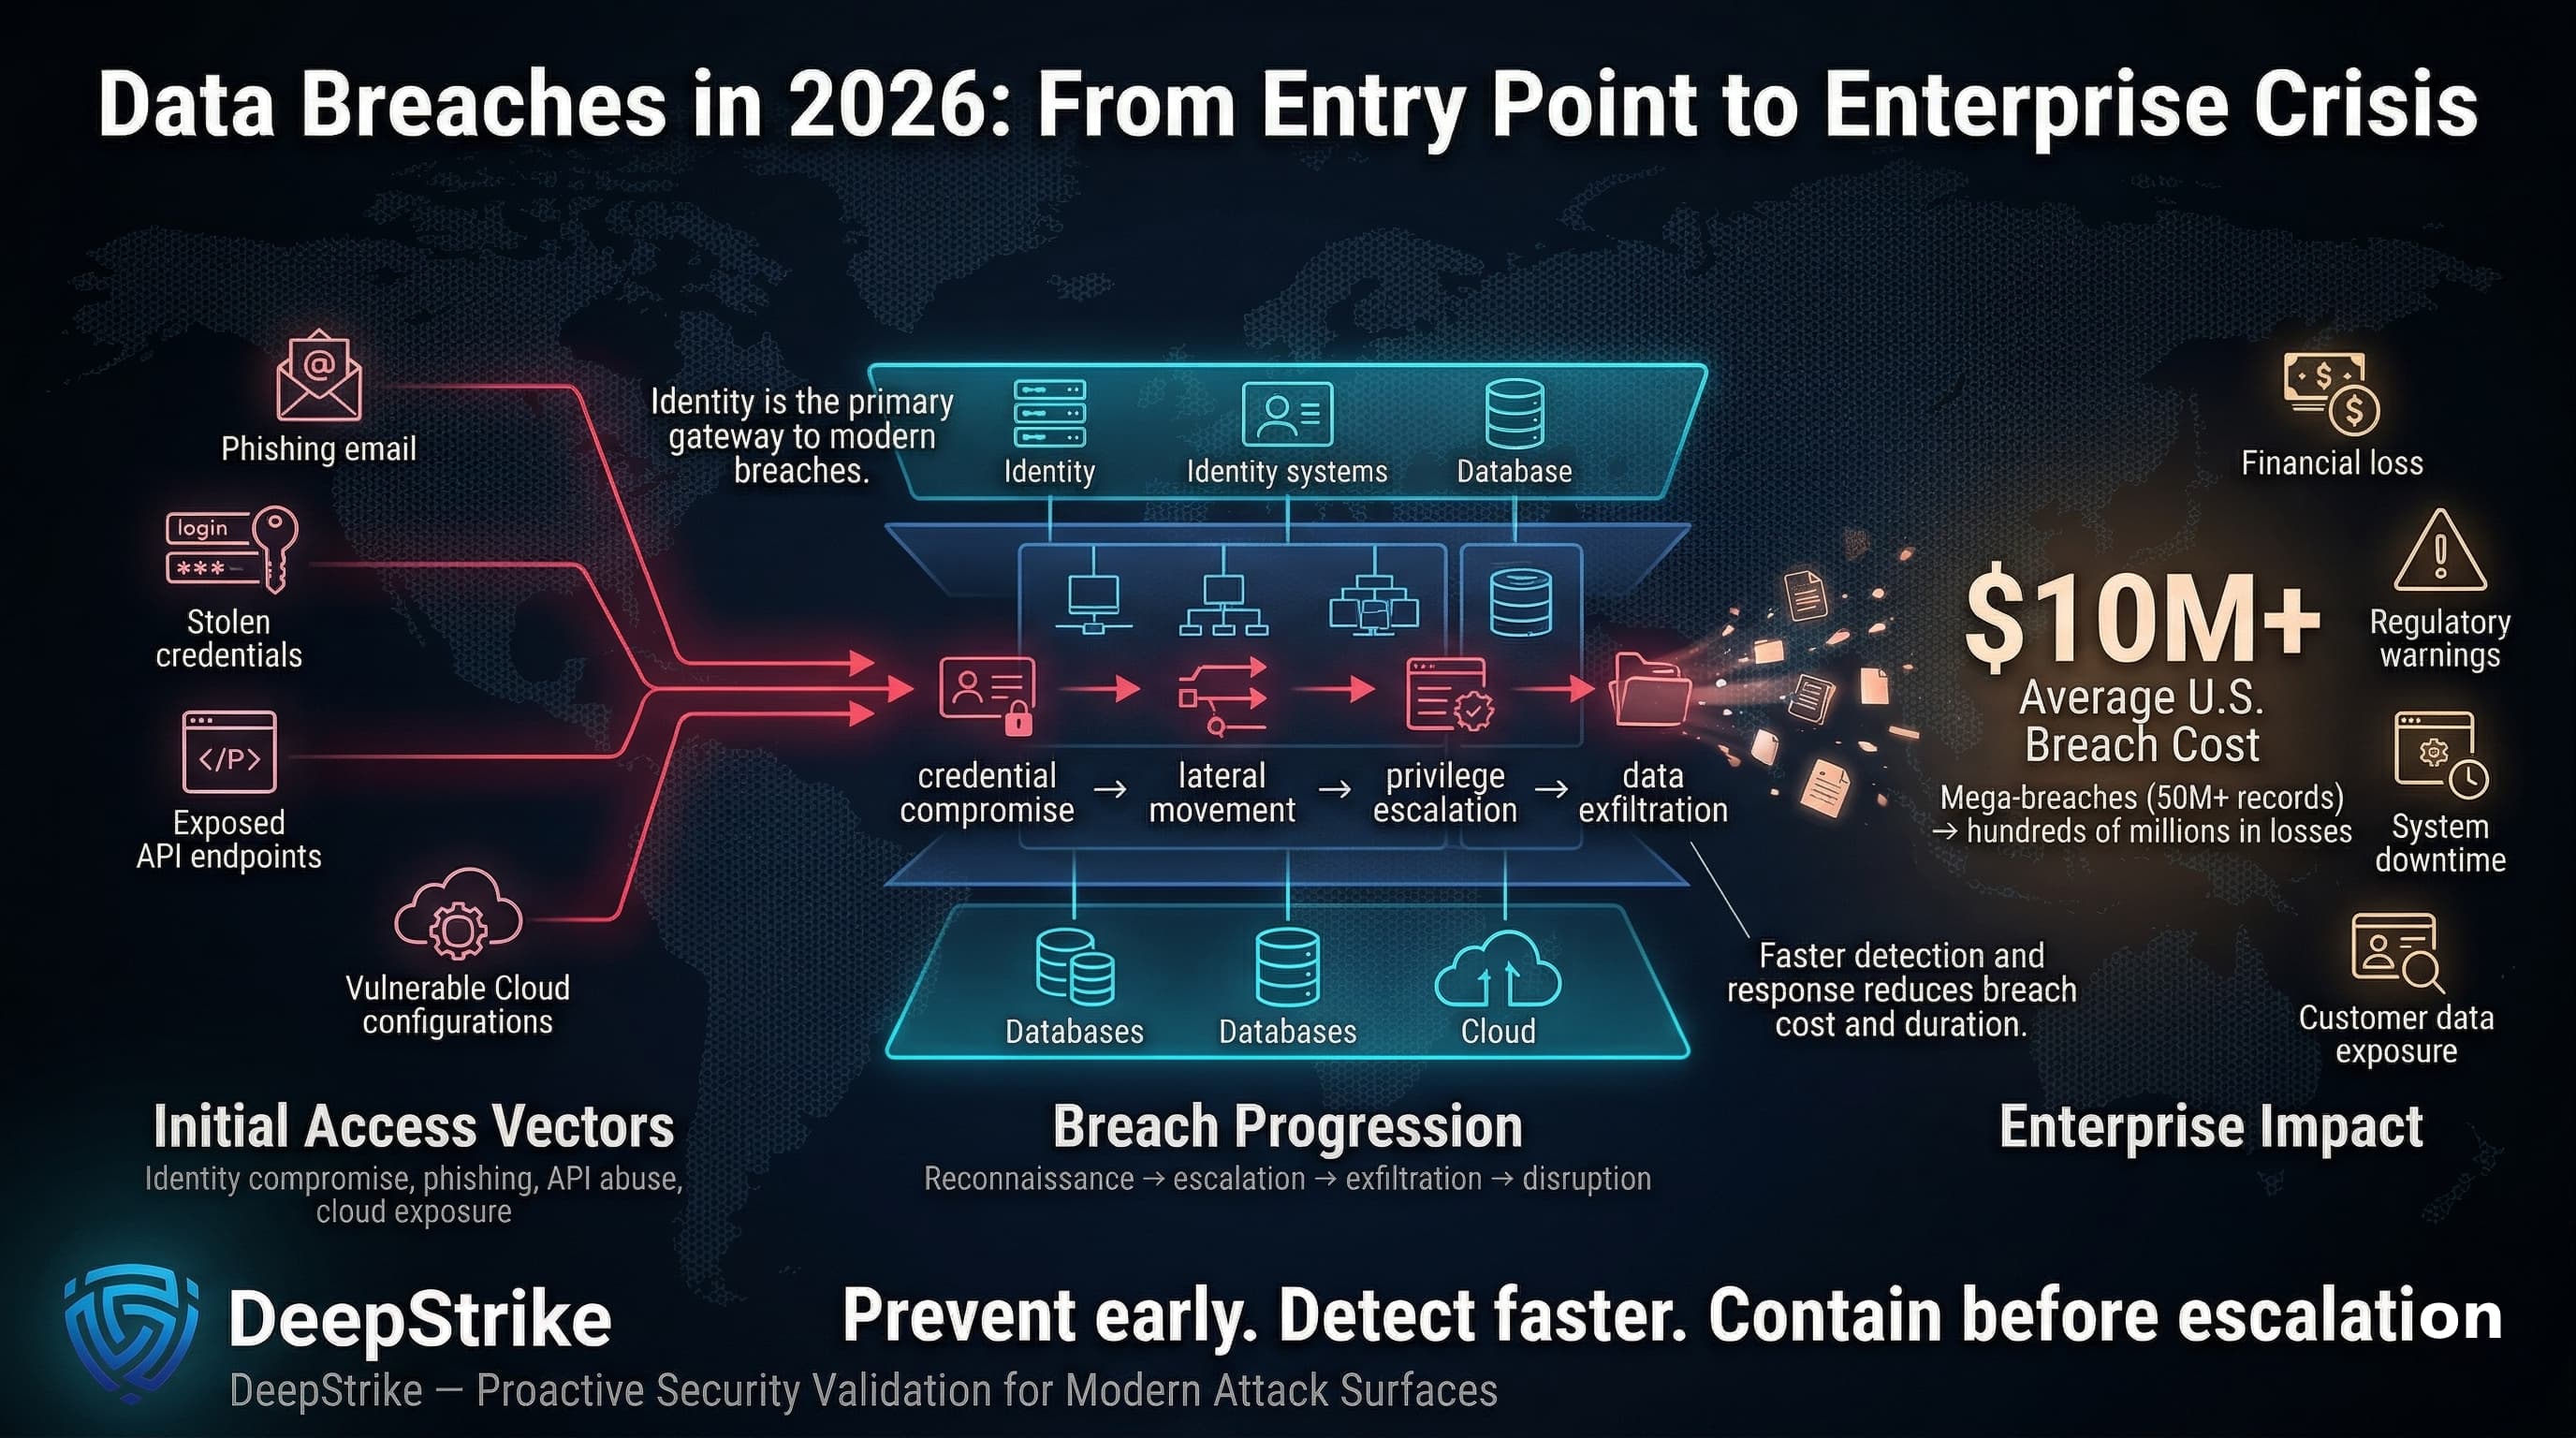
Stolen or compromised credentials remain one of the most consistent breach enablers across breach-response and incident-analysis datasets. Attackers gather leaked usernames/passwords (on the dark web) or phish users, then log in as employees or customers. IBM’s research found breaches involving compromised credentials were slowest to find (often ~292 days) and led to deep system infiltration. Verizon’s DBIR consistently highlights credential-based “Initial Access” including password reuse and session hijacking as the largest initial breach vector. In practice, one compromised user account can lead to account takeovers, lateral movement, privilege escalation, and ultimately data exfiltration. This pattern matters because it underscores the need for identity-centric defenses (multi-factor auth, robust identity monitoring): once an attacker has legitimate credentials, typical network defenses often fail.
Phishing emails and social engineering remain prime breach catalysts. IBM identifies phishing as a leading breach vector in 2025, while other datasets continue to show credential-based intrusion as a dominant initial-access pattern. Together, these findings reinforce the tight coupling between phishing exposure and identity compromise. Mandiant’s M-Trends similarly notes phishing as ~17% of initial infection vectors. Phishing works by tricking users into revealing passwords or clicking malicious links, giving attackers initial access. The pattern is operational: a phishing email → account compromise → data access. This drives many breaches, especially ransomware with double extortion. Companies see that effective email filtering, user training, and phishing-resistant MFA (passkeys, hardware tokens) are critical; one bank-related study showed that even one user falling to phishing can cost tens of millions in a breach. Organizations can reduce this risk by tightening internal controls, while individuals and employees can also use data removal services such as Aura to reduce their exposure on public databases and data broker platforms.
Cloud misconfiguration and overly-permissive APIs increasingly cause breaches. Misconfiguration, process gaps, and governance failures remain recurrent breach contributors, especially in hybrid and multi-environment estates. These include exposed S3 buckets, misconfigured databases, or debug APIs left open. IBM data shows breaches spanning multiple storage environments (public/private cloud, on-prem) are common, and those cost significantly more. A practical example: a company accidentally makes an S3 bucket public, exposing customer PII. Attackers then collect that data without “hacking” a configuration error counts as a breach (since data was exposed). Rising cloud usage means misconfig errors can expose data at scale; thus breaches now often involve cloud governance failings. This pattern signals that cloud security posture management and API security are no longer optional.
Vendor and supply chain breaches are growing drivers. Recent DBIR reporting indicates a sharp increase in breaches involving third parties, reinforcing the need to treat vendor access, service-provider trust, and shared data flows as first-class breach risks. This includes SaaS providers, contractors, or embedded software. For example, attackers compromise a service provider (like Ticketmaster’s Gigya breach) and leverage that trust to access end-client data. These breaches cascade: a flaw in one company’s security opens the door at dozens of customers. The real-world impact is vast: the 2024 Change Healthcare incident (a vendor for many hospitals) affected 70M+ patient records. Operationally, this means organizations must treat vendor security as an extension of their own e.g. enforcing least privilege access for service accounts, and inspecting third-party code/credentials. Traditional security perimeters don’t stop these breaches, so organizations must orchestrate incident response and risk assessments with their vendors as partners.
Ransomware and data breach categories are converging. In many modern ransomware incidents, attackers encrypt systems after stealing data and threaten to publish it. Verizon found ransomware in 44% of breaches. IBM reports that extortion incidents (when attackers leak data) average $5.08M cost. In practice, a healthcare provider hit by ransomware might see patient records exfiltrated and posted on leak sites (as in the Change Healthcare case). This pattern matters because it means many ransomware events now are data breaches with regulatory obligations (breach notification, fines). Security teams must recognize that paying or not paying ransom isn't the end: the exposure itself is a breach event that inflicts long-term damage and must be managed (forensics, notifications). It also underscores calls to adopt segmented backups and full data encryption, to reduce incentive for attackers to steal data or ensure it’s useless if leaked.
| Vector / Method | Share of Incidents | Avg Impact/Cost | Notes |
|---|---|---|---|
| Phishing / Social Engineering | 16% | $4.8M | IBM: Became top vector in 2025. Phishing e-mails lead to compromised credentials. Often the entry point for ransomware. |
| Supply Chain / 3rd-Party Compromise | Context-dependent / rising | $4.91M | Recent breach reporting shows materially higher third-party involvement than in prior years, but exact percentages vary by dataset and breach definition. |
| Stolen or Compromised Credentials | 10% (IBM) | $4.67M | Attackers use leaked/stolen passwords or token theft. One of longest dwell times (292 days). Common in web app and network breaches. |
| Vulnerability Exploitation | 9% | $4.24M | Attackers exploit software/firmware flaws. Rapid patching often incomplete (54% patch rate on edge devices). Critical unpatched services welcome intrusion. |
| Denial-of-Service / Disruption | 12% | $4.41M | DDoS or DoS can provide cover or directly cause data exposure (e.g. if backups fail). Secondary cost via downtime. |
| Malicious Insider | ~7% | $4.92M | IBM: highest per-incident cost ($4.99M). Insiders intentionally leak data or misconfigure systems. Hard to detect; requires strong monitoring/behavioral analysis. |
| Physical Theft / Loss | 3–5% (IBM) | ~$3.6M | Media, laptops stolen leading to exposure. Less common but costly. |
| Error/Accident | 15–24% (varies) | ~$3.6M (sys error) | Human or system errors (misdelivery, misconfig). IBM cites ~24% breaches from error in finance. Often undercounted. |
Explanation: Breaches often chain multiple stages: an initial foothold (often phishing or stolen creds) → privilege escalation (using vulnerabilities or stolen keys) → data discovery → exfiltration or exposure → detection & containment challenge. Attack chains frequently match MITRE ATT&CK phases (Initial Access → Lateral Movement → Exfiltration). For example, a phishing email (TA0001) may give a foothold (TA0006 Credential Access), then malware escalation (TA0005 Defense Evasion), culminating in copying database files (TA0010 Exfiltration).
Notably, these vectors highlight identity risk: Phishing and stolen credentials consistently dominate early-stage breach activity across major datasets, underscoring why MFA and identity monitoring remain essential. The cost column shows that breaches involving insiders or third-party compromise are particularly expensive (due to detection delays and breadth of access). Conversely, insider error or system misconfig have lower avg costs but higher frequency. Overall, focusing only on “technical” vectors (exploits, malware) misses the key human factor: 60%+ of breaches involve some human element (misconfiguration, phishing, etc).
| Industry | Relative Exposure | Typical Impact Pattern | Key Notes |
|---|---|---|---|
| Healthcare | Very High | Very high cost per breach ($10–11M); large-scale patient data losses. | Sensitive PHI, heavy fines (HIPAA, HITECH). Consolidated vendors (e.g. Change Healthcare 190M records) create single points of failure. Legacy systems and rapid digitization elevate risk. |
| Financial Services | High | High cost (~$6M) and frequent targeting. | Regulated data (PII, financial transactions). Attackers seek money (fraud) 88% of Verizon breaches motive = financial. Strong compliance (GLBA, SEC) means heavy penalties on breaches. |
| Technology/High Tech | Medium-High | High breach count (intellectual property, customer data); moderate cost. | Large tech firms have vast data and global footprint. Breaches often target code/IP (high per-record cost) and SaaS keys. Zero-day exploitation is common (M-Trends: edge focus). |
| Manufacturing | Medium | Strategic IP theft; operational disruption. | Targeted by espionage (DBIR notes rise to 17% espionage), supply chain (component software). Legacy OT systems can be entry points. Downtime cost significant (productions halted). |
| Retail / Consumer | High volume | Large user data breaches (payment cards, PII); moderate costs. | Vast customer databases (loyalty programs, cards). Frequent phishing & POS malware incidents. PCI compliance drives specialized controls but consumer data theft (email, passwords) is common. |
| Government / Public | Moderate-High | Mix: citizen data (PHI in Medicare, voter info) and critical secrets. | Often lower budgets for security. Nation-state actors active (Espionage up to 17% breaches). Mandatory reporting (like CISA guidance) increases breach visibility. Incident response coordination can be slow. |
Interpretation: Industries differ mainly by data sensitivity and regulatory context. Healthcare’s exposure is extreme because patient records and medical info are both valuable to criminals and tightly regulated, plus many interlinked systems (e.g. pharma, hospitals). Finance also sees higher than average costs due to large records and strict laws (GDPR, NY DFS, SEC). Tech companies have constant adversaries but often more mature security; their breaches cost more per record (IP value) but they also have robust incident response budgets.
Retail and hospitality see frequent breaches (e.g. customer PII, credit cards), but average costs per breach can be lower because per-record cost dips with volume (IBM found retail ~$3-4M per breach historically). Manufacturers deal in trade secrets and process data, and disruption can cost millions in idle lines (IBM noted industrial sector cost+ $830k over last year).
Government breaches range widely: a municipal breach of health records might be cheap to remedy, whereas an ICS attack (e.g. water treatment hack) has immense safety implications. Public sector breaches often have complex disclosure rules, so reported breaches include critical infrastructure (e.g. CISA alerts), making this sector relatively visible.
| Region | Key Trend | Cost or Impact Signal | Notes |
|---|---|---|---|
| North America (US) | Highest costs; heavy disclosures | Avg cost $10.22M; 1.35B victim notices (2024) | US leads in breach costs (IBM) and volume (ITRC). Many privacy laws (SEC rule, state laws) drive reporting. Health and financial sectors biggest incidents (ITRC 2024 says Finance most breached, then Healthcare). Cyber insurance is also most active in the US. |
| Europe (EU) | Stringent regulation; fines soar | GDPR fines multiple $100M+ (2024); avg breach cost ~$4–5M (IBM previously) | GDPR requires prompt breach notification; fines are public (Meta, Amazon etc.). European firms see higher notifications (UK ICO log), but often lower mean costs due to fewer large IT budgets. Cross-border coordination (EU-US data flows) adds complexity. |
| UK | Increasing breaches, proactive response | ICO enforcement active; similar trends to EU | New UK GDPR and upcoming security laws. Public sector incidents (e.g. NHS) garnered attention. Government mandates incident reporting; vendor breaches (like NHS data under home care agencies) highlight supply chain risk. |
| APAC | Rapid digitization, evolving regs | Underreported breaches; rising ransomware | Asia-Pacific shows growing breach cases (some national CERTs report increases) but often lacks disclosure mandates (e.g. India’s new law is nascent). High cloud migration means misconfig risks. Financial sectors (e.g. Asia-Pac banks) facing targeted APTs. |
| Middle East (MENA) | Emerging cybersecurity focus; state-led attacks | Limited public data; budgets increasing | Many MENA states are upgrading cyber infrastructure. The government and oil sector are high-profile targets. Data breach statistics here are sparse, but incidents (e.g. OPEC-related breaches) hint at espionage focus. Developing privacy regimes (like UAE PDPL) will increase reporting. |
| Latin America | Digital economy growth, informal disclosures | Some mega breaches (government sites defaced); lower avg costs | Few mandatory breach laws (Mexico’s LFPDPPP but inconsistent enforcement). Bitcoin and ransomware payment have been common in LAC. Brazilian data protection law (LGPD) is new. Cross-border cloud providers (AWS, Azure) often host local data, so config issues lead to leaks (e.g. exposed S3 in Brazil). |
| Global | Underreporting gap; bias to U.S./EU data | CISA and Interpol note many small orgs don’t disclose breaches | Many breaches go undetected, especially in regions with less regulation. Global stats rely on U.S./EU reports true worldwide count could be 20–50% higher. Economic disparities mean breach impact varies, but supply chains integrate globally. |
Interpretation: Globally, the U.S. dominates breach cost and volume because of strict reporting laws and a data-rich economy. European countries report severe enforcement but somewhat lower volume counts (some reporting under GDPR, others internal). Emerging regions (APAC, LATAM, MENA) are not well captured by global stats; however, trends suggest rising ransomware and cloud misconfig issues. For instance, IBM noted that costs in Asia Pacific trended lower historically, but growing cloud use suggests risk. The disparity in data means multinational firms often face a patchwork of notification rules and risk exposures, complicating enterprise risk management.
Each case underlines real-world patterns: breaches are often multi-stage (initial compromise → exfiltration → public disclosure) and involve cross-cutting issues (e.g. weak identity controls, supply-chain trust). None of these examples are fabricated; they are drawn from public reports and illustrate the strategic impact of breach stats on operations and compliance.
| Attribute | Data Breach Statistics | Cybersecurity Statistics | Cybercrime Statistics |
|---|---|---|---|
| Primary Focus | Unauthorized data exposure incidents affecting organizations | Technical security posture & incidents (viruses, vulnerability trends, phishing) | Crime executed via digital means (fraud, theft, scams, abuse of data) |
| Typical Metrics | # breaches, records stolen, avg. breach cost, time to detect/contain | # attacks blocked, vulnerability counts, patch gap, malware volumes | $ lost to fraud, # identity theft cases, law enforcement reports |
| Financial Emphasis | Emphasizes breach cost, regulatory fines, lost revenue | Emphasizes ROI on controls; sometimes indirect (cost of breaches prevented) | Emphasizes total economic loss to criminals (e.g. $6B fraud loss) |
| Reporting Source | Breach notifications, incident reports, DBIR, Ponemon surveys, public filings | Security vendor telemetry, vulnerability databases, threat intel reports | Government and police statistics (FBI IC3, Europol), consumer survey data |
| Business Relevance | Direct link to corporate risk, compliance and litigation; used by boards/CISOs for budgeting | Operational security metrics for IT/Sec teams (SOC metrics, patch % etc.) | High-level trend of organized crime; more relevant for policy makers or insurers |
| Common Limitation | Underreporting bias (not all breaches found/reported); mix of methodologies (surveys vs public data) | Over-reporting of attempts vs actual impact; can be very technical (e.g. X% of servers have <badge>) | Lumpy and misleading (includes consumer scams, double-counting losses, hard to tie to corporate breaches) |
Explanation: Data breach stats concentrate on incidents of data loss by businesses and their direct fallout. They measure different things than general “cybersecurity statistics” (which might report many blocked phishing emails or patch statistics) or “cybercrime stats” (which often report totals of fraud losses including personal finance crimes).
For example, IBM’s average breach cost is a data breach stat; a cybersecurity stat might be “# of phishing emails blocked per month”, whereas a cybercrime stat might be “$3.5B lost to cyber fraud (IC3)”. Breach metrics inform business decision-makers about managing data risk, while cybersecurity stats drive technical programs. Cybercrime stats include non-corporate losses (e.g. victims of romance scams), so they can exaggerate the threat landscape unless carefully interpreted.
Breach stats are critical for enterprises, as they link breach likelihood and impact to control decisions (e.g. how much to invest in encryption or IR). They differ from broad cybercrime figures that treat all online crime together. In summary, data breach statistics highlight exposure and impact on organizations (and thus enterprise risk), whereas cybersecurity and cybercrime stats address broader threat patterns.
Breach numbers aren’t just academic they drive concrete security and business decisions:
In essence, numbers from breach reports translate into priorities: because phishing and credential theft dominate, invest first in identity-sec and phishing defense; because cloud misconfig is a frequent cause, invest in CSPM and secure development; because third-party breaches spike, strengthen vendor governance; because detection time is critical, improve monitoring and IR. Each statistic in the breach reports points to either a vulnerability to fix or a control to reinforce.
Based on breach statistics, these controls directly address the key risk factors:
Each control directly addresses a known breach vector or cost driver. For example, phishing-resistant MFA directly attacks the leading vector (phishing and credential theft). Cloud governance mitigates misconfigurations. Data encryption limits breach impact on final costs. Tabletop drills shorten response time, lowering overall cost. In a portfolio risk approach, statistics tell us where to invest in controls.
Risk = Probability × Impact. Data breach stats inform both sides of this equation for decision-makers:
By plugging breach statistics (frequency, record counts, cost per record) into an expected loss model, risk managers can quantify cyber risk in financial terms for boards. These models are used in risk registers and insurance underwriting. The key is labeling assumptions clearly: e.g., “Based on 2025 IBM data, a breach averaging 25K records costs ~$4.4M; our 1M-record scenario yields proportionally more.”
They are figures that quantify data breach events: counts of breaches, records exposed, attack methods, and financial impacts. They come from sources like breach notification reports, incident response surveys (IBM/Ponemon), and research (Verizon DBIR). These stats help organizations understand how often breaches happen and what the consequences (cost, downtime) typically are.
Breaches are unfortunately frequent. For example, over 3,100 U.S. breaches were reported in 2024 (close to a record year). Verizon’s 2025 DBIR studied 12,195 confirmed breaches worldwide. Some industries see multiple incidents per year; others, fewer. Many small breaches never make headlines, so the actual global count is higher. The trend shows sustained breach frequency, but actual exposure varies materially by sector, size, reporting obligations, and security maturity., but actual exposure varies materially by sector, size, reporting obligations, and security maturity.
It varies by industry and scale. IBM’s global average was about $4.4 million in 2025. However, costs range from under $1M for small breaches to tens of millions for major incidents (especially in healthcare). On a per-record basis, IBM found costs around $156–$178 per record in recent studies. These figures include technical response, legal, and business losses. The key takeaway: breaches are expensive, often into the millions, and rising with larger data volumes.
Traditionally, healthcare and financial services top the list. Healthcare had the highest average breach cost ($10.9M) due to regulated patient data (HIPAA) and interconnected systems. Finance breaches average ~$6M, driven by high-value personal/financial data and strict regulations (GLBA, SEC). Retail and technology firms also see frequent breaches (customer and IP data). Public sector and utilities are targets for nation-state attacks. Ultimately, industries with rich personal data or critical infrastructure tend to be hit hardest.
The leading causes are identity and social-engineering attacks. Phishing emails and stolen credentials are among the most common initial breach vectors across major datasets. Exploited vulnerabilities are also common (about 20–30% in recent studies), as are third-party/supply-chain exploits. A study found malicious insiders had the highest per-incident cost but were less frequent. In summary, weak credentials and human error (clicking phishing links, misconfiguration) underlie most breaches.
A cyberattack is any malicious activity against IT systems (malware, DDoS, intrusion) most do not necessarily expose sensitive data. A data breach specifically refers to an incident where sensitive data is accessed, stolen, or exposed. For example, ransomware is a cyberattack; if it encrypts data without exfiltrating it, it’s a cyberattack but not a breach (though often still reported as one). Data breach stats focus on incidents where data loss occurred, which is a subset of all cyber incidents.
Focus on the top causes: implement strong authentication (MFA/passkeys) to prevent account compromise, train staff to avoid phishing, and rigorously secure cloud and third-party access. Use encryption and minimize stored sensitive data. Also invest in rapid detection (so breaches are caught sooner) and robust response plans. Regular penetration tests and third-party risk assessments help find gaps. Essentially, apply layered controls: identity management, email security, network/cloud monitoring, and incident readiness.
Yes, especially outside regulated sectors. Mandatory reporting laws (like GDPR, HIPAA, state breach laws) force companies to disclose certain breaches. However, many breaches go undetected or unreported (if they don’t meet notification thresholds). ITRC found many notifications in 2024 lacked detail (70% lacked vector info), indicating reporting does not always give full visibility. Global stats rely heavily on what gets reported in the U.S. and EU; breaches in other regions or small companies may not appear in public data.
Data breach statistics reveal that breaches are far more than isolated IT problems they are major enterprise crises. The key findings are clear: identity compromise (via phishing or stolen credentials) is the gateway to most breaches, while cloud exposures and third-party vulnerabilities are rapidly expanding the threat surface. Breaches incur not just immediate IT remediation costs, but extended losses: regulatory fines, customer churn, and long downtime. For example, IBM’s studies show that mega-breaches of 50 million records can cost hundreds of millions, illustrating the strategic stakes.
Far from being mere compliance checkboxes, breaches involve a cascade of actions: attackers often infiltrate via compromised logins or API bugs, explore the network, exfiltrate troves of data, and leave victims in breach notification turmoil. This means organizations must tackle breaches holistically: from phishing-resistant identity controls to airtight cloud governance, from rigorous vendor management to rapid detection engineering.
Our breakdown also confirms that breach metrics should drive action. If the average U.S. breach now costs over $10M, boards and risk managers must demand investments in the controls proven to reduce those losses. The statistics on faster response cutting months off detection argue for AI-driven monitoring and tested response plans. Third-party breach trends push us to treat vendor risk as core IT risk.
In summary, data breach statistics are a powerful decision-support tool: they quantify how often and how badly organizations get hit, highlighting the parts of the security program that need reinforcement. CISOs should use these numbers to prioritize defenses (identity, email, cloud, third-party oversight, incident readiness) and to communicate the business impact to leadership. The data underscores that preventing breaches (or catching them quickly) can save millions, protect customers, and maintain trust.
Above all, breach statistics remind us: once data is out, it’s out. The sooner organizations act on these insights by tightening controls and refining resilience the better they can prevent a breach from becoming a full-blown business crisis.
Mohammed Khalil is a Cybersecurity Architect at DeepStrike, specializing in advanced penetration testing and offensive security operations. With certifications including CISSP, OSCP, and OSWE, he has led numerous red team engagements for Fortune 500 companies, focusing on cloud security, application vulnerabilities, and adversary emulation. His work involves dissecting complex attack chains and developing resilient defense strategies for clients in the finance, healthcare, and technology sectors.

Stay secure with DeepStrike penetration testing services. Reach out for a quote or customized technical proposal today
Contact Us