March 30, 2026
Updated: March 30, 2026
A data-driven guide to cyber threats, breach costs, phishing, ransomware, identity attacks, and business risk in 2026.
Mohammed Khalil
Not every number in a 2026 cybersecurity article is a full-year 2026 actual. The most reliable enterprise metrics currently come from the latest complete 2024-2025 datasets, while 2026 figures are often forecasts or directional indicators. Readers should distinguish between complaint data, breach-cost studies, incident-response cohorts, and vendor telemetry rather than treating them as interchangeable. This article separates measured outcomes from forward-looking expectations so security leaders can use the data more accurately in budgeting, board reporting, and risk modeling.
| Metric | Latest actual data | 2026 outlook |
|---|---|---|
| Cybercrime losses | FBI IC3 reported $16.6B in losses for 2024 | High-loss environment continues |
| Phishing activity | APWG tracked ~3.8M phishing sites in 2025 | Continued high-volume phishing pressure |
| Global ransomware activity | ~7,419 attacks in 2025 | Elevated ransomware volume likely to continue |
| Global average breach cost | Latest published figure around $4.44M | No full-year 2026 actual yet |
| U.S. breach cost | Latest published figure around $10.22M | U.S. costs likely remain elevated |
| Global cybersecurity spending | 2025 estimate around $213B | 2026 forecast around $240B |
Cybersecurity statistics refer to quantified data about cyber threats, incidents, losses, control failures, attack methods, victim impact, industry targeting, regional variation, and broader trends affecting enterprise security and digital risk.
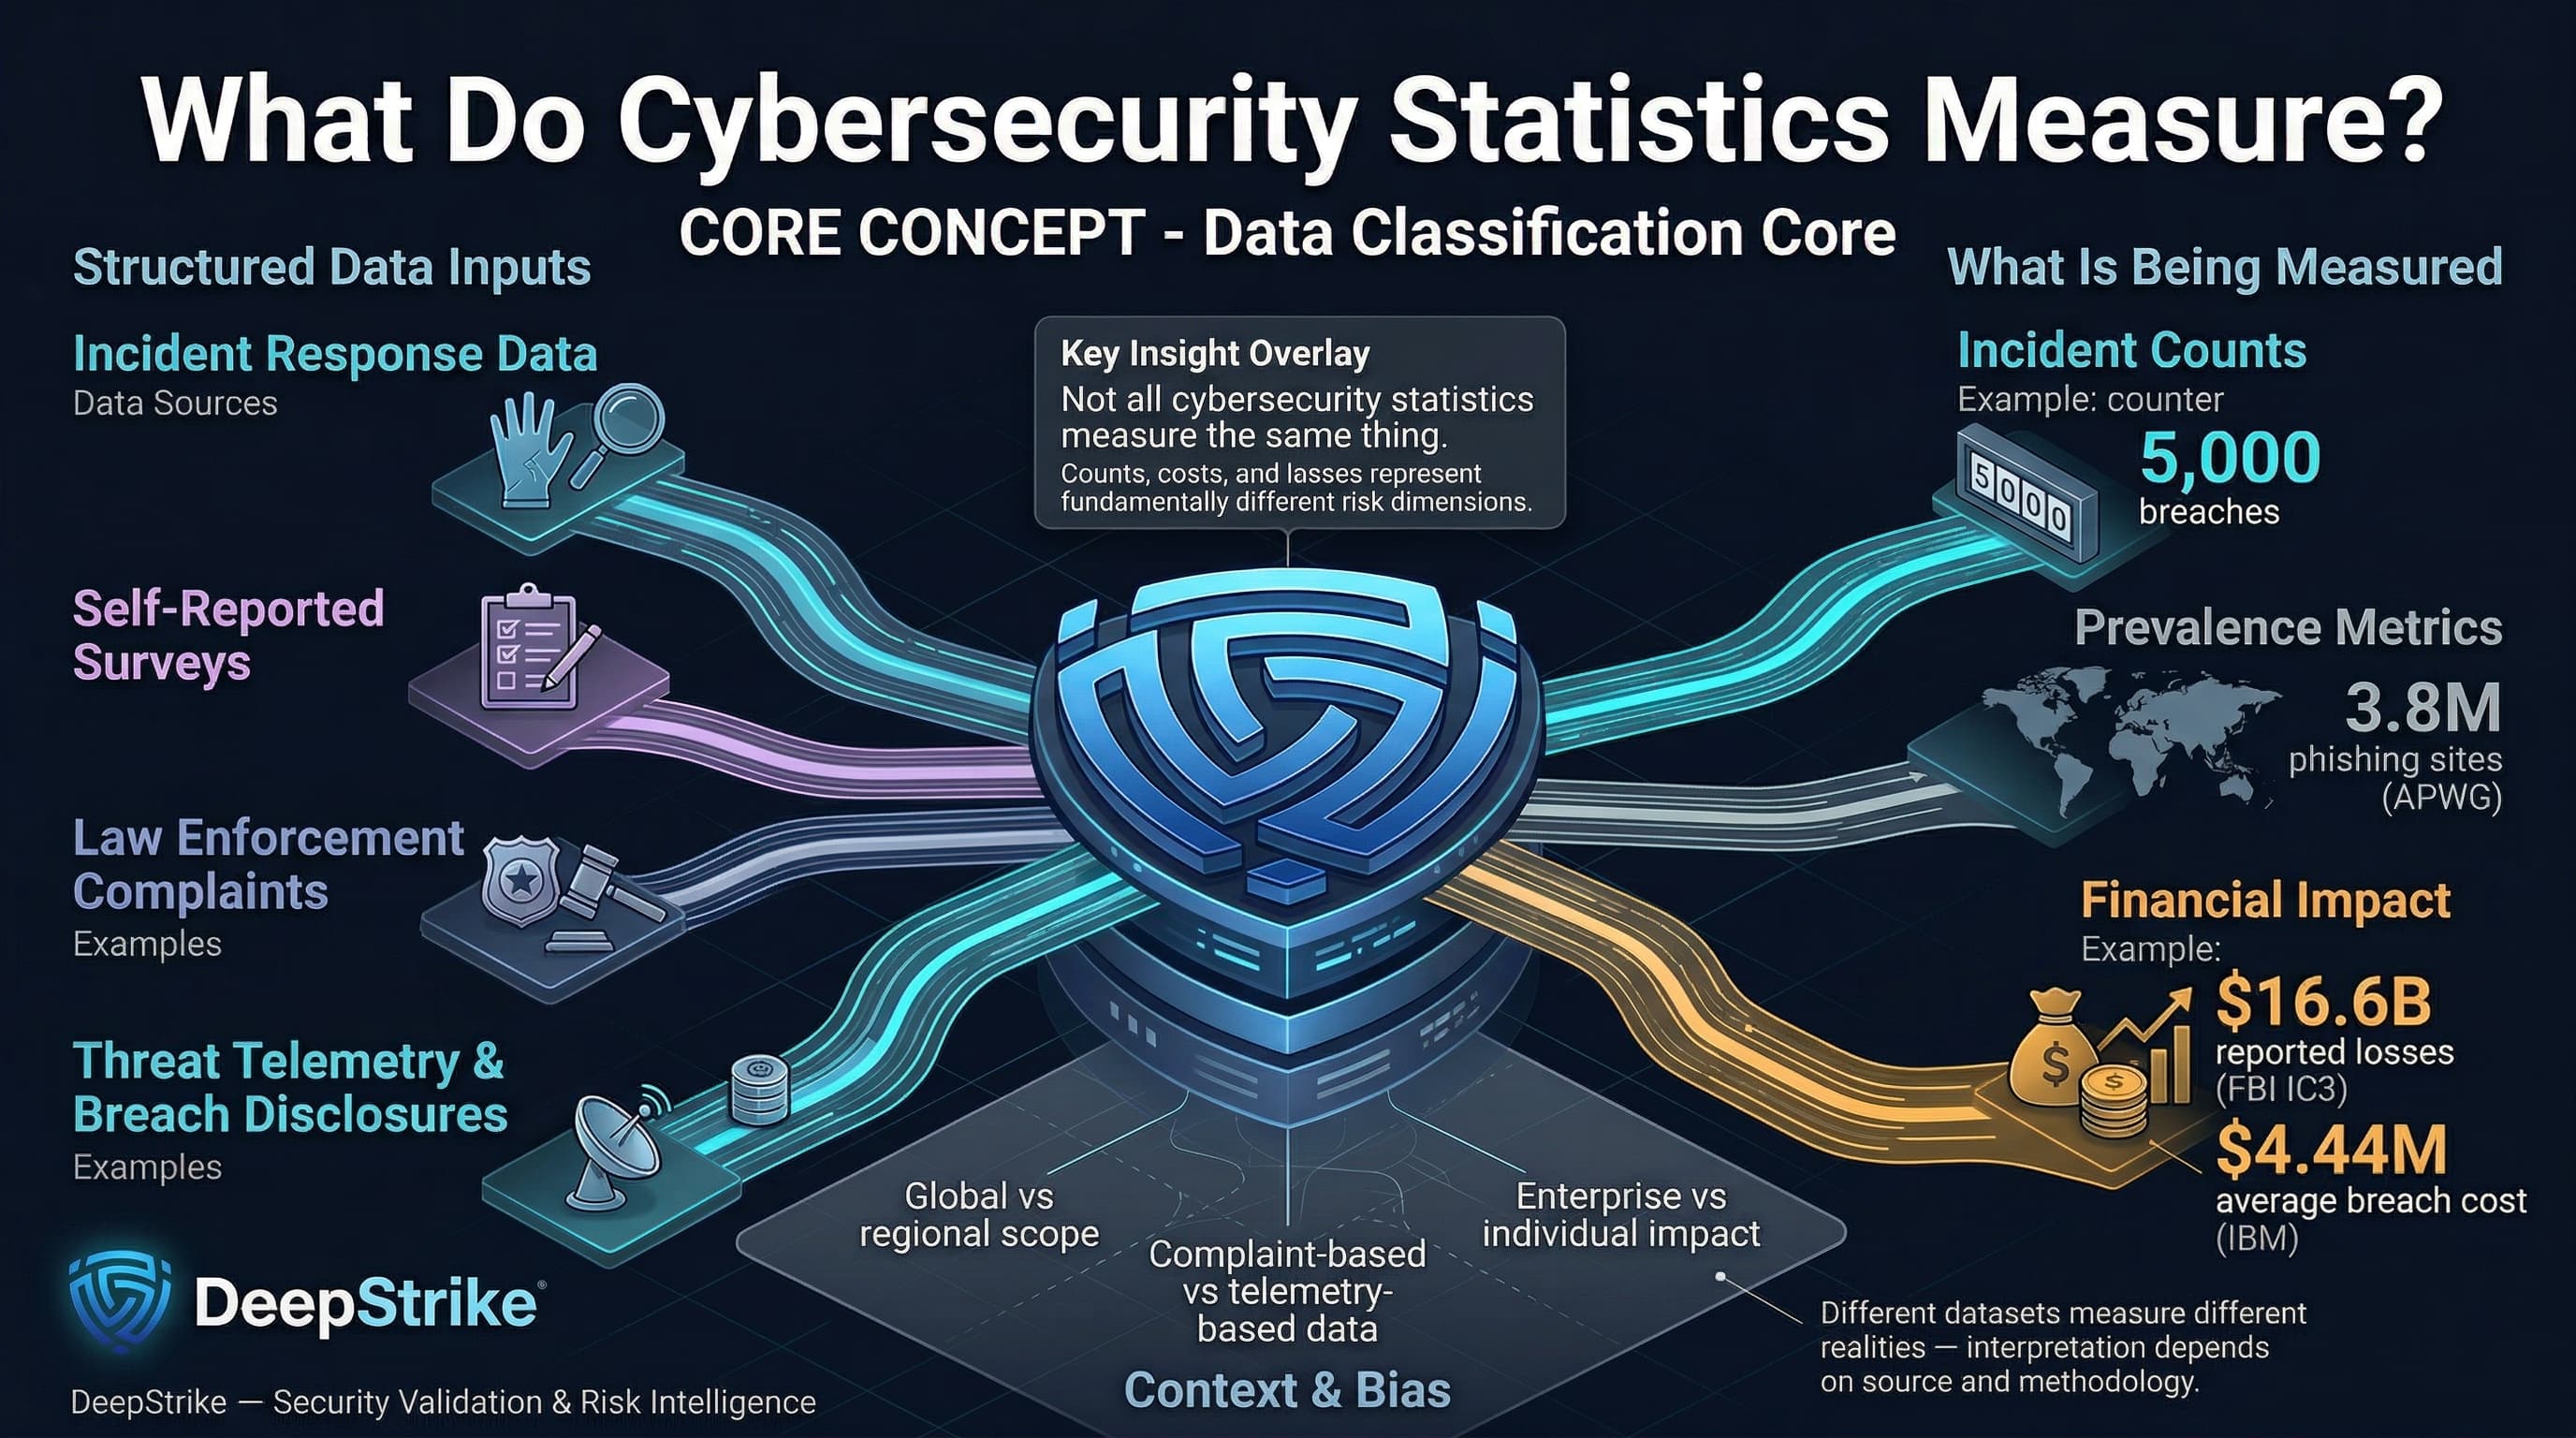
Cybersecurity metrics come from diverse sources: incident-response data, self-reported surveys, law enforcement complaints, threat telemetry, and breach disclosures. Statistics may count actual confirmed breaches, attack attempts, or successful intrusions. They may report total financial losses (e.g. extortion payments, theft, recovery costs), as in FBI IC3’s $16.6 billion cybercrime losses in 2024. Other stats measure prevalence (e.g. APWG’s 3.8 million phishing sites in 2025) or mean costs per incident (IBM’s average data breach cost of ~$4.44M in 2024). The data cover various populations: some numbers are global, some region-specific, some sector-specific. For example, APWG’s 3.8 million phishing “attacks” reflect unique reported sites worldwide, while IBM’s cost figure derives from vetted breach case studies across industries. A practical distinction: an incident count (e.g. “5,000 breaches this year”) differs from a cost average (e.g. “$4M per breach”), and from reported losses (e.g. “victims reported losing $16.6B to fraud”). Each measure—whether complaint-based, survey-based, or telemetry-based—has different scope and bias. Organizations should interpret them according to source: an FBI complaint count covers reported scams (often affecting individuals), whereas an incident-response cohort might highlight enterprise breaches. Understanding these differences is crucial for accurate risk assessment and resource planning.
The latest full-year datasets show a threat environment defined by higher incident volumes, sustained phishing pressure, expensive breaches, and continued growth in cybersecurity spending. FBI IC3 complaint data, APWG phishing volumes, ransomware incident counts, and IBM breach-cost figures all point to the same conclusion: organizations are facing more cyber risk, not less. At the same time, security budgets are rising in response, especially where boards are confronting regulatory pressure, cloud expansion, and identity-driven attack paths. This makes cybersecurity statistics useful not only as retrospective reporting, but as inputs for control prioritization, budget planning, and executive risk communication.
| Metric / Region | 2023 (Baseline) | 2024/2025 Actual/Proj | YoY Trend | Notes |
|---|---|---|---|---|
| FBI IC3 Complaints (Global) | 645,000 (2023) | 859,532 (2024) | +33% | 859k complaints in 2024; $16.6B losses |
| Ransomware Attacks (Global) | 5,631 (2024) | 7,419 (2025) | +32% | Confirmed attacks; US ~51% of total |
| Phishing Attacks (Global) | 3.76M (2024) | 3.80M (2025) | +1% | Unique phishing sites (APWG) |
| Avg. Breach Cost (Global) | Latest prior published figure: $4.88M | Latest published figure: $4.44M | -9% (stabilizing) | Data breach (IBM/Ponemon) |
| Avg. Breach Cost (US) | Latest prior published figure: $9.36M | Latest published figure: $10.22M | +9% (all-time high) | Regulatory fines, litigation drive rise |
| Cybersecurity Spend (Global) | $213B (2025E) | $240B (2026F) | +12.5% | Gartner forecast; includes all sectors |
| Identity Attacks (Daily) | 65T signals (2023) | 78T signals (2024) | +20% signal volume | Microsoft “security signals” (2024) |
| Dwell Time (median) | ~277 days (2023) | ~241 days (2023 report) | -13% | Mean time to identify+contain (IBM/Ponemon) |
| Ransomware Extortion (victims) | 7,200 incidents (2024) | 7,515 incidents (2025) | +4% | GuidePoint count (publicly claimed attacks) |
Table: Summary of global trends. Some metrics cover slightly differing years; see notes for sources.
Global trends reflect a more complex threat environment. Rapid adoption of cloud and remote work expanded the attack surface. Recorded cybercrime losses in 2024 already exceeded $16 billion, reinforcing that cyber risk remains a material economic issue for both enterprises and public institutions. Security budgets are rising accordingly, but expertise shortages temper defenses. The pace of attacks (e.g. record ransomware volume and blitz-scaled phishing) indicates not just more incidents, but faster, automated attacks, as reflected in accelerating metrics like IBM’s tightened breach-response times (identification within ~241 days when internally detected, versus 306 days with law enforcement).
Cyber incident costs should be read in layers rather than as a single number. Complaint-based losses, breach-cost studies, ransomware recovery costs, and sector-specific downtime estimates do not measure the same thing, but together they show how financial exposure accumulates. The latest published figures indicate that average breach costs remain materially high, especially in the United States and heavily regulated sectors, while ransomware continues to generate major recovery, legal, and operational expenses even when victims refuse payment. For leadership teams, the key takeaway is simple: cybersecurity costs are no longer limited to containment and forensics; they now include downtime, litigation, regulatory pressure, customer churn, and third-party fallout.
| Indicator | Value / Metric | Change YoY | Notes |
|---|---|---|---|
| Avg. Data Breach Cost (global) | Latest published figure: $4.44M | Down from prior published figure: $4.88M | IBM/Ponemon annual study |
| Avg. Data Breach Cost (US) | Latest published figure: $10.22M | Up from prior published figure: $9.36M | Regulatory fines, litigation |
| Median Time to Identify/Contain | Latest cited figure: 241 days (internal detection) | Lower than prior benchmarks | IBM/Ponemon cited dataset |
| Ransomware Recovery Cost | $1.53M (avg, excl. ransom) | -44% from previous | IBM report on extortion incidents |
| Ransomware Victims Refusing Pay | 63% | + (59% in 2024) | Rising resilience via backups, etc. |
| Reported Fraud Loss (IC3 2024) | $16.6B | +33% from 2023 | FBI IC3 (complaints basis) |
| Business Email Compromise (BEC) | $2.8B (2024 loss) | (FBI IC3) | IC3 U.S. reported losses in 2024 |
| Identity Fraud (Global losses) | $4.48B (2024, USA) | (FBI IC3) | IC3 personal data breach losses |
| Malicious Insider Breach Cost | $4.92M | - | IBM 2025 report |
Table: Key cost indicators.
Beyond direct losses, high-profile breaches cause customer churn, regulatory fines, and business interruption. For example, healthcare breaches often disrupt patient care (FBI reports 2,000 lost ambulance hours after one attack). Supply-chain attacks now average ~$4.91M per incident, reflecting regulatory fallout (e.g. NIS2 fines) and the complexity of remediation. Cyber insurance claims remain dominated by breach response and extortion, pressuring premiums despite market growth to ~$15B in 2025 (reportedly doubling to ~$29B by 2027). The trend toward zero trust and immutability (backups, firmware signing) has helped 63% of ransomware victims refuse payment, shifting attacker economics (GuidePoint data: more attacks but lower payouts).
Phishing remains the most pervasive initial attack vector. IBM’s breach data shows phishing present in 16% of breaches (the highest frequency among vectors). Attackers craft emails, SMS (“smishing”), voice calls, and even QR code links to steal credentials or deliver malware. APWG reports over 3.8 million unique phishing sites in 2025. Mobile-targeted techniques have surged: QR-code phishing (“quishing”) doubled to millions of incidents, often bypassing email filters (malicious links embedded in images). Business Email Compromise (BEC) is another high-impact social attack: wire transfer fraud soared +136% in late 2025 (APWG), with FBI IC3 citing $2.8B losses in 2024. Executive leadership and finance functions remain disproportionately targeted in phishing and business email compromise campaigns because of their access, authority, and payment workflows. The operational impact is severe: a single click can seed network takeover or credential theft. Thus, phishing-focused stats (volume, success rates, credential capture counts) directly inform defenses like email filtering, MFA, and user training.
Ransomware remains a top damage driver. Reported global incidents hit record levels: 7,419 attacks in 2025 (a 32% jump from 2024). Notably, 2025 saw the ecosystem fragment into many smaller RaaS operations (GuidePoint notes 124 active groups, +46% YoY). Despite volume growth, the business impact per incident is moderating: fewer victims are paying ransoms. The global average ransom payment has fallen (GuidePoint: median ~$115K in 2025 vs previous highs), and 63% of victims refused extortion. The cost of response and downtime remains high; IBM notes each extortion incident costs ~$5.08M on average (when disclosed by attackers). The industry witness points (e.g. Qilin group’s $40M+ hit on a UK lab) underscore the strategic risk to critical sectors (healthcare, industrial). Organizations use these stats to judge ROI on backups and incident response: knowing that aggressive restore capability saved many breaches underscores funding of immutable backup and IR planning.
Data breaches (unauthorized data exfiltration or leaks) continue at alarming scale. In 2025, tens of millions of records were confirmed lost. The Comparitech study counted ~59.2 million records in confirmed 2025 ransomware breaches (though this likely undercounts total exfiltration). Public breach compilations (ProvenData) estimate billions of credentials leaked across scams and intrusions. The scale of exposed credentials remains significant, and leaked password datasets continue to fuel credential stuffing, account takeover, and password-reuse attacks. Identity theft stats highlight the fallout: IC3 reports personal data breach losses of ~$4.48B in 2024 (USA) across fraud. High-value data (medical, financial) drives sector patterns: healthcare data fetches premium on black markets, boosting healthcare’s breach cost premiums. The cost of managing a breach (notification, credit monitoring, legal) averages $4.3–$4.9M. These statistics motivate investment in data discovery, encryption, and vendor risk management: each estimated cost per record or per breach helps quantify the risk reduction from controls like tokenization and third-party security audits.
Malware remains a common initial access or persistence tool, though often undetected amid “living off the land” techniques. Kaspersky detected ~500,000 malicious files per day in 2025 (a 7% increase from 2024). Key growth areas include information stealers (password stealers +59%, spyware +51% YoY). Malware stats help security teams measure baseline threat volume and plan coverage for endpoint protection. Not all intrusions involve a traditional malware dropper; many phishing- or RDP-enabled attacks leave no conventional binary artifact. Still, volume and type metrics inform control focus (e.g. scanning for known ransomware binaries vs. behavior-based detection). Major malware-related breaches (e.g. compromised supply chain updates) underscore the importance of integrity checking and robust patching, guided by vulnerability scan statistics and threat intelligence.
Modern cyber risk is now predominantly about identity and API abuse. As ~88% of enterprises use multi-cloud, and 70% of cloud breaches involve stolen or misused credentials, vulnerabilities in identity systems dominate. Microsoft reports attackers attempt ~600 million identity logins per day (largely password-based). Account compromises (phished or brute-forced credentials) are the most common breach vector in major studies. API abuse is likewise rising: exposed APIs in cloud services and shadow-IT facilitate data theft without malware. Statistics show misconfigurations and over-permissions in the cloud (95% of cloud breaches involve configuration/user error). These trends drive enterprise decisions on identity controls: e.g. deploying phishing-resistant MFA, conditional access, and comprehensive identity monitoring (CISOs use stats like ‘99% of identity attacks are password’ to justify zero-trust identity programs). They also prompt segmentation of cloud services and use of API gateway logs, informed by breach incident analyses highlighting API breaches (e.g. average attack took X hours via exposed API).
Security incidents often involve multiple steps, but data shows which initial vectors dominate and their relative impact:
| Vector / Method | % of Incidents or Usage | Avg. Impact / Cost | Notes |
|---|---|---|---|
| Phishing (email/SMS) | ~16–20% of breaches | ~$4.8M per breach | Most common vector; often leads to credential theft or initial compromise |
| Stolen Credentials | 22–27% of breaches (industry avg) | ~$4.6M per breach | Via reuse or leaks; high success for lateral moves (IBM data) |
| Exploited Vulnerabilities | ~40% of ransomware origin | Varies; can trigger widespread impact | Many public-facing apps have auth gaps; unfixed CVEs critical |
| Business Email Compromise | Complaints basis (FBI IC3: ~50k complaints) | Large wire transfers (~$48k avg request) | Social engineering targeting finance teams; rising losses (IC3) |
| Third-Party Compromise | 10–30% (supply chain) | ~$4.91M per incident | Growing threat; includes managed service or supplier breaches |
| Insider Misuse | ~4–7% of breaches (verizon) | ~$4.92M per breach | Includes malicious insiders (highest avg cost) and errors (~33% of breaches by misc error) |
| Misconfiguration (cloud) | 20–25% (CSPM findings) | High; data exposure | Data leaks (e.g. open S3 buckets) cause breaches |
Table: Attack vectors in modern incidents (figures indicative; based on industry reports).
Modern intrusions rarely depend on a single technique. In many cases, phishing, stolen credentials, exposed services, misconfigurations, and third-party access interact as part of the same attack path. That is why attack vector statistics should be used for prioritization rather than oversimplification. If phishing, credential theft, and vulnerability exploitation repeatedly appear near the top of incident data, those are the control areas most likely to reduce real enterprise risk.
| Industry | Exposure / Volume | Typical Impact (Avg. Cost / Outcome) | Key Notes |
|---|---|---|---|
| Healthcare | Very high | Highest breach cost ($10–$12M) | Life-critical downtime; patient data demand; 83% of medical devices outdated (info-tech vulnerabilities) |
| Finance/Banking | High | ~$5.9M (IBM 2023) | Top target for data theft and fraud; state-sponsored interest; focus on APIs and transactions |
| Manufacturing/OT | High | ~$4.56M (OT-specific) | Ransomware and IP theft (inc. blueprints); IoT/OT exploits; downtime costs $2–10M/day |
| Retail/E-commerce | High | ~$4.3M (IBM 2023) | Automated scraping (61% traffic), carding surges (+250%); public breaches erode consumer trust |
| Tech & Software | Moderate to high | ~$4–5M | Hacktivism and supply-chain focus; SaaS breaches ripple across customers |
| Public/Government | Moderate | ~$2–3M+ | Targeted for intelligence; regulatory/data sensitivity; often slower disclosure |
| Energy/Critical Infra. | Critical | Varied (inc. >$5M) | Nation-state sabotage risk; cascading outage potential |
| Education/Research | Growing | ~$4–6M | High data value (IP/credentials); often weak IT; remote learning attacks |
Industry exposure varies not only by data sensitivity, but by how costly downtime becomes once operations are disrupted. Healthcare, financial services, manufacturing, and critical infrastructure remain among the most consequential sectors because incidents in these environments create both technical loss and operational damage. For decision-makers, industry statistics are most useful when they guide resilience planning, sector-specific control priorities, and budget allocation.
| Region | Trend & Stats | Cost/Impact Indicator | Notes |
|---|---|---|---|
| North America | Concentration of spending and attacks: 29% of IBM IR cases (2025); FBI IC3 losses ~33% global | Highest breach costs (US avg ~$10.2M) | Strong cloud adoption, SaaS reliance; stringent regulations (higher fines) |
| Europe (EU/UK) | Intensifying regulation (NIS2, DORA); 81% plan budget increases for compliance | High reported breach costs, heavy fines (GDPR) | Mandatory disclosure; cross-border supply chains; often target for ransomware payouts (e.g. payment privacy) |
| Asia-Pacific | Rapidly rising attacks (manufacturing focus); less mature disclosure | Rising budgets (22% firms planning +10% increases) | Fast cloud adoption, expanding software development activity, and uneven regional maturity continue to shape risk across APAC. |
| Latin America, Middle East | Emerging markets face scaling cybercrime; low reporting transparency | Lower per-incident costs but increasing losses | Often underserved by security tools; expanding fintech use (faster payment fraud) |
| Africa | Underreporting; vulnerable critical infra | Indications of higher BEC/fraud attempts | Rapid mobile adoption leads to phishing spread; IoT growth but weak regulation |
| Global (All) | 70% of global spend by US+Europe; 89% enterprises multi-cloud | Cyber insurance ~$15B market (2024) | Regulatory shifts impose board liability worldwide; cross-region supply-chain risk |
Regional cyber risk is shaped by digital maturity, regulatory pressure, cloud adoption, and reporting transparency. North America remains the highest-cost environment, Europe is increasingly compliance-driven under DORA and NIS2, and APAC continues to expand its attack surface as digital transformation accelerates. For multinational organizations, regional statistics are most useful when they influence response readiness, supplier oversight, and geography-based investment decisions.
Generative AI is making phishing, business email compromise, and impersonation attacks faster to produce and harder to detect. The practical implication is not that every breach is now “AI-driven,” but that social engineering content is becoming cheaper, more scalable, and more convincing. Security teams should treat this as a multiplier on existing phishing and identity risk rather than a completely separate category.
Credential theft, password abuse, and identity misuse remain central to modern intrusions. The cited data already shows that phishing and stolen credentials remain major entry paths, while password-based attacks still dominate identity activity. This keeps phishing-resistant MFA, conditional access, session monitoring, and stronger IAM governance near the top of the priority list.
Cloud incidents are still heavily tied to identity misuse, misconfiguration, and excessive permissions. At the same time, third-party incidents continue to generate high cost and broad blast radius. This makes cloud governance, vendor assurance, and integration-level monitoring core parts of enterprise cyber risk management rather than secondary controls.
Breakout times and attacker speed continue to pressure defenders. Even where organizations improve prevention, slow detection and containment still increase impact. This is why more teams are prioritizing XDR, automation, and incident-readiness improvements alongside traditional preventive controls.
| Attribute | Cybersecurity Statistics | Data Breach Statistics | Cybercrime Statistics |
|---|---|---|---|
| Primary Focus | Enterprise security incidents, threats, controls, costs | Confirmed data exfiltration incidents | Total reported cyber crimes (fraud, hacks, scams) |
| Typical Metrics | Attack volumes, vector shares, time to detect/contain, cost per incident | Breach count, records exposed, disclosure time | Complaint count, reported losses (financial) |
| Financial Emphasis | Operational impact, remediation and downtime cost, insurance claims | Breach recovery cost, penalties, customer loss | Monetary fraud totals (IC3), ransomware payments |
| Data Sources | Vendor telemetry, surveys, incident responder databases | Breach reports, regulatory filings (e.g. GDPR notices), security vendors | Law enforcement reports (FBI, Europol), cyber insurance claims, surveys |
| Business Relevance | Holistic risk modeling (controls effectiveness, sector exposure) | Data protection focus, compliance, breach prevention | High-level crime trends, public awareness, general risk |
| Common Limitation | May mix reported+unreported events; vendor bias; not standardized | Underreporting bias (especially outside regulated sectors); focus on publicized breaches | Overlap of scams (some reported data theft vs fraud), includes personal victim losses |
Why the distinction matters: Cybersecurity stats provide a broad, integrated picture of technical threats and enterprise impact; they inform architecture and controls. Data breach stats alone (e.g. number of breaches, size of leaks) focus narrowly on incidents where data was taken or announced, often underestimating hidden compromise. Cybercrime stats (like IC3’s $16.6B) cover all online crime reported by individuals, emphasizing scale of fraud but diluting enterprise context. For strategic planning, CISOs and boards need the cybersecurity stats view: it includes insider risk, downtime, tool efficacy, and cross-sector comparisons. For example, knowing that 63% of ransomware victims paid nothing is actionable (improve resiliency), whereas knowing total cyber scams hit $16B raises general awareness but doesn’t direct specific controls. Both data breach and cybercrime figures can inform education and loss projections, but enterprise risk models rely on the integrated cybersecurity metrics that reflect the organization’s environment (cloud posture, identity management, etc.).
| Data signal | What it means | What to do |
|---|---|---|
| Phishing remains a top initial access vector | Email and identity are still high-risk entry points | Prioritize phishing-resistant MFA, email security, and user verification controls |
| Stolen credentials remain costly | Identity compromise drives both access and lateral movement | Strengthen IAM, monitor risky logins, and remove stale privileges |
| Breach costs remain high | Cyber risk is still financially material | Tie budget planning to breach-cost, downtime, and response-cost data |
| Cloud misuse and misconfiguration remain common | Cloud risk is governance-heavy, not just tooling-heavy | Improve CSPM, identity reviews, and cloud logging |
| Third-party incidents remain expensive | Vendor failures can materially expand exposure | Tighten vendor assurance, contractual controls, and integration monitoring |
| Faster attacks increase pressure on defenders | Slow detection increases impact | Invest in continuous monitoring, response workflows, and tabletop exercises |
Risk = Probability × Impact. Cybersecurity statistics inform both sides of this equation for scenario modeling:
Illustrative example:A mid-sized US bank models expected loss. Using Verizon and IBM data, they estimate a 20% annual chance of a breach (including attempted intrusions; based on industry peers) with an average cost of $6M (higher than the global average due to regulated data and liability). That yields a $1.2M expected yearly loss. If they implement an advanced AI-driven SOC, IBM stats suggest saving ~$2M per breach on detection and response costs. Even if the breach likelihood stays the same, the impact halves to ~$3M, cutting expected loss to $0.6M. This $0.6M annual saving justifies ~ $300K/year security investment (assuming 2:1 ROI). These models guide insurance (setting premiums on a justified loss estimate), budget (allocating % of expected loss to prevention), and board reporting (translating ‘X breaches per year’ into ‘$Y million risk’).
Cybersecurity statistics are quantified measures of cyber incidents, threat activity, attack methods, financial losses, and defensive outcomes. They help organizations understand risk using data rather than assumptions.
Not always. In most cases, the latest trustworthy figures come from the most recent complete 2024-2025 datasets, while 2026 numbers often reflect forecasts, directional trends, or early-year indicators.
The most useful metrics usually include breach cost, incident frequency, phishing and credential-abuse prevalence, time to detect and contain incidents, and sector-specific downtime impact. These are the figures most directly tied to budgeting and risk prioritization.
Healthcare, financial services, manufacturing, and critical infrastructure remain among the most exposed sectors because they combine valuable data, operational dependence, and high downtime cost.
Different sources measure different things. Law enforcement complaints, breach-cost studies, public incident databases, and vendor telemetry all capture different slices of cyber risk, so they should be compared carefully rather than treated as identical datasets.
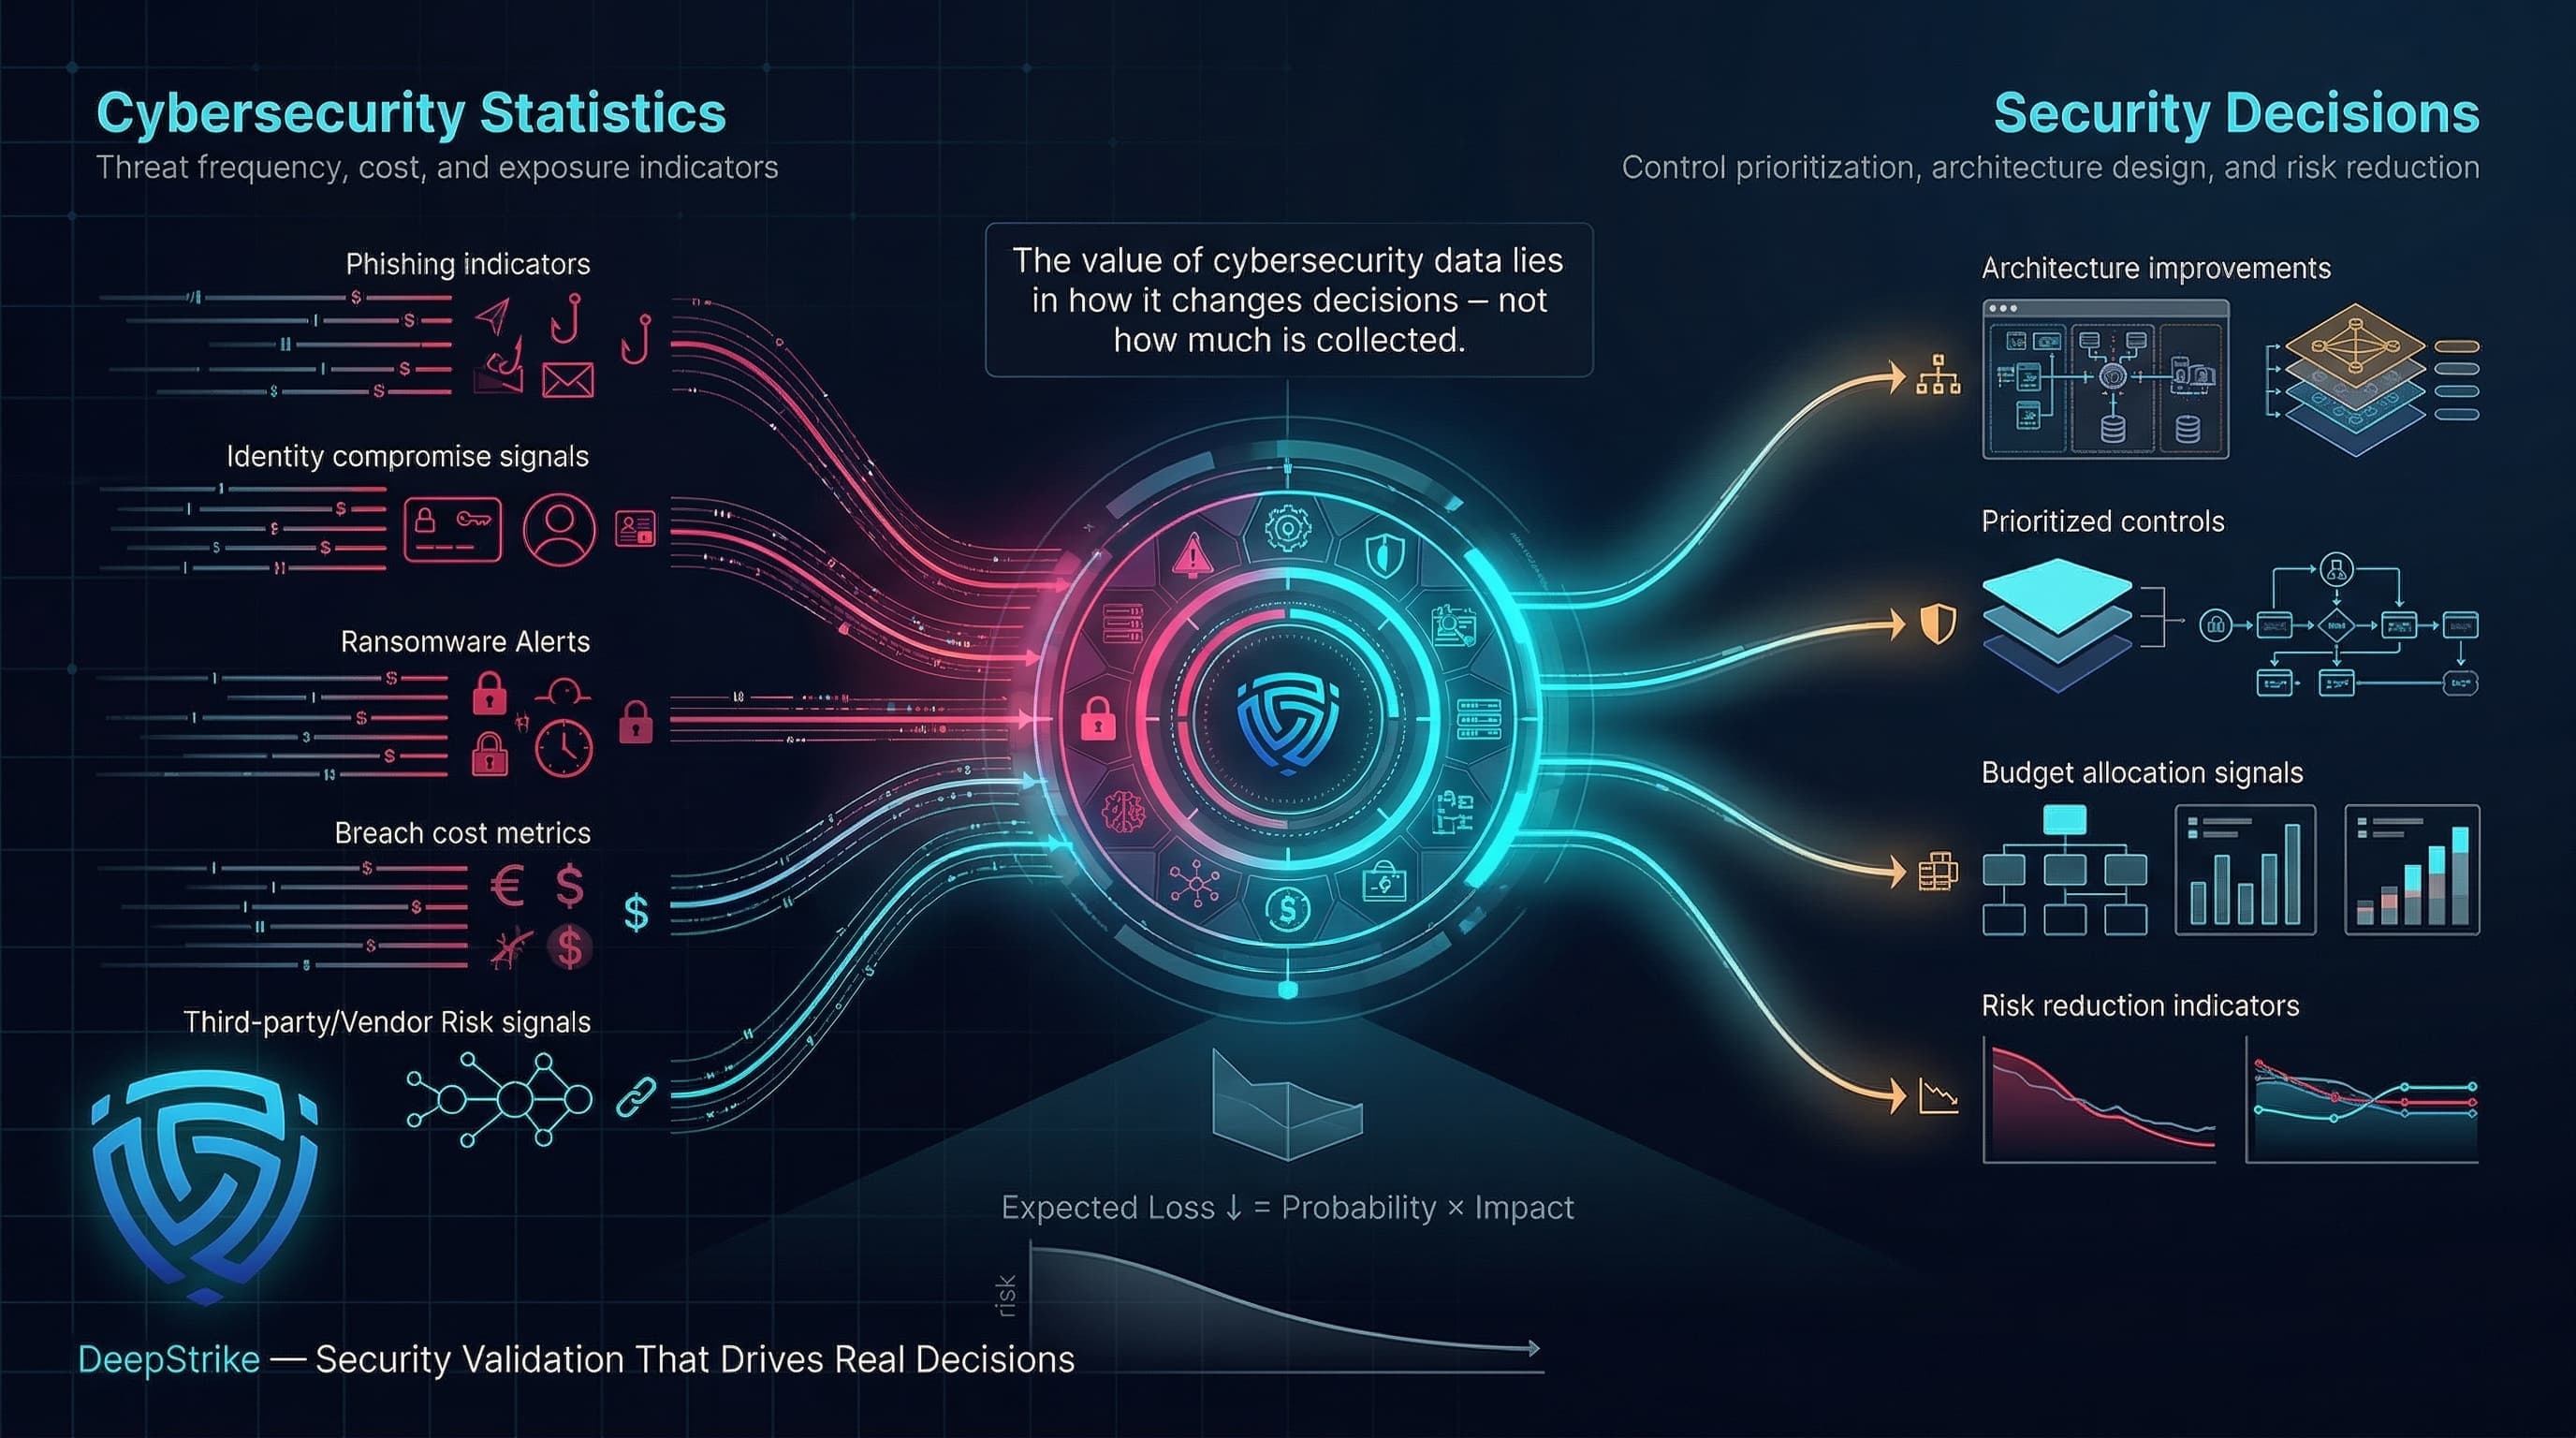
Cybersecurity statistics are most useful when they are translated into action. The latest data points to a threat environment shaped by persistent phishing, identity abuse, ransomware pressure, expensive breaches, and rising third-party risk. For security leaders, the goal is not to collect more numbers, but to use the right numbers to improve architecture, prioritize controls, justify budgets, and reduce expected loss. In that sense, cybersecurity statistics are not just reference points for 2026 - they are operating inputs for real security decisions.
Mohammed Khalil is a Cybersecurity Architect at DeepStrike, specializing in advanced penetration testing and offensive security operations. With certifications including CISSP, OSCP, and OSWE, he has led numerous red team engagements for Fortune 500 companies, focusing on cloud security, application vulnerabilities, and adversary emulation. His work involves dissecting complex attack chains and developing resilient defense strategies for clients in the finance, healthcare, and technology sectors.

Stay secure with DeepStrike penetration testing services. Reach out for a quote or customized technical proposal today
Contact Us