March 31, 2026
Updated: July 28, 2026
A data-driven look at third-party breaches, software dependency exposure, vendor risk, and the business impact of supply chain cyber incidents in 2026.
Mohammed Khalil
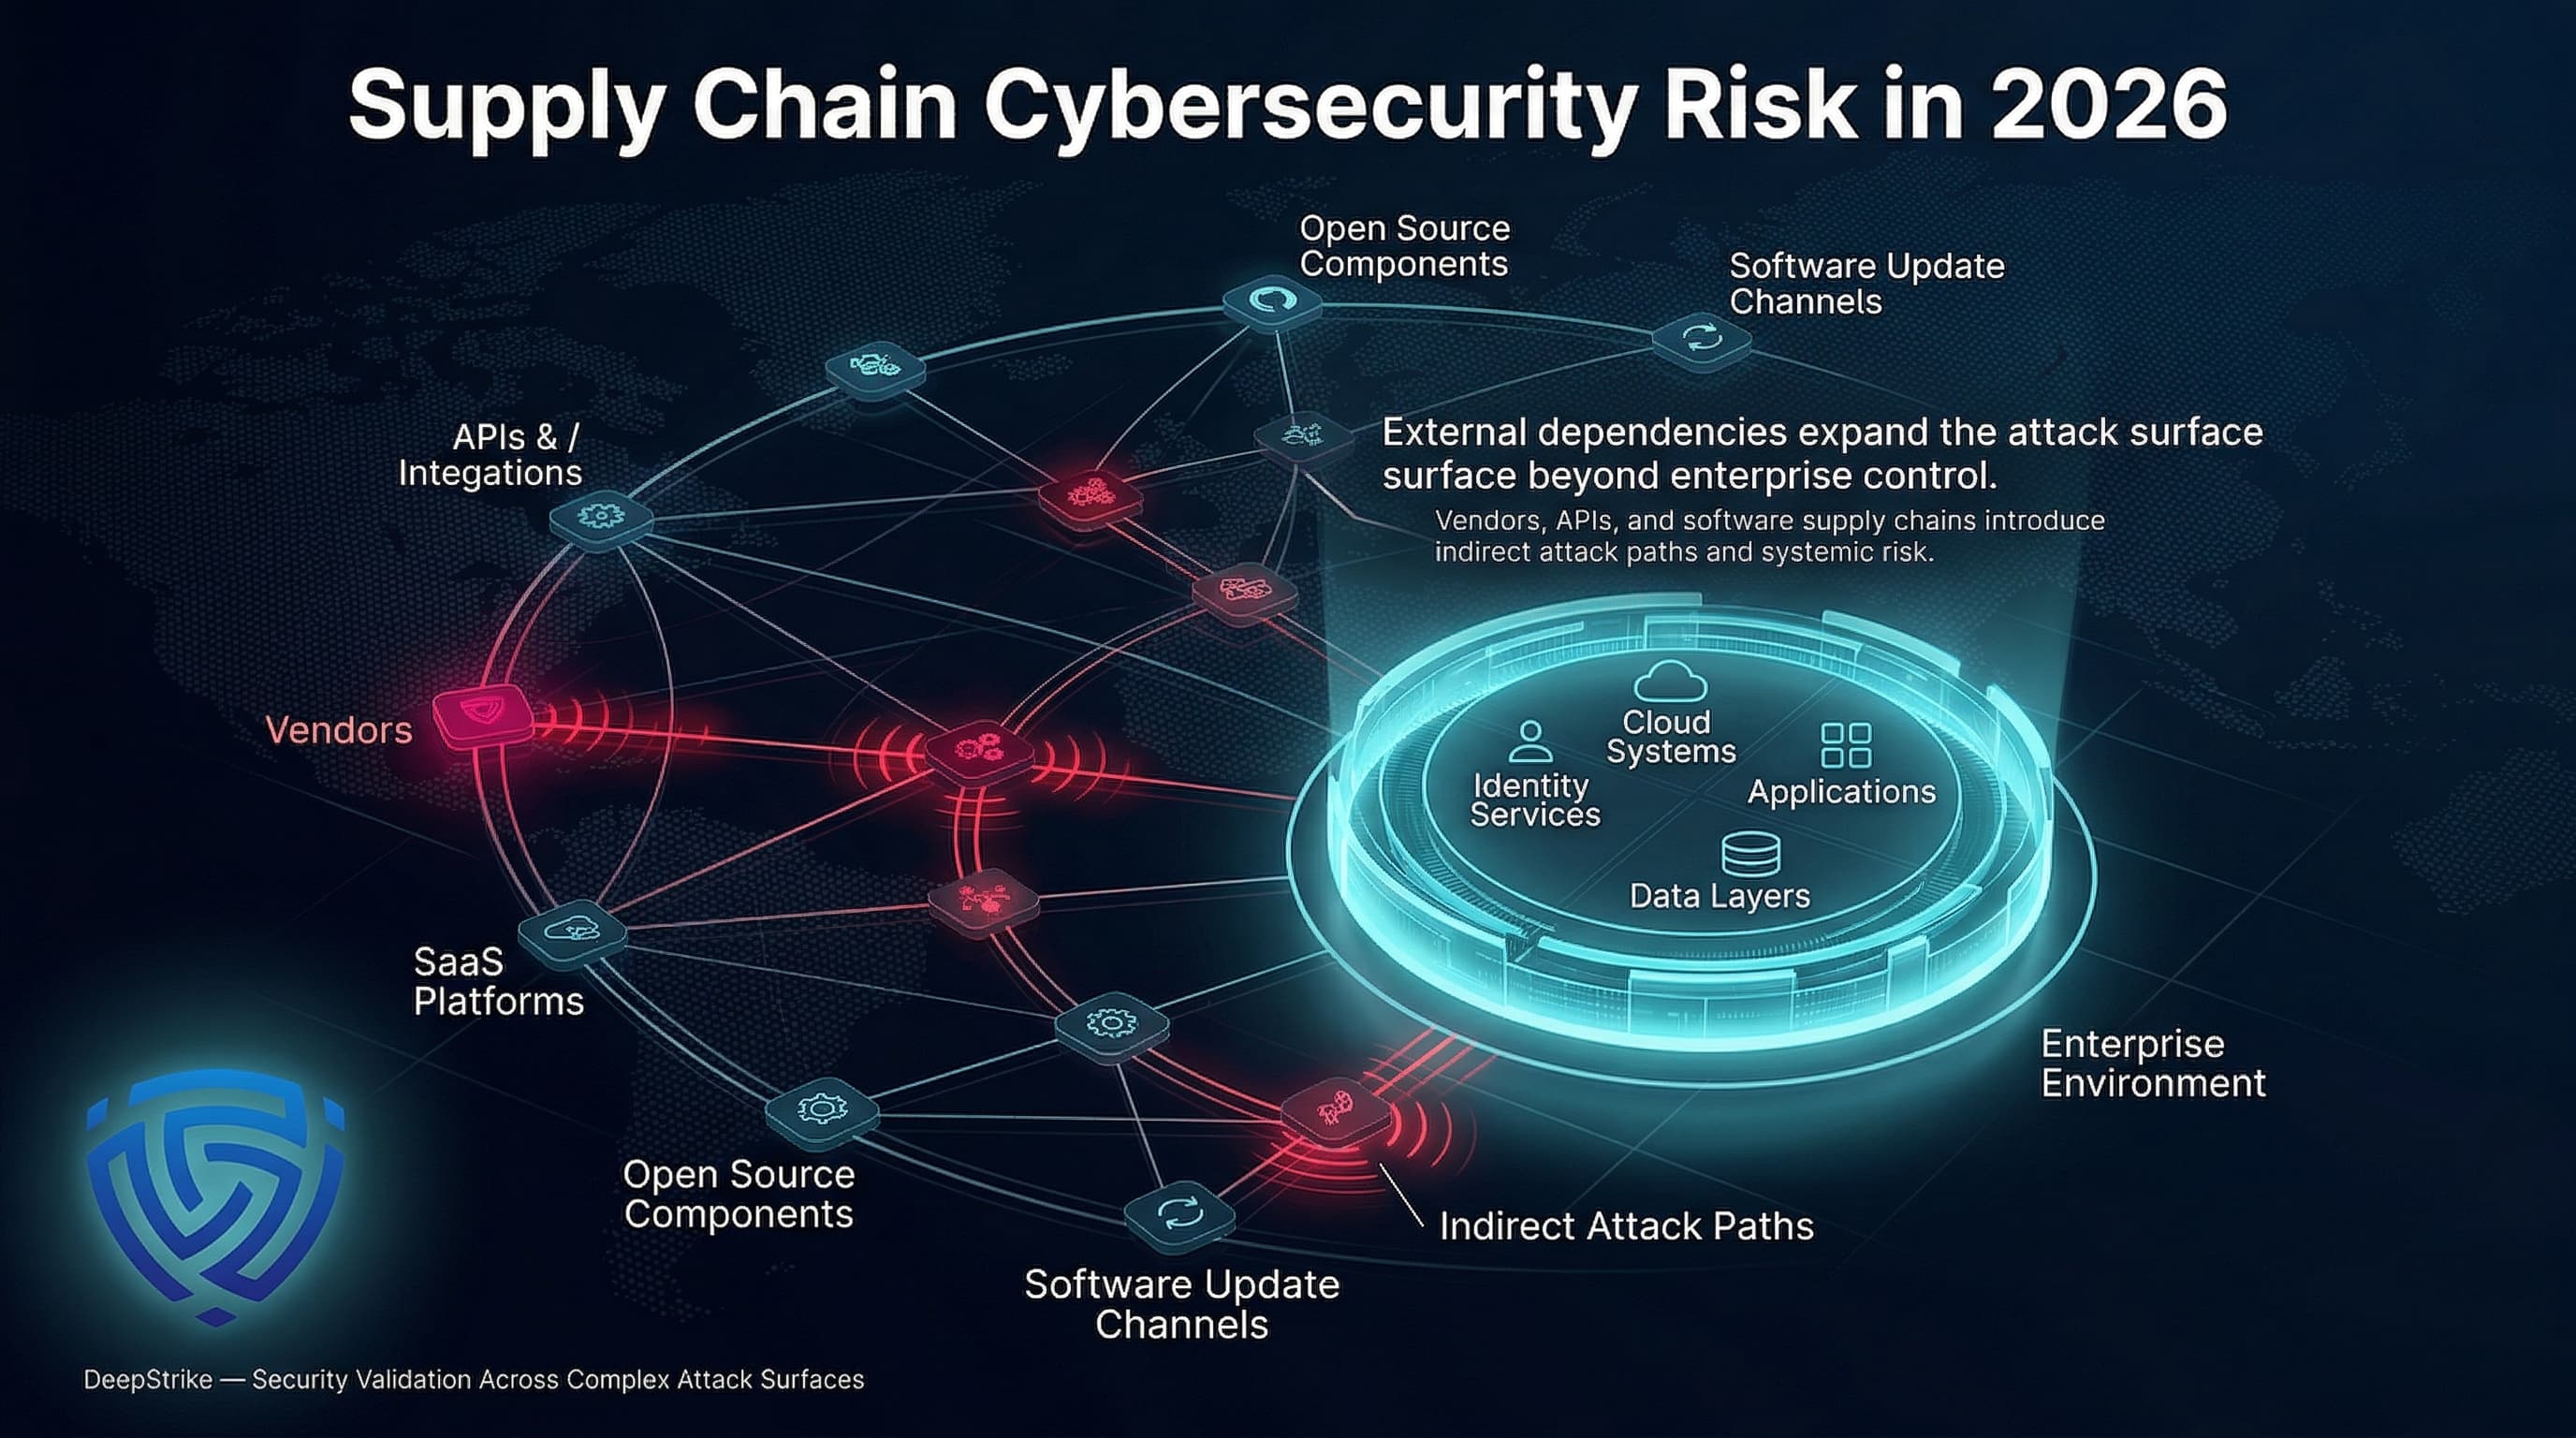
Supply chain cybersecurity statistics matter in 2026 because modern enterprises no longer defend only their own networks. They depend on vendors, service providers, cloud platforms, open-source components, APIs, and software update channels that can all become attack paths. The most useful statistics in this category do not merely count incidents; they help security leaders estimate dependency risk, prioritize supplier controls, improve procurement standards, and prepare for cascading business impact when an external dependency fails or is compromised.
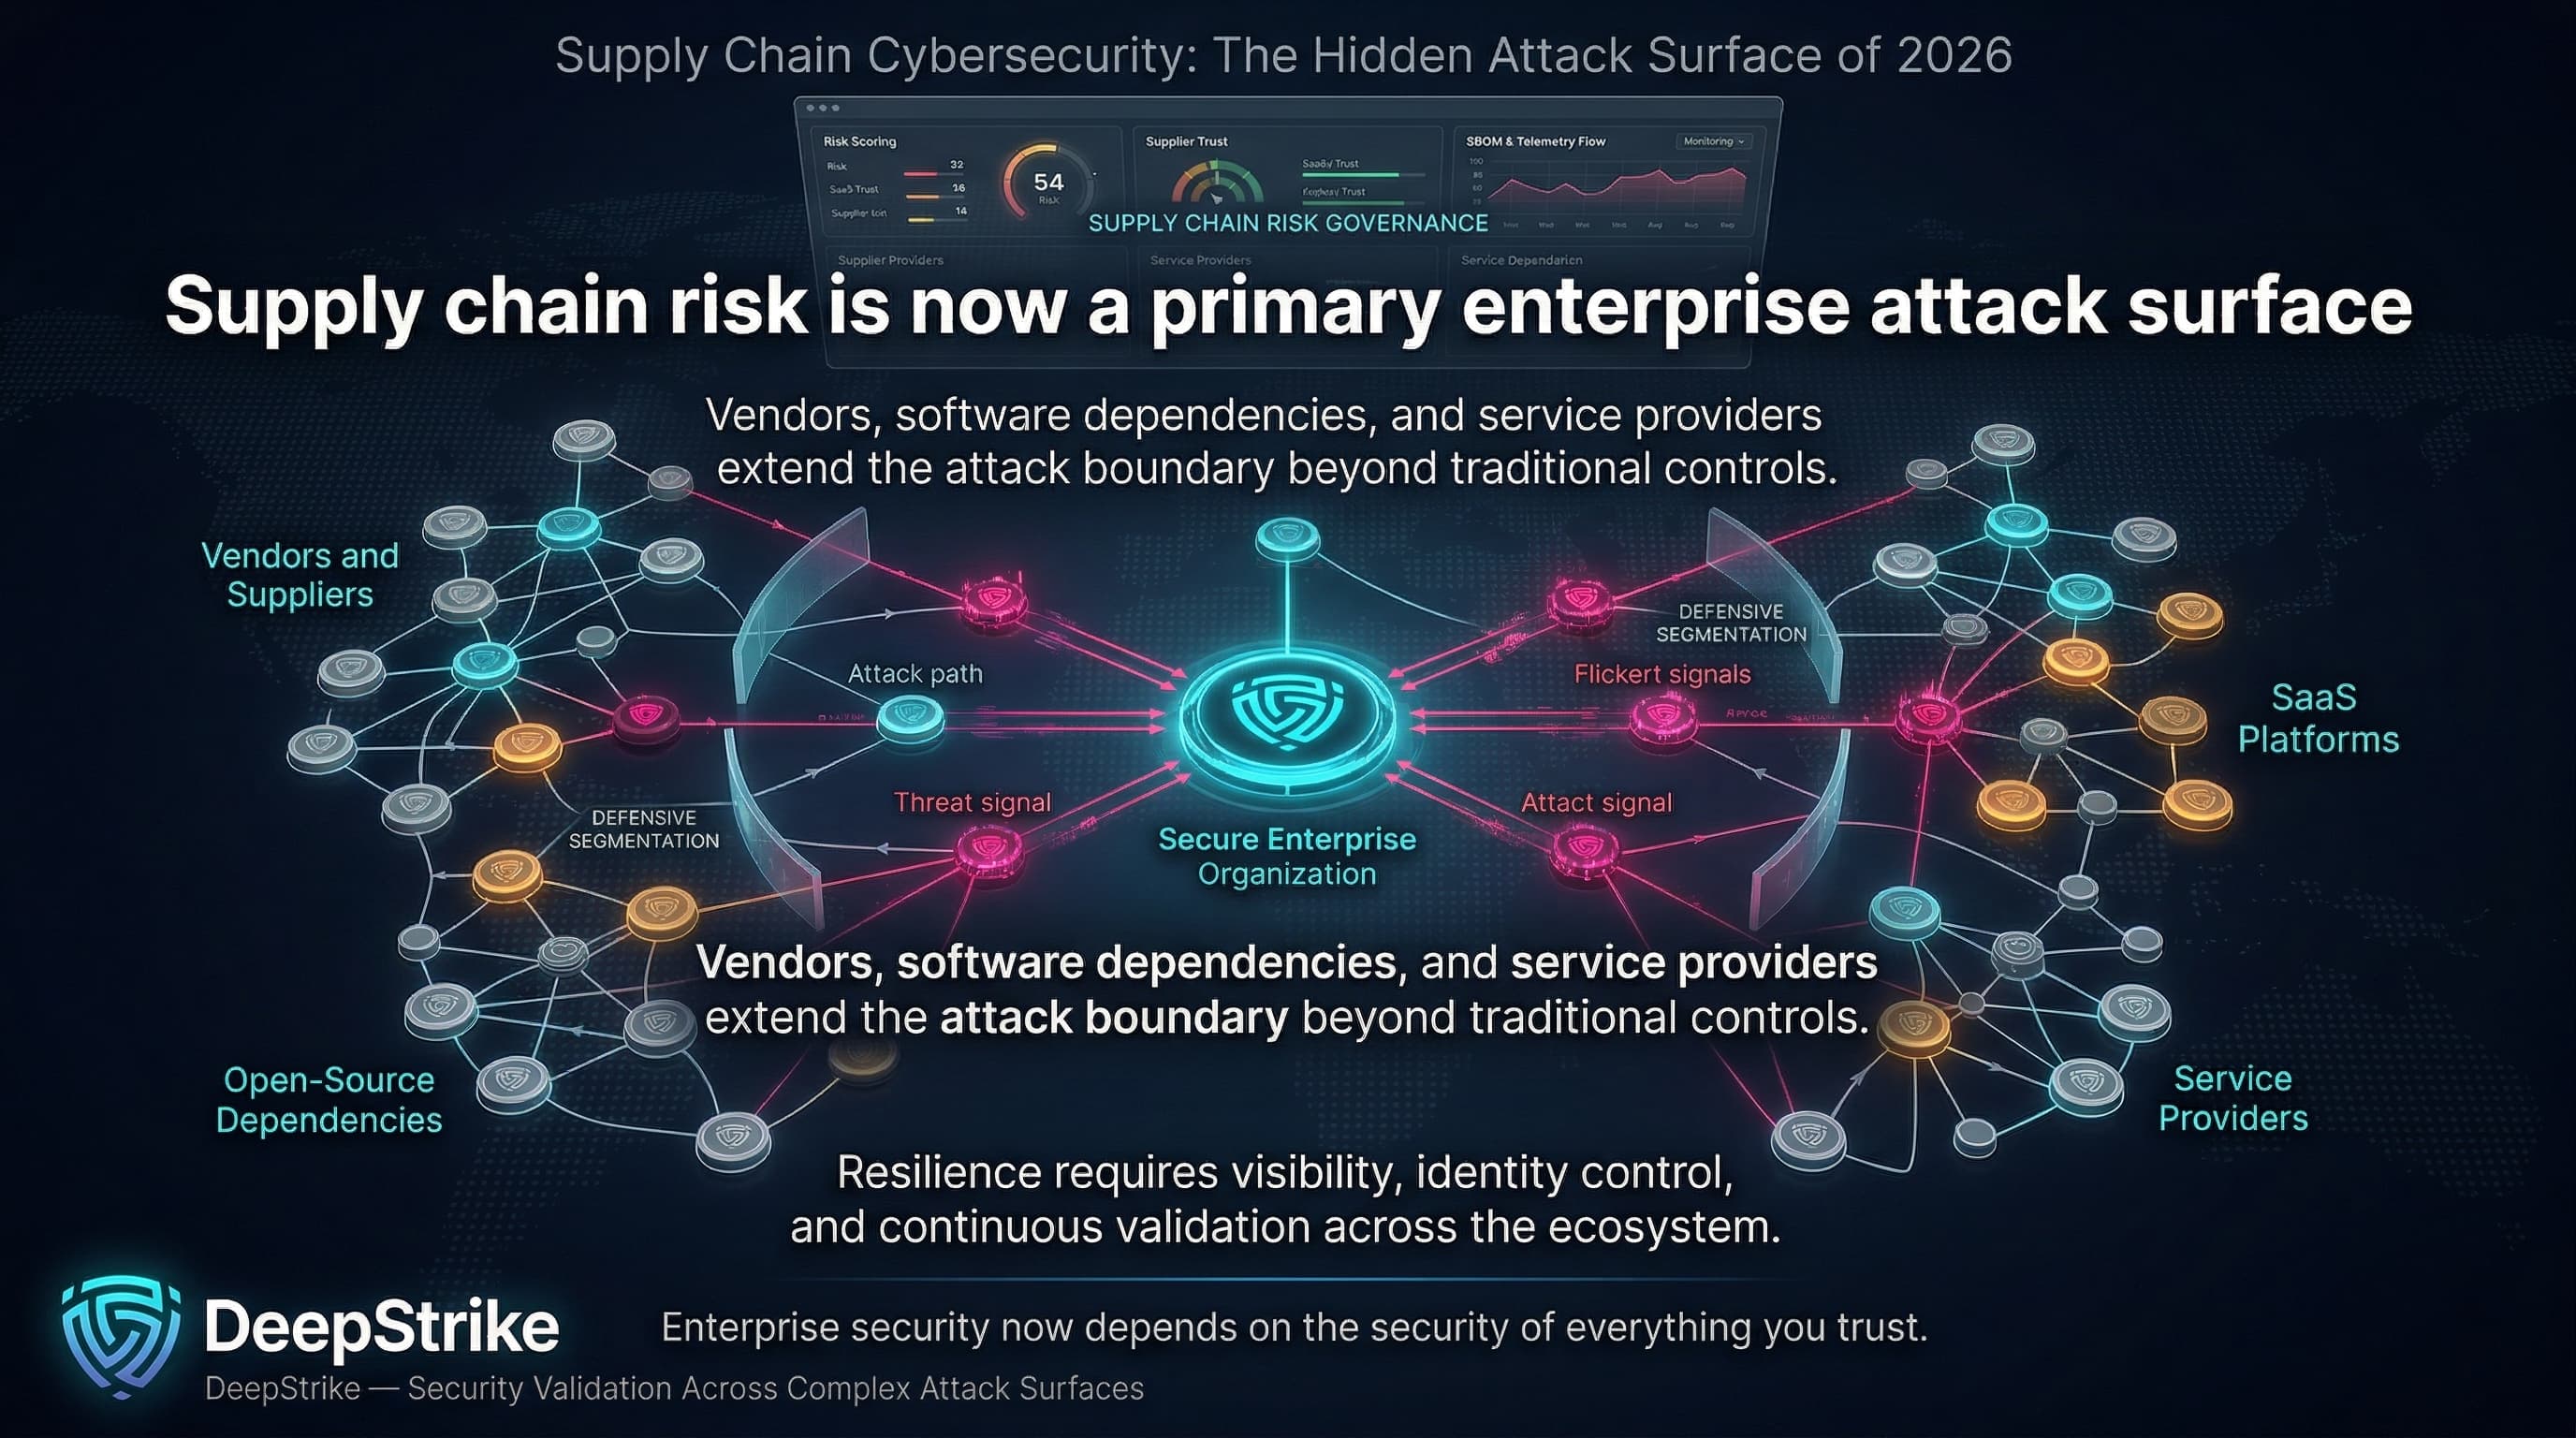
These supply chain security statistics combine incidents of vendor, product, and partner compromise with metrics like vulnerability counts and dependency exposures. For CISOs and risk leaders, they translate to concrete risks: nearly all enterprises rely on service providers (cloud, SaaS, managed services) and open source code, meaning a breach in a supplier or a flaw in a popular library can cascade widely. Today’s security architecture must account for both internal defenses and external dependency risk, including vendor compromise, open-source exposure, CI/CD trust, SaaS concentration, API integrations, and supplier credential abuse. These dimensions jointly shape corporate risk and resilience strategies for 2026 and beyond.
Supply chain security stats are now material for board-level decisions: they quantify the probability and impact of attacks flowing through all external dependencies, far beyond simple vendor questionnaires. In the sections below we review how these statistics are measured, what they currently indicate about global trends, and how they should influence architecture and governance to reduce risk.
Within broader cybersecurity statistics, supply chain cybersecurity statistics refer to quantified data about cyber risk introduced through suppliers, service providers, software dependencies, partner integrations, update mechanisms, and other external dependencies, including incident frequency, exposure patterns, attack methods, victim impact, industry concentration, and broader trends affecting enterprise resilience.
Supply chain cybersecurity statistics measure a broad set of indicators about risk arising from external dependencies. Key categories include:
These are not identical measures. For example, a report that “10,000 vulnerabilities found in open-source libraries last year” is a different signal than “20 public breaches of vendors occurred last quarter.” Disclosed third-party breaches (e.g. news of hack at a software company) reflect confirmed attacks, whereas dependency-scan stats (e.g. a binary analysis tool finding a vulnerable library in many codebases) reflect latent exposure. Vendor telemetry (like a security ratings firm tracking misconfigured services) is another type of dataset. Incident-response case studies (like SolarWinds or 3CX) illustrate vectors but are a small subset of the whole risk landscape.
Example Distinction: A software supply chain statistic might report “230 malicious npm packages were found in 2024,” which indicates a certain volume of infected code in the ecosystem. In contrast, a third-party incident statistic might be “47% of breaches involved compromised vendor accounts”, which speaks to attack prevalence from partner networks. A full breach report might say “Company X was breached via its firewall vendor, costing $5M,” capturing direct business impact. Each of these is meaningful in different ways: library infection counts measure defensive workload in development, while breach shares and losses measure operational risk and impact.
Supply chain security metrics should be interpreted carefully: not all dependencies or incidents are equal, so analysts distinguish whether figures come from scans of codebases, news of public incidents, survey results, or tools like SBOM aggregators. Yet by combining these indicators, enterprises can understand how likely a supply-chain compromise is and what it would do, informing procurement policies, architecture decisions, and resilience planning.
The table below summarizes key global trends from late 2023 through 2024. It highlights major shifts in third-party and software supply chain exposures:
| Metric | 2023 | 2024 | Trend | Notes |
|---|---|---|---|---|
| Orgs impacted by supply-chain breaches | 94% | 81% | Survey variation / still materially high | BlueVoyant survey: avg 3.7 breaches/org |
| Incidents involving third parties (Verizon DBIR) | 15% | ~30% | +100% (doubling) | Verizon DBIR saw share double year-over-year |
| Data breaches from third-party compromise | 29% | 35.5% | +6.5pp (rising) | SecurityScorecard global breach report |
| Downstream victims per breach | 2.56 | 5.28 | +3 (×2 increase) | Black Kite: more targets per incident |
| Average number of breaches per org | – | 3.7 | – | BlueVoyant: per org in past year |
BlueVoyant: per org in past year
These shifts reflect multiple forces. The doubling of third-party involvement (Verizon DBIR) corresponds to a surge in targeted supply-chain campaigns and better attribution. Some year-over-year shifts in survey-reported exposure should be interpreted cautiously. A lower share of organizations reporting a supply-chain breach in one survey does not necessarily mean supply-chain risk declined overall; it may also reflect survey design, respondent mix, or reporting scope. What remains consistent across datasets is that third-party involvement, downstream impact, and software dependency exposure continue to represent material enterprise risk.
The SecurityScorecard metric (29%→35.5%) specifically tracks publicly reported breaches, suggesting more disclosures and attention on supply-chain origins. Meanwhile, the Black Kite finding (average 5.28 downstream victims) underscores that supply-chain breaches ripple further (e.g. an MSP compromise hitting dozens of clients). All of this signals a multi-year upward trend in supply-chain risk that enterprises must plan for.
Supply-chain attacks often incur multidimensional costs. Businesses face recovery expenses, downtime, loss of sales, and reputational damage. Survey data illustrate these impacts clearly:
| Indicator | Value (2024) | Change YoY | Notes |
|---|---|---|---|
| Organizations with supply-chain breach (BlueVoyant) | 81% (down from 94%) | –13pp | Avg. 3.7 breaches/org; multi-year trend |
| Avg. # of supply-chain breaches per org (BlueVoyant) | 3.7 | – | |
| Recovery costs reported after breach | 57% | – | % of firms citing financial recovery expense |
| Production downtime experienced | 53% | – | % of firms citing operational outage |
| Revenue loss experienced | 48% | – | % of firms citing lost sales/revenue |
| Reputational damage reported | 46% | – | % of firms citing PR/brand impact |
| Healthcare orgs with supply-chain breach | 87% | – | Highest sector exposure (healthcare) |
These metrics clarify that over half of victimized organizations incur serious operational costs. For example, in one survey 53% of companies whose supply chain was attacked reported production downtime, and 48% lost revenue as a direct result. Separately, BlueVoyant’s study indicates that 81% of organizations saw a breach affecting their supply chain in the past year, with an average of 3.7 such breaches per org. Healthcare providers appear particularly exposed: 87% reported such breaches, likely due to their complex ecosystems of devices and partners.
Importantly, these costs are additive and cascading. A single supplier outage can halt multiple production lines downstream. Recovery often requires both technical remediation and contractual/business interruptions. The high percentages of firms citing financial impacts (57% noting recovery costs) and reputational fallout (46%) show supply-chain breaches can inflict year-long damages. These statistics help justify stronger investment. When repeated supplier incidents generate recovery expense, downtime, lost revenue, and reputational harm, the cumulative business impact becomes large enough to justify stronger third-party risk management, resilience controls, and incident readiness.
Supply chain cyber risk breaks down into several interlocking categories. Each category represents a distinct operational vector:
Attacks here begin with a supplier or service provider compromise. Examples include hacking a cloud-hosting company or MSP so that the adversary gains access to all its clients. The risk lies in shared credentials, network trust, and lack of vendor visibility. Data show this is a leading source of incidents: Black Kite found 47% of third-party breaches stemmed from unauthorized network access (which often reflects stolen or misused vendor credentials). For instance, a corporate VPN credential leaked from one vendor can be used to infiltrate dozens of connected customers. These breaches can also involve physical access by a vendor’s insider. In 2023–24, high-profile incidents like the breach of patient-portal software or managed services firms illustrate this chain reaction.
This category covers attacks on code libraries, build systems, and package repositories that enter the enterprise via software dependencies. Attackers plant malicious code in widely-used components (npm packages, Python modules, container images) or infiltrate build tools (e.g. compromising CI/CD pipelines or code-signing keys). The Sonatype report highlights this vector: supply-chain attacks on open-source modules have spiked (attacks doubled in 2024). Consequences here include developers inadvertently pulling malware into their applications. For example, the discovery of malicious npm packages (“warbeast2000”/“kodiak2k”) in early 2024 affected hundreds of developers. Similarly, the SolarWinds and Log4j incidents are software-supply-chain breaches with massive enterprise fallout. Operationally, this category matters because vulnerabilities or subversion deep in code can go undetected by normal perimeter defenses, allowing attackers to bypass traditional network gates.
Enterprises rely on cloud services and APIs today, which concentrates risk in key vendors. A compromised cloud application or exposed API credential can spill over to multiple tenants. While specific statistics are limited, incidents like the Google Cloud outage of 2023 (impacting customers of CrowdStrike and other SaaS) underscore how one provider failure can affect many clients. Another example: a breach of a popular identity provider (IdP) could potentially expose all connected corporate applications. Attack paths include compromised API keys, misconfigured multi-tenant services, or man-in-the-middle of inter-service calls. The concentration of critical infrastructure in a few providers means these risks are systemic.
Some breaches exploit legitimate access granted to vendors (e.g. remote maintenance accounts, federated login). This includes cases where attackers steal a vendor’s service account tokens or engineer support-channel breaches. Statistics hint at this: Black Kite reported that 62% of critical suppliers had corporate credentials exposed in malware-stealer logs, highlighting how attacker-controlled vendor credentials are readily available. In practice, a shared administrative account or insecure partner VPN can become a pivot point. Mitigating this category involves strict vendor access controls, multi-factor for vendor logins, and careful auditing of external identities. Operationally, failures here can allow adversaries to “live off the land” using trusted accounts, making detection harder.
Hardware or firmware attacks on supply chains (e.g. malicious firmware in routers or compromised ASICs) are rarer but increasingly considered. A notable example outside enterprise IT: the 2018 Supermicro motherboards case (where US intelligence claimed Chinese spies implanted chips) showed how deep supply-chain insertions can subvert systems. In enterprise contexts, concerns include tainted development boards, insecure IoT devices, or malicious BIOS updates in servers. While such attacks are less frequent, their impact is often more severe (you can’t patch your hardware easily). Though we have few formal statistics on firmware supply-chain attacks, organizations should nonetheless consider this risk in critical infrastructure procurement (e.g., using trusted manufacturing sources and hardware attestation).
Attackers often combine supply-chain vectors with traditional techniques. The distribution of recent third-party supply-chain incidents (Black Kite data) is shown below:
| Attack Vector / Pathway | Share of Incidents | Avg Impact / Cost | Notes |
|---|---|---|---|
| Unauthorized Network Access (vendor accounts, service connections) | 47.06% | High (broad system intrusion) | Includes stolen vendor credentials (T1078) |
| Ransomware (spread via a supplier) | 13.24% | Very high (immediate downtime, extortion) | Disrupts operations across client base |
| Stolen Credentials (supply-chain context) | 6.62% | High (enables further intrusion) | Often from phishing or account theft |
| Exploitation of Software Vulnerability | 5.15% | High (can lead to large breach) | E.g. unpatched web or library (T1190) |
| Phishing & Social Engineering (targeting vendors) | 3.68% | Moderate to High | Initial access via tricking supply personnel |
| Insider / Unauthorized Physical Access | 5.88% | Varies | Rogue employee or contractor incidents |
Notes: These categories map to MITRE ATT&CK tactics. For example, Unauthorized Access corresponds to Valid Accounts (T1078) and lateral movement. Exploitation maps to Exploit Public-Facing Apps (T1190). Ransomware can involve multiple stages (initial access plus deployment).
In practice, a modern supply-chain attack might start with code compromise (software vulnerability in a library), then move via valid accounts or tokens to customer systems, install ransomware (impacting financials), and even use phishing to maintain persistence. The high share for unauthorized access (47%) means credential hygiene is crucial once attackers have a supplier login, they can often reach deep. Ransomware’s 13% share in third-party incidents highlights the business-focused nature of these attacks: adversaries know that disrupting vendors’ clients is lucrative.
Overall, these breakdowns show that identity and credential misuse are central themes: accounts and access granted to vendors are common stepping stones in many breaches. They also underscore that software updates (vulnerability exploits) remain a viable entry point, motivating careful patching and code-signing verification.
Supply-chain risk is not uniform across sectors. The table below highlights relative exposure across key industries.
| Industry | Exposure Level | Typical Impact Pattern | Key Notes |
|---|---|---|---|
| Healthcare | Very High | Data theft, operational disruption | 87% report supply-chain breaches; numerous connected devices and legacy systems. |
| Finance | Moderate | Fraud, data exfiltration | Tends to have more secure vendors (only 43% had critical flaws); large financial APIs. |
| Technology/Software | High | IP theft, wide distribution of malware | Heavy use of open-source; breaches often propagate via widely-used code/components. |
| Manufacturing | High | Production downtime, IP/data loss | Complex outsourcing (OT, machines); ransomware (e.g., via MSP) can halt factories. |
| Retail/E-commerce | Moderate | POS/data breaches, supply disruptions | Mixed reliance on IT vendors; focused on point-of-sale systems and inventory management. |
| Government/Public Sector | High | Data loss, service outages | Many outdated systems; 68% of govt. suppliers had critical vulnerabilities. Often lag security investments. |
Industries differ for several reasons. Healthcare organizations have extensive third-party connections (EMR vendors, medical IoT providers) and typically fall behind in patching, making them highly exposed. Financial institutions invest heavily in supplier security, so their ecosystem shows fewer weak points (finance vendors had the best risk rating in one study). Tech companies see high exposure via software; a compromised library or container image can instantly affect millions of devices. Manufacturers face risk both from ICT and OT vendors supply-chain attacks can force plant shutdowns. Retailers manage complex logistics networks, so a compromised logistics partner or point-of-sale vendor can have direct sales impact. Public-sector entities often use older infrastructure and large vendor networks, reflected by their suppliers’ high vulnerability rates, putting them at severe risk. Understanding these industry nuances helps prioritize controls: e.g. healthcare firms might double down on device and medical software supply validation, while fintechs might focus on vendor credential auditing.
Geographic patterns in supply-chain cyber risk are influenced by disclosure rules, supplier concentration, cloud adoption, manufacturing density, and regional software ecosystems. North America tends to dominate public breach visibility because of both vendor concentration and stronger reporting visibility. Europe is increasingly shaped by compliance-led supplier governance, especially where resilience, reporting, and vendor accountability are becoming regulatory expectations. Asia-Pacific remains strategically important because of its role in manufacturing, software development, and logistics concentration. Regional comparisons should therefore be treated as directional rather than perfectly comparable, since visibility and disclosure practices vary substantially by market.
The most useful incident examples are those that clearly illustrate distinct supply-chain pathways rather than simply adding volume. The three cases below show how attacker-controlled updates, open-source component compromise, and third-party service abuse can each create downstream enterprise exposure.
Each of these examples involved a supply-chain pathway (software update channels, open-source repos, or third-party services) and had severe operational impact. They reinforce that the threat is real and rapidly evolving. Organizations should study these cases to understand attacker TTPs (e.g. targeting trusted update sources or abusing central libraries) and to harden their incident detection for similar patterns.
Several emerging trends, backed by recent analyses, are reshaping supply-chain security:
Overall, the trajectory is clear: supply chain security is becoming more automated and data-driven on both offense and defense. Attackers will exploit any external weakness at scale, while enterprises will lean on analytics, regulations, and cross-industry collaboration to manage the flood of supply-chain risk signals.
| Attribute | Supply Chain Cybersecurity Statistics | Third-Party Risk Statistics | Software Supply Chain Statistics |
|---|---|---|---|
| Primary Focus | Entire ecosystem of external dependencies: suppliers, contractors, partners, software libraries, hardware, etc. | Security posture and incidents involving business partners, vendors, and managed services. | Security of software components & development pipelines. |
| Typical Metrics | % of incidents via suppliers, average downstream victims, vendor vulnerability rates, supply-chain incident counts, SBOM coverage, business interruption metrics. | % organizations with vendor breaches, vendor audit findings, vendor control scores, compliance survey results. | Number of software vulnerabilities in dependencies, malicious package counts, build pipeline compromises, SBOM counts. |
| Common Data Sources | Incident reports, industry breach databases (e.g. DBIR), supply-chain breach studies (SecurityScorecard, Black Kite), SBOM repositories, vendor scans, patch data. | Vendor risk assessments, third-party breach disclosures, supply-chain attack reports, questionnaires, security ratings. | Code repository analyses (e.g. GitHub alerts), package registry monitors, vulnerability databases (NVD), Sonatype/Snyk type reports. |
| Business Relevance | Shows overall operational risk exposure and needed resilience (e.g. how many suppliers can knock your business offline). Guides enterprise strategy (diversification, insurance, architecture segmentation). | Guides vendor management: due diligence, contract terms, audits, insurance clauses. Impacts procurement and SOC teams monitoring. | Guides development and devops: securing CI/CD pipelines, dependency governance, licensing/compliance. Primarily for CTO/CISO teams in development. |
| Main Limitation | Very broad and heterogeneous; combining non-comparable data (e.g. a stolen supplier credential vs a leaked software key). Can be hard to aggregate into one risk score without context. | Often self-reported or based on disclosed breaches; may undercount issues in private vendors. Focuses on people/process controls. | May overcount issues (vulnerability “noise”) without representing actual threat exploitation. Tied closely to development lifecycle. |
Supply chain, third-party, and software supply chain statistics overlap but emphasize different slices of the problem. Supply chain stats cover the whole spectrum of external risk. Third-party statistics focus on service providers and managed relationships (often measured by survey or breach shares). Software supply chain statistics zero in on code and development pipelines. Distinguishing them matters: enterprise planning for supply chain risk will look at organizational and operational exposure (how many vendors, how central they are), whereas software supply chain metrics push IT teams to secure their development processes. Mixing them up (e.g. equating “third-party breach percent” with “vulnerable library count”) can mislead decision-makers. Each set of statistics serves distinct but complementary risk assessments.
Translated into action, these numbers imply the following for organizations:
In summary, every major statistic above implies a decision: whether to double down on vendor vetting, automate dependency scanning, accelerate CI/CD security projects, or invest in micro-segmentation. Supply chain risk is inherently cross-functional, so these stats should inform not only security roadmaps but also procurement policies, architecture principles, and corporate risk frameworks.
To act on the above insights, organizations should implement layered controls across people, process, and technology:
These measures reduce both the probability and impact of supply-chain compromises. For instance, vendor least-privilege and segmentation constrain blast radius; continuous scanning and patching reduce exploitable vulnerabilities in third-party code; and contractual safeguards ensure accountability. When layered, they turn the raw statistics above into manageable risk making it far harder for an attack at a supplier to turn into a disaster for the business.
A fundamental way to quantify supply-chain risk is expected loss (EL) = probability of an event × impact if it occurs. Supply-chain statistics inform both factors:
Illustrative example: Consider a manufacturing firm that sources critical components from 10 suppliers. Illustrative expected-loss models should be tailored to supplier criticality, contractual dependency, and operational downtime sensitivity. For example, a manufacturer may model a small set of critical suppliers whose outage would materially disrupt production, then estimate probability ranges and impact scenarios for those suppliers rather than averaging risk across the entire vendor base.
In practice, risk models might bucket suppliers by risk level (e.g. critical vs low-impact) and apply different probabilities. The cited statistics (e.g. 1 in 3 breaches involve vendors, average 3.7 breaches/org) help set realistic probabilities. Similarly, impact figures (downtime, revenue loss percentages) calibrate the cost side. Enterprises should note that expected loss models are rough guides: a low-frequency, high-impact event (like a massive data breach at a supplier) might not be fully captured by simple EL math. Thus these models must be used alongside scenario planning and not rely solely on averages.
Regardless, quantifying expected loss makes supply-chain risk transparent to the board. It bridges the gap between abstract stats and dollars at risk. For example, showing that a 20% probability of a $20M loss (EL = $4M) justifies comparable spending on preventive measures or insurance.
These are quantitative measures of cyber risk stemming from external dependencies. They include data on breaches caused by suppliers, vulnerabilities in third-party software, incidents involving vendor networks, and related trends. In short, they tell you how often and how severely suppliers and dependencies cause security problems.
Very common. Surveys and breach studies agree that a large share of organizations get hit by supply-chain breaches each year. For example, one study found 81% of companies had experienced at least one supply-chain breach over a year. Industry reports also note that third parties are involved in roughly one-third of all breaches. These numbers have been rising annually.
Third-party risk generally refers to cybersecurity issues from business partners or service providers (vendors, contractors, managed service firms). Software supply chain risk specifically refers to threats in the software development pipeline (malicious libraries, build system compromise, code repositories). They overlap (a software provider is a third party) but emphasize different domains: third-party risk is a procurement/RiskMgmt concern, while software supply chain risk is focused on development and code.
Because they can bypass many internal controls. A breach in a supplier often hits quickly and broadly. For example, if a critical vendor is compromised, all companies depending on that vendor might experience simultaneous downtime or data loss. Statistics show a single incident now tends to have multiple “downstream” victims. Also, customers often discover these breaches late (many supply-chain breaches have long dwell times), which amplifies damage. Operationally, companies then face emergency logistics, accelerated incident response costs, and regulatory fallout, all at scale.
Studies highlight healthcare and the public sector as especially vulnerable. One survey found 87% of healthcare organizations had a supply-chain breach, the highest of any sector studied. Manufacturing and critical infrastructure are also very exposed (complex supplier networks, OT systems). Finance and tech firms typically report slightly lower vulnerability (their vendors often have better security ratings), but no industry is immune. Large enterprises with global supply chains face risk in any sector.
By enforcing strict controls on suppliers and dependencies. Key steps include:
They are often the initial entry point. Attackers target suppliers because compromising one vendor can reach many customers. Suppliers may have weaker security controls or credentials that attackers steal. Common scenarios: hijacked vendor updates (malicious patch from a software vendor), stolen vendor credentials (used to log into customer portals), or exploitation of a vendor’s exposed vulnerability. The stats (e.g., ~30% of breaches involve third parties) illustrate that vulnerabilities at suppliers are a major attack vector for the industry.
Different reports focus on different data. For example, one study might count all malware incidents that touched a vendor, while another only counts confirmed data breaches. Some are based on surveys (subjective, may over/under-report), others on open-source databases of disclosed breaches. Also, “supply chain” can be defined differently (some include software dependencies; some only external service providers). Analysts often clarify the scope: e.g., “third-party breaches” versus “software supply chain incidents.” Understanding the methodology (data source and definition) is key to interpreting any stat correctly.
Supply chain cybersecurity is neither an obscure niche nor a minor component of risk; it is a central enterprise security challenge. The data make the pattern clear: a substantial share of modern breaches now involve suppliers, service providers, software dependencies, or other external trust relationships, while malicious package activity and dependency exposure continue to expand. Far from being simply an IT problem, these risks cut across procurement, operations, legal, and the C-suite.
The key finding is clear: supply-chain risk is accelerating. Organizations must treat their ecosystem of partners, vendors, and software dependencies as an integrated domain of attack surface. Effective management requires bridging the traditional silos enforcing cyber controls in procurement, architecture, and vendor relations.
Importantly, these statistics should be used as a decision tool. Board members and CISOs alike should leverage them to allocate resources to supply chain resilience: diversifying suppliers, investing in visibility (SBOMs, continuous monitoring), strengthening identity controls for third parties, and validating defenses through testing.
Ultimately, 2026 calls for supply chains that are transparent, robust, and adaptive. The smartest businesses will use supply-chain security metrics to guide procurement choices, to design networks that can tolerate vendor failures, and to report risk accurately at the executive level. In this new era, supply chain cybersecurity is inseparable from enterprise resilience and the statistics above must shape every governance and technical decision in pursuit of that goal.
Mohammed Khalil is a Cybersecurity Architect at DeepStrike, specializing in advanced penetration testing and offensive security operations. With certifications including CISSP, OSCP, and OSWE, he has led numerous red team engagements for Fortune 500 companies, focusing on cloud security, application vulnerabilities, and adversary emulation. His work involves dissecting complex attack chains and developing resilient defense strategies for clients in the finance, healthcare, and technology sectors.

Stay secure with DeepStrike penetration testing services. Reach out for a quote or customized technical proposal today
Contact Us