May 18, 2025
Updated: April 19, 2026
A data-reliability-controlled view of cybercrime losses, vectors, sectors, and decision implications using the latest verifiable reporting.
Mohammed Khalil

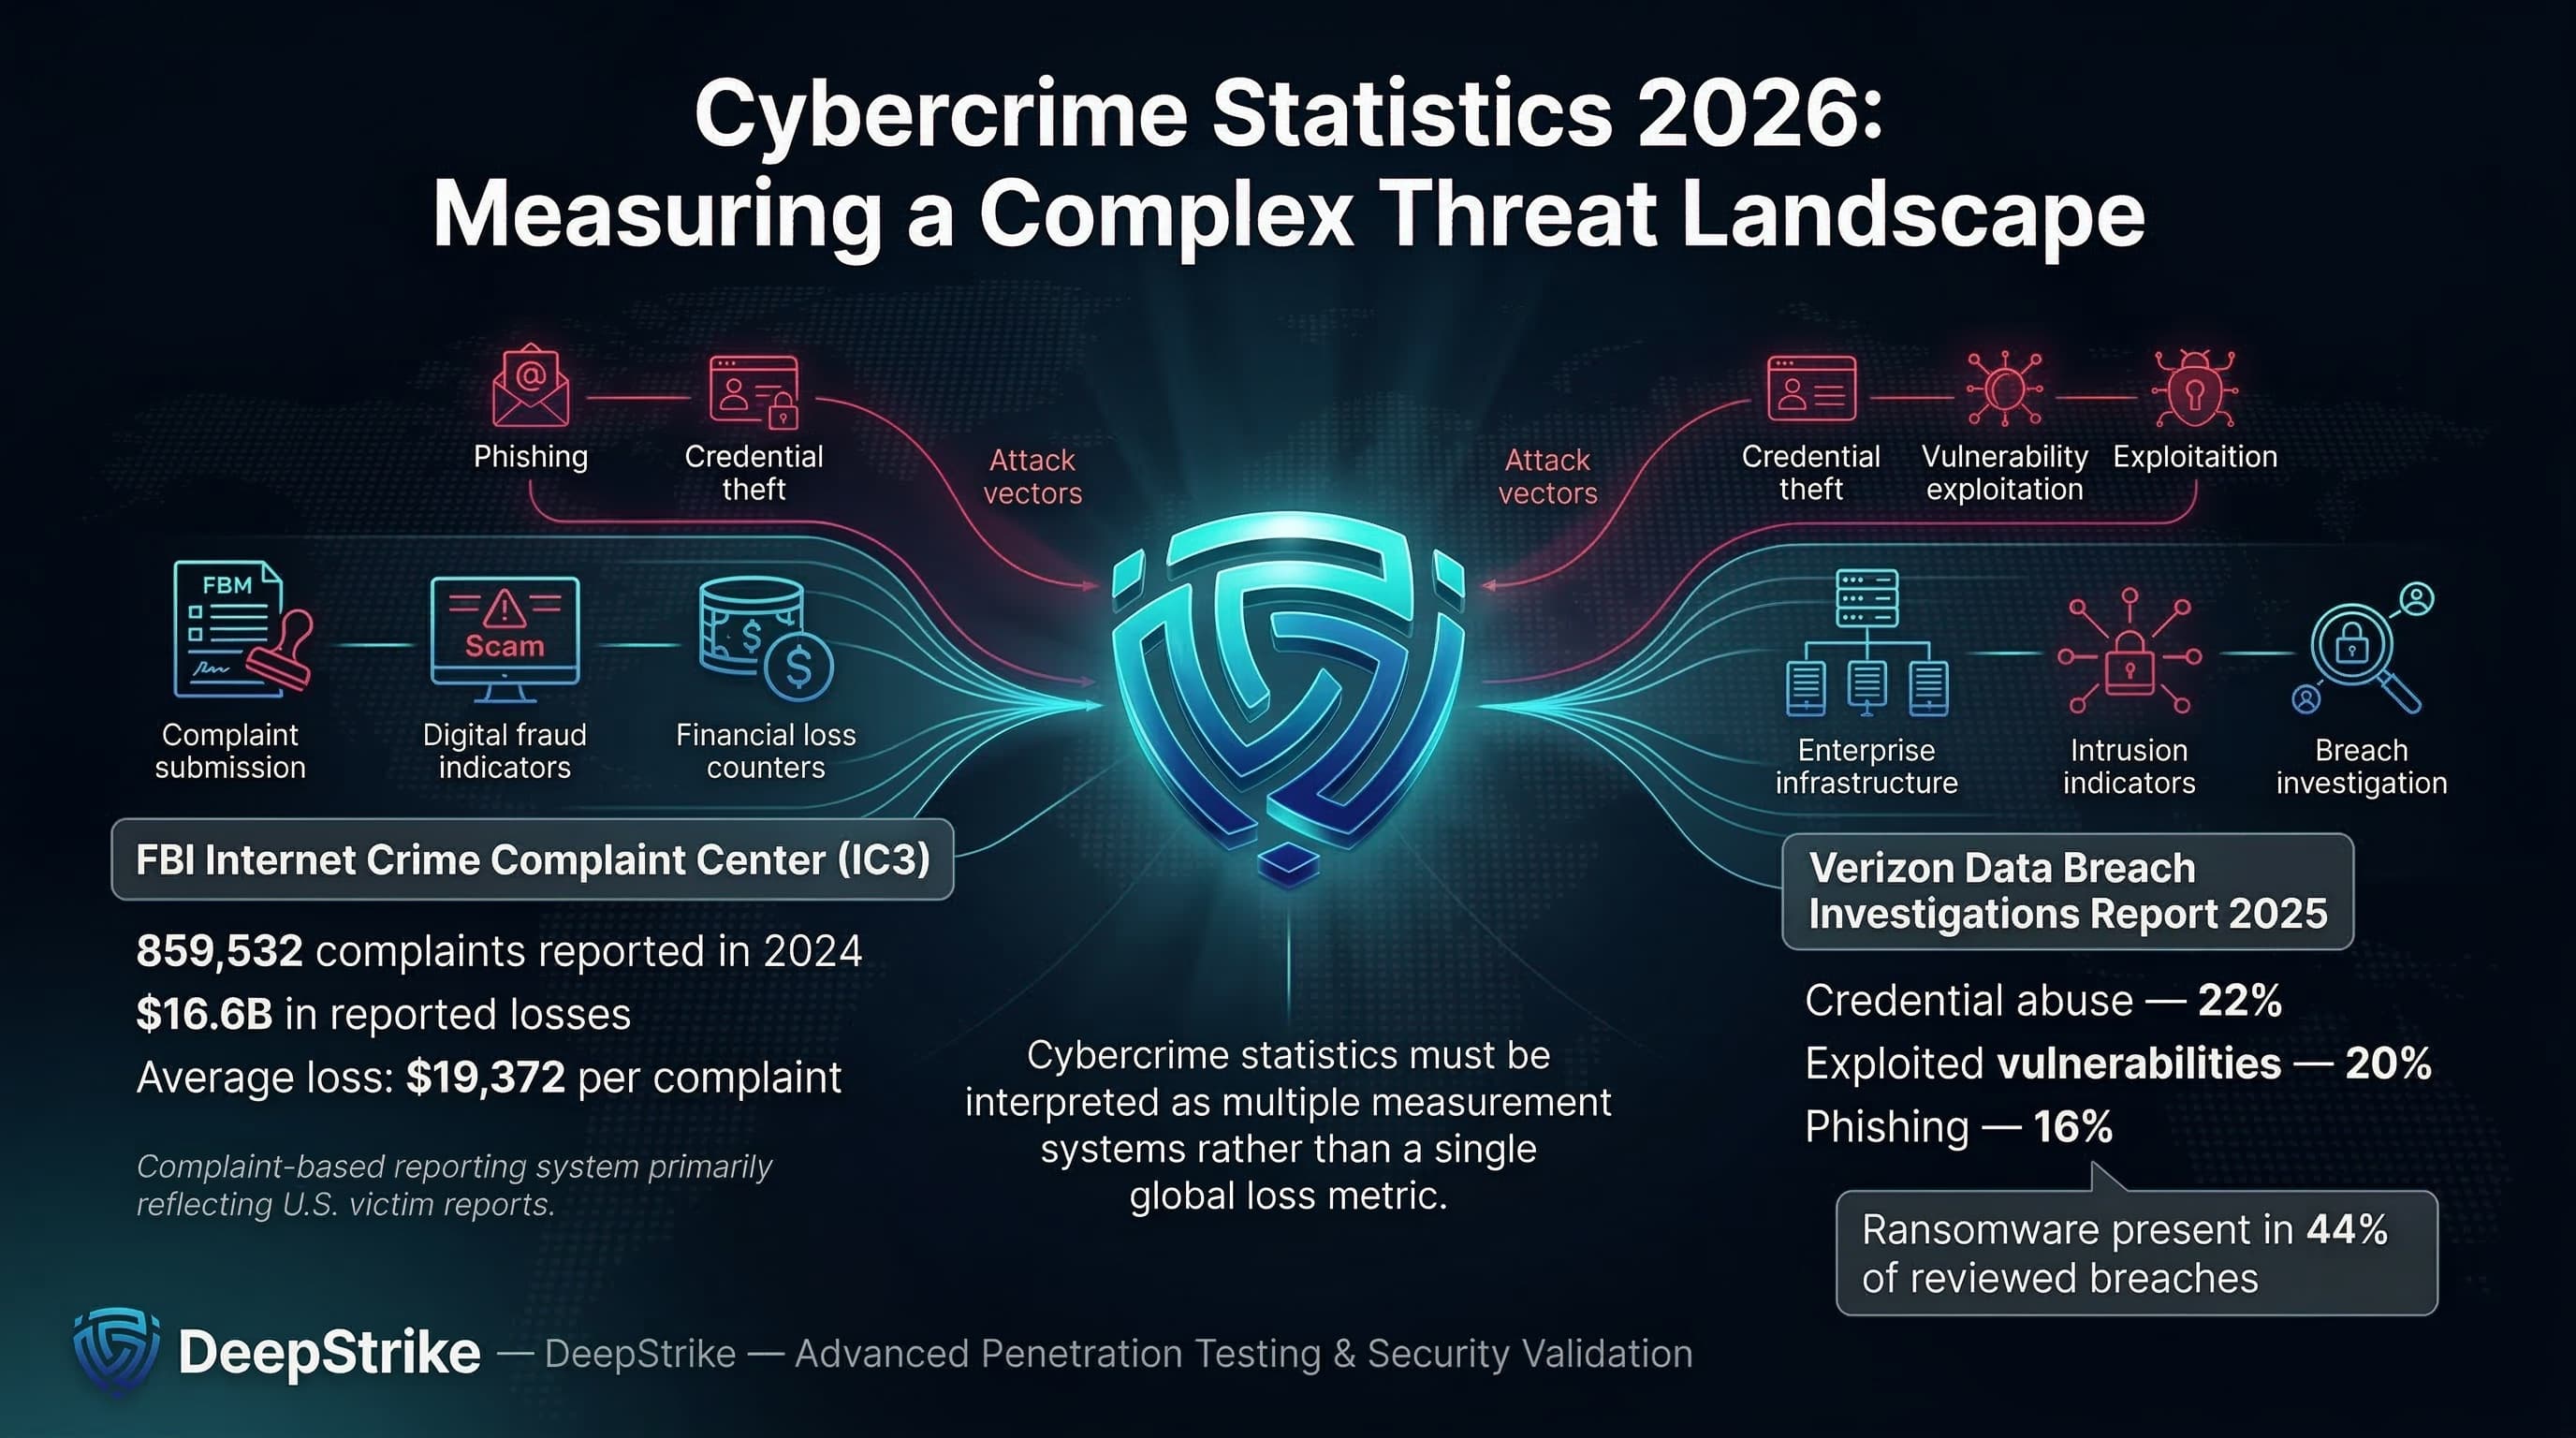
Cybercrime statistics in 2026 are best treated as a portfolio of measurements each tied to a specific reporting system rather than a single authoritative “global cybercrime loss” figure. The latest figures from the FBI’s Internet Crime Complaint Center (IC3) highlight $16.6 billion in reported losses from 859,532 complaints in 2024, with an average reported loss of $19,372 (complaint-based, U.S.-weighted). In parallel, Verizon’s 2025 Data Breach Investigations Report shows that credential abuse, exploitation of vulnerabilities, and phishing remain leading initial access vectors and that credential abuse (22%), exploitation of vulnerabilities (20%), and phishing (16%) are leading known initial access vectors in non-error, non-misuse breaches while ransomware appears in 44% of reviewed breaches.
For enterprises, these numbers describe a combined risk system: cybercrime is a financial loss problem (fraud, theft, extortion payments), an operational disruption problem (service interruption, recovery time), a fraud-and-extortion problem (identity compromise driving authorized payments and coercion), and a strategic risk issue This requires ongoing enterprise penetration testing services in the U.S. across control design, vendor exposure, and governance. Put simply: modern cybercrime monetization follows predictable paths credential acquisition, trust abuse, payment diversion, data theft, and coercion so the most useful statistics are the ones that map cleanly to continuous control validation.
Cybercrime Statistics refer to quantified data about digitally enabled criminal activity, including attack frequency, victimization rates, financial losses, fraud patterns, extortion activity, major attack methods, industry targeting, regional differences, and broader trends in the cybercriminal economy.
Cybercrime statistics typically measure one (or more) of the following: reported complaints (how many people or organizations filed a report), victim counts (distinct victims or affected entities), financial losses (direct loss reported by victims, adjusted loss, or tracked financial flows), and incident frequency (how often certain event types occur within a dataset). In practice, these are often grouped by fraud category (investment fraud, BEC, impersonation), intrusion type (phishing, credential theft, exploited vulnerabilities), and monetization model (payment diversion, account takeover, ransomware, data-theft extortion).
A simple operational example illustrates why “cybercrime volume” is not one metric. If a company receives 50 phishing lures in a week, that is exposure, not victimization. If one employee submits credentials, that may create a valid-account intrusion (incident). If the attacker uses that access to change vendor bank details and execute a payment-redirection fraud scenario, the “loss” is financial and often reported through financial institutions or law enforcement channels. The true prevalence is larger than complaints because many events never become confirmed losses, and many losses are never reported.
Complaint-based figures (law-enforcement reporting portals), incident-response datasets (cases handled by responders), public disclosures (regulatory or investor reporting), and surveys (self-reported estimates) are not identical measures. They differ in coverage, classification, and incentives to report so they should not be merged into a single “global total” without careful methodological boundaries.
The table below summarizes verifiable reference points across major reporting ecosystems. These metrics are not additive; they represent different populations and definitions (complaints, scams, curated incidents, breach datasets). Because publication cycles differ by source, the comparison reflects the prior published value and the latest available value for each dataset rather than a single uniform year pair.
| Metric | Prior Published Value | Latest Available | Trend | Notes |
|---|---|---|---|---|
| IC3 reported losses (U.S.-weighted complaints) | $12.5B (2023) | $16.6B (2024) | Up | Complaint-based losses; reflects reported victim loss, not total prevalence. |
| IC3 complaint volume (U.S.-weighted) | 880,418 (2023) | 859,532 (2024) | Slightly down | Complaint count decreased while reported losses rose, implying higher loss per reported event mix. |
| IC3 BEC losses | ~$2.9B (2023) | $2.77B (2024) | Slightly down | High-loss category with stable complaint volume; still a top enterprise fraud path. |
| ENISA curated incidents (EU-focused threat landscape) | 11,079 observed incidents (ETL 2024) | 4,875 analyzed incidents (ETL 2025) | Not directly comparable | Methodology and curation changed; both are OSINT-influenced and EU-scoped. |
| Australia combined scam losses (multi-source aggregation) | $2.7B (2023) | $2.03B (2024) | Down | Cross-agency aggregation; includes Scamwatch, ReportCyber, AFCX, ASIC, IDCARE with adjustments. |
| Singapore scam losses | $1.1B (2024) | $913.1M (2025) | Down | Losses fell while median loss per case increased, indicating fewer cases but higher typical impact. |
| Canada reported fraud and cybercrime losses (CAFC-referenced) | $578M (2023) | $638M (2024) | Up | Reported losses; underreporting explicitly noted in Canadian reporting context. |
Interpretation: the most decision-relevant shift for enterprise planning is not “more incidents” in a generic sense, but the persistent concentration of measurable losses in fraud and workflow abuse. IC3 losses rose sharply even as complaints fell slightly, consistent with higher-loss categories (notably investment fraud and cyber-enabled fraud) dominating the total.
For Europe, ENISA’s published totals highlight a real constraint: incident counts can move significantly based on collection methodology (OSINT visibility, curation rules, sector tagging). Treat incident volumes as directional indicators, not absolute prevalence.
For APAC jurisdictions with strong scam reporting, “cybercrime” manifests as payment diversion and social engineering at scale. Losses can fall year-over-year while median loss rises, which is consistent with targeted selection of higher-value victims and improved disruption of low-grade scams.
The table below distinguishes between (1) direct criminal loss (money transferred to criminals or directly stolen), (2) the broader business impact (recovery, downtime, legal/compliance friction), and (3) breach cost research (average organizational cost of breaches, not a “cybercrime total”).
| Indicator | Value | Change YoY | Notes |
|---|---|---|---|
| Direct reported loss (IC3 complaints, U.S.-weighted) | $16.6B (2024) | +33% vs 2023 | Complaint-based reporting; not a global total; reflects reported losses tied to complaints. |
| Cyber-enabled fraud losses within IC3 | $13.7B (2024) | N/A | Subset of IC3 classification; reported as ~83% of all IC3 losses in 2024. |
| BEC losses (IC3 category) | $2.77B (2024) | Down vs 2023 | BEC remains a primary enterprise payment-diversion pathway, even when complaint counts are flat. |
| Ransomware adjusted loss (IC3 category) | $12.47M (2024) | N/A | Explicitly incomplete: excludes downtime, recovery, and unreported losses; not usable as “ransomware cost.” |
| On-chain ransomware payments (Chainalysis) | ~$820M (2025) | -8% vs 2024 est. | Tracks attributable on-chain payments; subject to attribution lag and scope constraints. |
| Average org cost of a data breach (IBM research) | $4.44M (2025) | -9% vs 2024 | Research-based average breach cost; not a cybercrime loss total; influenced by detection/containment speed. |
| UK business “most disruptive breach” cost (survey) | £1,600 mean (2025 survey) | Up vs 2024 | Self-reported costs; among breaches with an outcome, mean total cost reported as £8,260. |
The first control-relevant distinction: direct criminal loss is the money transferred or stolen (typical in scams, BEC, some extortion payments). Business impact is larger and includes downtime, recovery labor, specialist IR, legal costs, customer remediation, and downstream revenue drag. A ransomware case can be “cheap” as a ransom payment but extremely expensive as business interruption; conversely, a BEC case may be a pure financial loss with minimal outage but high recovery friction (reversal attempts, legal disputes).
The second distinction: law-enforcement complaint loss totals and breach-cost studies are different measurements. IBM’s Cost of a Data Breach research is better treated as an organizational cost benchmark, while IC3 reflects reported victim losses tied to complaints. These should inform different parts of budgeting: breach-cost benchmarks inform resilience investment and IR capacity; complaint loss informs fraud controls, identity security, and payment governance.
Phishing remains the most scalable entry point because it is cheap, adaptable, and increasingly personalized using public context or stolen data. In breach datasets, phishing is a leading known initial access vector, and “human element” involvement remains substantial.
Operationally, phishing is rarely the end state. Its function is to harvest credentials (valid account takeover), approve a fraudulent action (authorized push payments, gift cards, crypto), or establish authenticated sessions for follow-on compromise. The most damaging campaigns are context-rich: invoices, permit applications, vendor onboarding, payroll changes, and urgent executive requests where the social proof is stronger than purely technical deception.
BEC is payment fraud optimized for enterprise process weaknesses. IC3 reports BEC as a multi-billion-dollar loss category, and complaint-based data shows that BEC volume can be stable while losses remain structurally high.
From an attacker’s perspective, BEC does not require advanced malware. The core requirements are (1) a believable social-engineering pretext, (2) access to an email account or convincing spoofing, and (3) a payment workflow that can be redirected without independent verification.. The “business control failure” is typically not an email filter; it is the absence of out-of-band verification and bank-detail change controls aligned to fraud reality.
Globally, IC3 public safety reporting notes BEC incidents across many countries and tracks exposed losses over time (a different measurement than annual complaint losses). This matters because payment flows often cross borders even when victims do not.
Ransomware has matured into an ecosystem: initial access brokers, credential theft, vulnerability exploitation, and extortion infrastructure. In breach datasets, ransomware appears in a large share of reviewed breaches and shows a pattern consistent with commoditized deployment against organizations with weak identity and patch hygiene.
For cost modeling, separate three “prices”: the extortion demand, the paid amount (if any), and the business interruption cost. Payment refusal can rise while attacks also rise; on-chain tracking shows that total ransomware payments can decline while claimed attacks increase, which is consistent with improved restoration capability plus more frequent but lower-conversion targeting.
Credential-driven compromise patterns are the connective tissue of modern cybercrime because they convert social engineering and malware into durable access DBIR analysis highlights measurable overlap between compromised credentials, unmanaged devices, and later ransomware victimization signals, indicating that credential markets and infostealer ecosystems are not just “consumer problems” they map directly to enterprise compromise pathways.
From a practitioner perspective, account takeover is often a chain: stolen credentials → session token abuse or MFA fatigue and relay techniques → mailbox access or collaboration access → invoice/payment diversion or privileged escalation. This is why identity telemetry (impossible travel, device posture, token reuse, anomalous OAuth grants) is now fraud control as much as “IT security.”
Online fraud includes investment scams, impersonation, payment redirection, and platform-enabled deception. In IC3 reporting, investment fraud is repeatedly a top-loss category, and scam reporting programs in Australia and Singapore show investment scams and impersonation as major loss drivers.
For enterprises, the practical overlap with security architecture is significant: criminals exploit public data for targeting, compromise accounts for legitimacy, and monetize through payment rails that are difficult to reverse (wire transfers, crypto transfers, peer-to-peer payments). Controls therefore live at the workflow layer (verification, approvals, payee validation) as much as at the “security tooling” layer.
The table below combines breach dataset shares (where available) with relevance signals from threat landscape reporting and scam loss reporting. “Share” values only apply within the cited dataset; they are not global prevalence.
| Vector / Method | Share of Incidents or Relevance | Avg Impact / Cost | Notes |
|---|---|---|---|
| Credential abuse / valid accounts | 22% of known initial access vectors (breaches) | High | Drives BEC, internal reconnaissance, and privilege escalation; compounded by weak device posture. |
| Exploited vulnerabilities | 20% of known initial access vectors (breaches) | High | Includes edge device/VPN exposure; patch latency becomes a direct fraud/extortion enabler. |
| Phishing | 16% of known initial access vectors (breaches); also dominant in EU intrusion reporting | Variable to high | Phishing enables credential theft, malware delivery, and context-rich payment fraud. |
| Third-party compromise | 30% of breaches involved a third party | High | Vendor access and supplier identity become part of the attack surface. |
| Ransomware / extortion | Present in 44% of reviewed breaches | High | Includes encryption and/or theft extortion; business interruption often dominates cost. |
| Permit/workflow impersonation | High relevance (active FBI reporting) | High (per event) | Uses public records and process context to force payments; often via wire/crypto. |
| Payment redirection scams | Large loss contributor in national scam reporting | High (direct loss) | Often overlaps with BEC: payee changes, fake invoices, supplier impersonation. |
Most enterprise cybercrime campaigns are chained operations, not single techniques:
Mapping to MITRE ATT&CK is useful at the control-design level: phishing and user execution as initial access, valid accounts for persistence and lateral movement, credential dumping and token theft for privilege expansion, and exfiltration for extortion leverage. The point is not taxonomy completeness; it is aligning detection and prevention to the attacker’s actual monetization sequence. (ATT&CK mapping is a practitioner interpretation, not a statistical claim.)
The table below reflects relative exposure patterns commonly observed in verifiable datasets and sector-focused reporting, with explicit dataset boundaries (EU threat landscape sector shares are EU-scoped; critical infrastructure ransomware reporting reflects IC3 complaint inputs; breach datasets reflect disclosed/handled cases).
| Industry | Relative Exposure Level | Typical Impact Pattern | Key Notes |
|---|---|---|---|
| Healthcare | High | Disruption + extortion + downstream patient/service impact | Ransomware complaints in critical infrastructure reporting show healthcare/public health as a top affected sector in that dataset. |
| Finance | High | Fraud + credential theft + account takeover + regulatory exposure | High-value workflows (payments, identity) concentrate attacker focus; often paired with social engineering. |
| Technology | Medium to High | Identity attack chains + secrets leakage + third-party blast radius | Cloud collaboration and developer access create credential and token opportunities; third-party dependencies amplify impact. |
| Manufacturing | High | Disruption + extortion + operational technology constraints | EU threat landscape reporting flags cybercrime pressure on manufacturing and ransomware concentration in cybercrime activity. |
| Retail | Medium to High | Payment fraud + credential stuffing + customer trust impact | High-volume consumer-facing accounts create account takeover and fraud surface; also exposed to vendor/payment workflows. |
| Government / Public Sector | High (volume) | Availability attacks + impersonation + sensitive data exposure | EU reporting shows public administration as a top targeted sector in that dataset; fraud against permitting and services is actively observed. |
Why industries differ operationally:
The table below adapts to a global view by anchoring on jurisdictions with transparent, published scam/cybercrime measurement. Gaps elsewhere should be treated as reporting gaps, not absence of cybercrime.
| Region | Key Trend | Cost or Impact Signal | Notes |
|---|---|---|---|
| United States | Rising reported loss despite slightly fewer complaints | $16.6B losses from 859,532 complaints (2024 IC3) | Complaint-based reporting; strong visibility but underreporting still acknowledged in cybercrime contexts. |
| European Union | Phishing + vulnerability exploitation as primary intrusion engines; sector concentration | ENISA reports curated incident analysis and sector targeting (public administration prominent) | OSINT and methodology constraints; not directly comparable year to year without caveats. |
| United Kingdom | Breach cost distribution skewed; many “zero-cost” reports, heavy tail for outcomes | Mean £1,600 for most disruptive breach; £8,260 among those with outcomes | Survey self-reporting; useful for modeling impact distributions rather than absolute prevalence. |
| Australia | Reported scam losses declined YoY while volumes remain large | $2.03B combined reported losses (2024) | Multi-source aggregation; strong lens on consumer and payment diversion exposure. |
| Singapore | Losses declined, median loss rose; crypto share meaningful | $913.1M losses (2025) vs $1.1B (2024) | National reporting highlights scam category shifts and channel migration (platform changes). |
| Canada | Reported losses increased; explicit underreporting noted | $638M losses (2024) vs $578M (2023) | Low reporting rates are explicitly referenced, so losses should be treated as a floor. |
The global governance implication is straightforward: regions with mature reporting show measurable fraud and scam losses at scale, while breach datasets show consistent identity and vulnerability-driven entry. Where reporting is weak, enterprise risk does not disappear; it becomes harder to quantify and easier to misprice.
The examples below are limited to credible public reporting with clear scope constraints (no invented attribution; no speculative root cause). They are illustrative operational case signals, not a statistically representative sample of 2026 cybercrime activity.
Stryker (medical device sector): In March 2026, Stryker disclosed a cybersecurity incident causing global disruption to its Microsoft environment, noted no indication of ransomware or malware at the time of filing, and stated that the full operational and financial impacts were not yet known. Strategically, this is a high-signal example of how enterprise-wide identity and device management planes (e.g., endpoint management) can become single points of operational disruption.
Bumble (consumer platform with enterprise cloud collaboration exposure): In January 2026 reporting, Bumble stated that a contractor account was compromised via phishing, producing brief unauthorized access to a small portion of its network, with no access to member database, user accounts, or private messages per the cited statement. Strategically, the case illustrates third-party identity risk and the “small credential event → brand-scale response” dynamic typical of modern cybercrime targeting cloud collaboration tooling.
Planning/zoning permit payment phishing (workflow-impersonation fraud): In March 2026, IC3 warned of criminals impersonating city/county officials using publicly available permit information (property addresses, case numbers, real official names) to request fraudulent payments via wire, peer-to-peer payment, or cryptocurrency. Strategically, this is a clear example of “public data + process context” producing invoice-quality fraud at scale, and why verification controls must exist outside the email channel.
The trends below are restricted to evidence-based signals from the cited reporting.
Vulnerability-led initial access growth: Verizon DBIR Executive Summary 2025 notes exploitation of vulnerabilities reaching 20% as an initial access vector within its breach dataset, with credential abuse still the most common. For security architecture, this supports prioritizing external attack surface management, patch SLAs for exposed edge systems, and compensating controls when patching is not feasible.
Credential markets as a ransomware precursor: DBIR analysis correlates infostealer credential logs and victim domains, indicating that compromised corporate credentials and unmanaged device exposure can be upstream indicators for later intrusion and extortion. Security implication: identity posture management and device compliance are not “IT hygiene” they are loss-reduction controls.
Ransomware payment pressure and conversion decline: According to Chainalysis ransomware payment tracking, total on-chain ransomware payments were around $820M (with a noted likelihood of later upward revision due to attribution lag), while also describing a lower share of victims paying and rising median payment size. Security implication: invest for restoration and containment speed (to reduce coercion leverage), and design segmentation and backup strategies assuming “exfiltration + coercion,” not only encryption.
Third-party involvement as a persistent amplifier: DBIR’s executive summary reports breaches involving third parties rising to 30%. Security implication: vendor access pathways, shared identity, and integration tokens must be treated as first-class attack surfaces; procurement should require evidence of identity controls and logging maturity.
AI-enabled social engineering scaling (qualified): ENISA’s threat landscape reporting describes AI as an increasingly important accelerant in phishing, impersonation, and fraud workflows. Security implication: shift training away from generic “spot the typo” awareness and toward verification workflows, phishing-resistant authentication, and impersonation-resistant business processes.
Public-record and OSINT-driven fraud targeting: The IC3 permit-fee phishing PSA shows how legitimate public data is weaponized to produce high-credibility lures. Security implication: treat sensitive workflow identifiers (case numbers, permit references, invoice IDs) as potential “authentication material,” and design alternate verification channels accordingly.
| Attribute | Cybercrime Statistics | General Cybersecurity Incident Data |
|---|---|---|
| Primary Focus | Criminal monetization and victim loss | Intrusion activity, control failures, and security outcomes |
| Typical Metrics | Reported losses, fraud categories, victim counts, extortion payments | Incident counts, root causes, TTPs, dwell time, affected records |
| Financial Emphasis | Central (loss is often the primary metric) | Variable (financial impact may be secondary or estimated) |
| Reporting Source | Law enforcement portals, scam reporting centers, financial institutions | IR casework, security telemetry, disclosures, breach databases |
| Business Relevance | Directly ties to fraud controls and executive risk reporting | Ties to security posture, resilience, and technical control maturity |
| Common Limitation | Underreporting; inconsistent categorization; non-comparability across jurisdictions | Sampling bias; disclosure gaps; inconsistent definitions of “incident” |
Cybercrime datasets tend to emphasize losses, complaints, and monetization patterns because they are oriented around crime reporting and financial harm. Broader incident datasets emphasize intrusion mechanics, exploited weaknesses, and security control performance useful for engineering decisions but not always sufficient for fraud-risk quantification. Practically, mature enterprise risk management uses both: crime stats to prioritize loss paths and business controls, and incident data to prioritize technical prevention and detection.
These cybercrime statistics translate into a set of enterprise decisions that are not optional if you operate modern payment workflows, cloud collaboration, and third-party integrations.
Security architecture: The dominance of credential abuse and vulnerability exploitation as entry vectors should push organizations toward two architectural priorities identity hardening and external exposure reduction. “Identity” here includes device compliance, session risk, token governance, and privileged access boundaries, not only MFA checkboxes.
Identity controls: Phishing-resistant authentication with FIDO2/WebAuthn matters because the most profitable attacks do not need malware if credentials can be replayed or tokens can be hijacked. Where phishing-resistant MFA is not feasible, require step-up authentication for high-risk actions (payee changes, bank detail edits, new device enrollment, and admin-role grants).
Payment and vendor workflows: IC3’s persistent BEC losses and the permit-fee phishing pattern point to a core truth: money moves when processes allow it. Implement payee validation, separation of duties for bank detail changes, and mandatory out-of-band confirmation using known-good contact points (not the email thread). Treat invoice and permit references as attacker-known data, not as proof of legitimacy.
Monitoring and detection: Build detection around the chain. Monitor for abnormal mailbox rules, OAuth consent anomalies, atypical financial-system actions (new beneficiary + first payment), and suspicious sign-in and token patterns. Align detection engineering to high-loss paths rather than generic IOC chasing.
Third-party risk: If a third party is involved in 30% of breaches in a major breach dataset, vendor identity and integration security are attack surfaces. Require contractual telemetry: logs, incident notification timelines, and evidence of privileged access governance. Technically, reduce standing access (JIT/JEA), scope tokens tightly, and isolate vendor access to segmentable zones.
Board reporting and budget allocation: Replace ‘number of attacks blocked’ with (1) exposure to loss pathways, (2) control coverage for those pathways, and (3) time-to-contain and time-to-recover metrics that directly reduce extortion leverage and overall breach-related cost.
Validation: Penetration testing and adversary simulation for cybercrime chains should explicitly test vendor invoice redirection, mailbox takeover to payment diversion, token theft leading to cloud file exfiltration, and extortion staging. The objective is measurable reduction in probability of successful monetization, not only “finding vulnerabilities.”
Phishing-resistant MFA: Deploy FIDO2/WebAuthn for administrators, finance teams, and anyone who can approve payments or access sensitive customer datasets. This reduces credential replay and phishing-relay exposure.
Payment verification controls: Require independent verification for any change in payee bank details or payment destination. “Independent” means a known-good channel and pre-registered contact, not replying to the same email thread. This directly targets BEC loss mechanics.
Executive impersonation safeguards and approval controls should include a formal ‘no urgency override’ policy for payment change requests and verified approval chains. Attackers exploit urgency and authority; the control is governance plus enforced workflow.
Email and collaboration security: Harden mailbox rules, restrict auto-forwarding, monitor OAuth app grants, and limit third-party integrations. Many fraud paths are enabled by mailbox persistence and collaboration-layer exposure rather than endpoint malware.
Privileged access hygiene: Implement PAM with just-in-time privileged access, isolate admin workstations, and enforce device compliance.. Credential theft is amplified by unmanaged devices and valid-account overreach.
Logging and anomaly detection: Prioritize detections for (1) new beneficiary + payment, (2) bank-detail change events, (3) suspicious authentication patterns, and (4) mass data access or export in collaboration platforms. Confirm that logs exist and are retained long enough to investigate.
Incident readiness and recovery: Assume extortion pressure. Build a recovery plan that restores core business functions fast enough to reduce coercion leverage, and practice it with tabletop and technical exercises. Align recovery objectives to business interruption and recovery cost pressure, not only IT restoration.
Continuous testing: use continuous penetration testing services in the UK aligned to cybercrime attack chains such as identity compromise → payment diversion → cloud access broker path → extortion staging. Verify that control changes reduce attack success probability in realistic scenarios.
Expected Loss = Probability × Impact
Cybercrime statistics inform both sides of the equation. Probability is informed by observed vector prevalence (credential abuse, vulnerability exploitation, phishing) and by your own exposure (internet-facing assets, identity sprawl, third-party access). Impact is informed by loss benchmarks (fraud losses, breach cost research), operational dependencies (downtime sensitivity), and the reversibility of payment rails used by your business.
Illustrative example (non-sourced numbers): Assume your organization processes 10,000 vendor payments/month. If control gaps imply a 0.3% annual probability of a successful payment-redirection event with cyber-insurance relevance above $250,000, expected annual direct fraud loss from that scenario is 0.003 × $250,000 = $750. If you then implement payee validation and out-of-band verification that cuts probability by two-thirds (illustrative), expected loss becomes $250. The point is not the precision of the estimate; it is using crime statistics and workflow realities to quantify which control changes reduce expected loss most efficiently.
This same structure applies to extortion: probability is informed by your exposure to initial access vectors and recovery maturity, while impact is informed by business interruption tolerance and restoration time assumptions. The goal is board-legible: “Control X reduces expected loss by reducing probability (successful fraud) or reducing impact (downtime and restoration time).”
Quantified measures of digitally enabled criminal activity complaints, losses, victim counts, and category patterns scoped to a specific dataset and methodology.
There is no single verified global total. Authoritative figures exist per reporting system (for example, law-enforcement complaint losses or national scam reporting), and they are not directly additive.
In most reporting ecosystems, the highest-volume forms are social engineering and credential-driven fraud (phishing, impersonation), while the highest-cost forms often include investment fraud, BEC/payment diversion, and extortion.
Exposure varies by sector. Healthcare and manufacturing show strong disruption/extortion risk signals in multiple datasets, finance concentrates payment and identity fraud exposure, and government/public sector shows high targeting volume in EU-focused reporting.
Phishing is a primary entry mechanism that enables credential theft and trust abuse, leading to account takeover and fraudulent payments; it is also used to stage extortion by enabling initial access and data theft.
Cybercrime focuses on criminal monetization and victim loss; general cybersecurity incident data focuses on intrusion activity and control failures. Both matter, but they answer different questions.
Prioritize phishing-resistant authentication, payment verification controls, third-party access minimization, and monitoring aligned to fraud and extortion chains not only generic security tooling.
Yes. Multiple authoritative sources explicitly describe underreporting and OSINT visibility constraints; treat reported loss as a floor and model a heavy-tail distribution for true impact.
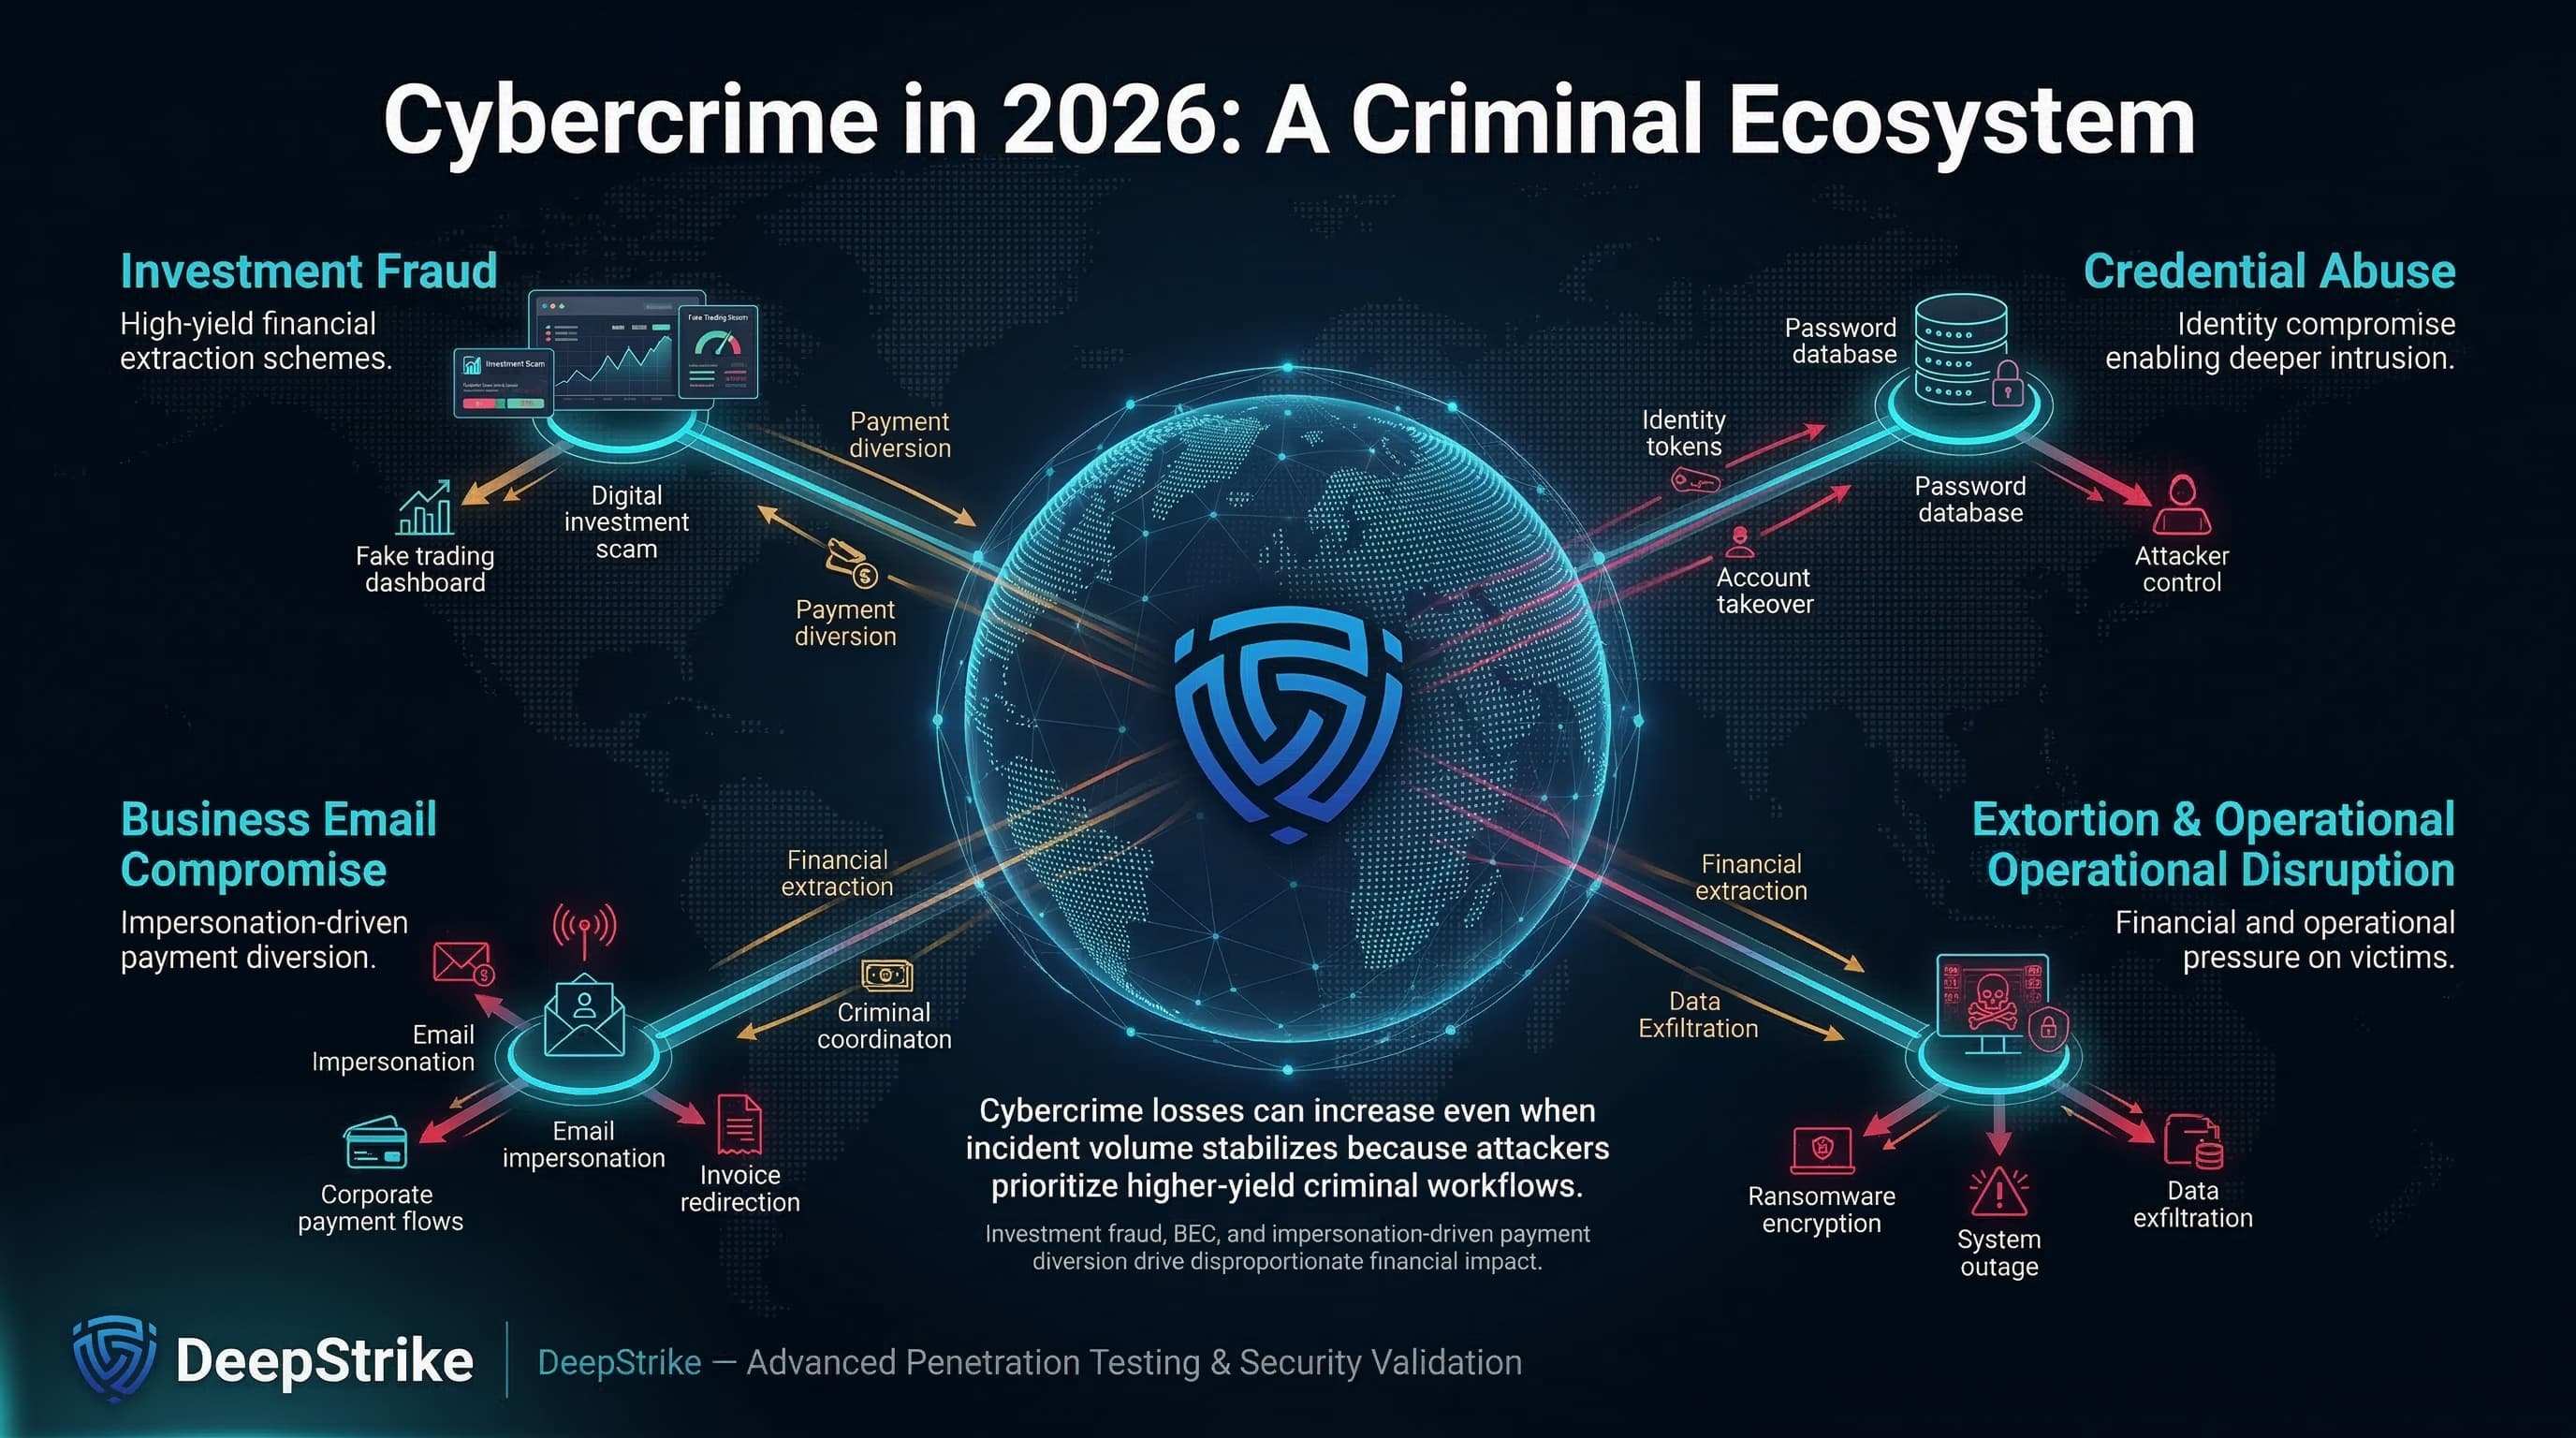
Cybercrime statistics in 2026 do not describe one threat; they describe a criminal ecosystem spanning fraud, extortion, credential abuse, and operational disruption. Complaint-based losses can rise even when complaint volume is flat or down, because criminals concentrate on higher-yield workflows, investment fraud, BEC, and impersonation-driven payment diversion.
The decision takeaway is architect-grade: use cybercrime statistics to identify where money exits, then design controls that break the chain through continuous penetration testing for attack-path reduction. The organizations that treat identity and workflows as the primary battleground will reduce expected loss more reliably than those that optimize only for generic “incident counts.”
Mohammed Khalil is a Cybersecurity Architect at DeepStrike, specializing in advanced penetration testing and offensive security operations. With certifications including CISSP, OSCP, and OSWE, he has led numerous red team engagements for Fortune 500 companies, focusing on cloud security, application vulnerabilities, and adversary emulation. His work involves dissecting complex attack chains and developing resilient defense strategies for clients in the finance, healthcare, and technology sectors.

Stay secure with DeepStrike penetration testing services. Reach out for a quote or customized technical proposal today
Contact Us