November 29, 2025
Updated: May 6, 2026
A statistics-led, source-disciplined view of breach cost, initial access, ransomware, identity compromise, and regional/industry signals for enterprise decisions.
Mohammed Khalil
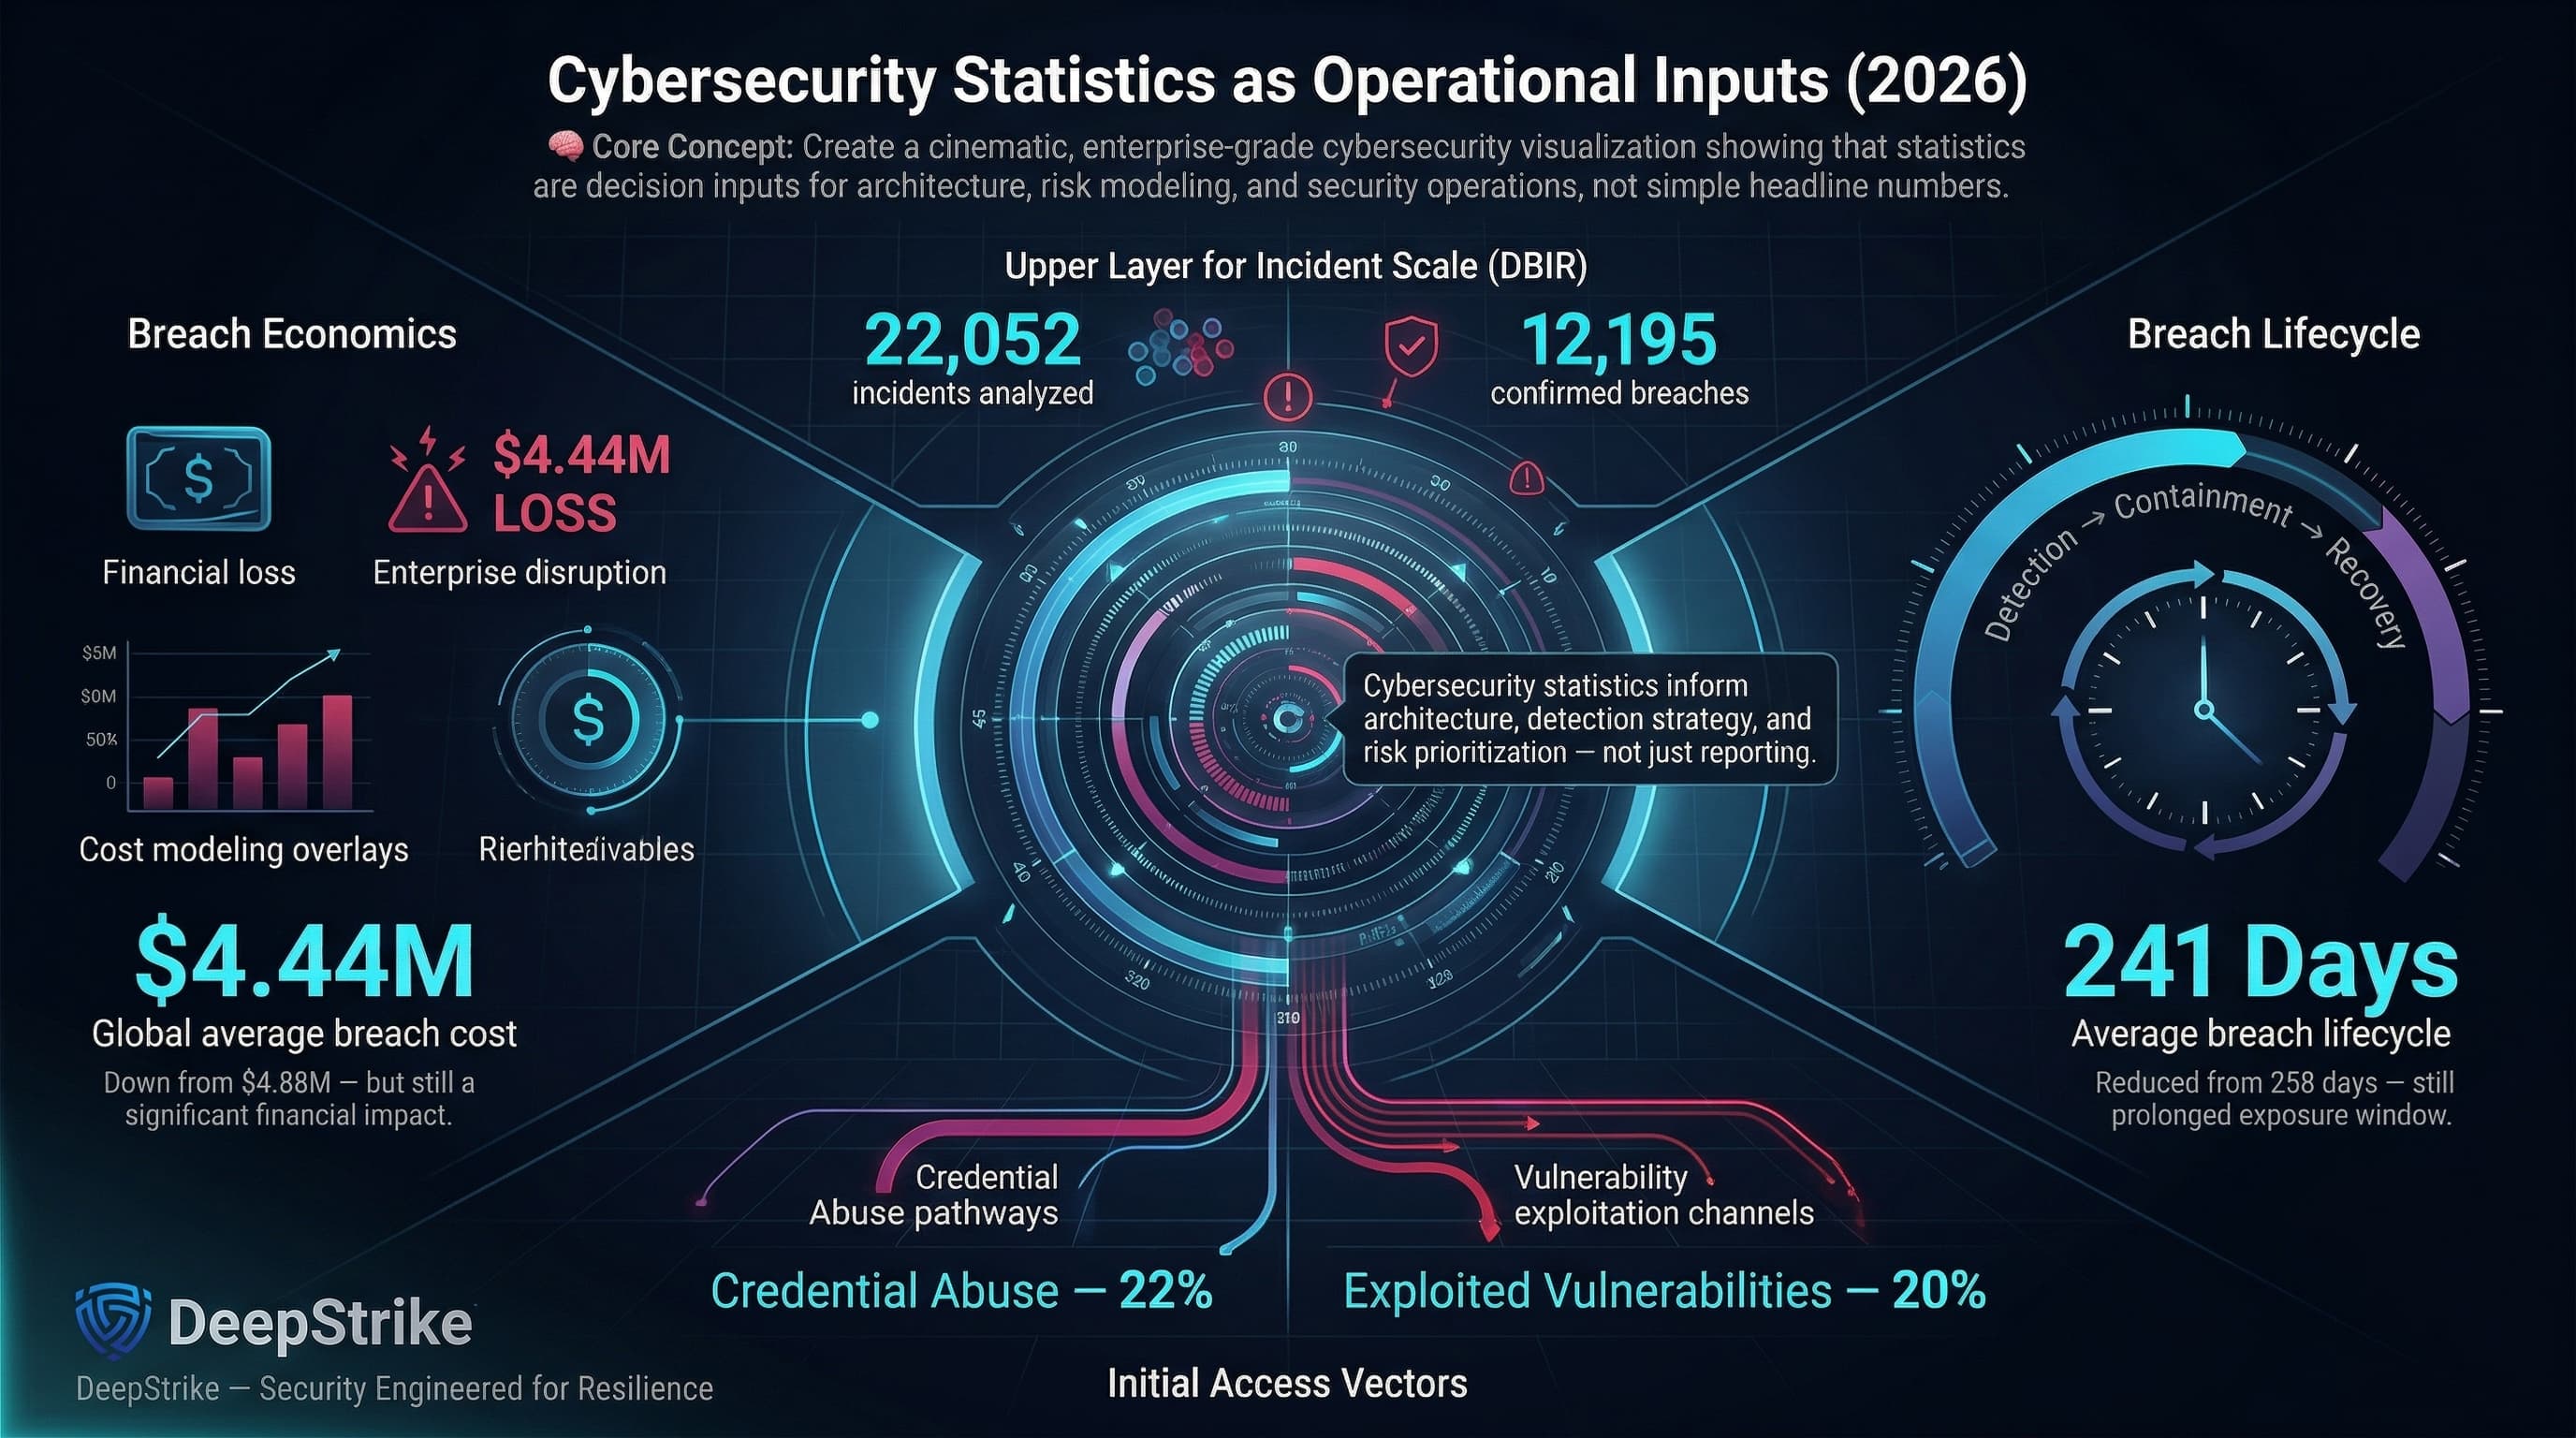
Cybersecurity statistics in 2025–2026 are operational inputs for enterprise architecture and risk decisions, not “headline counters.” The latest Cost of a Data Breach Report places the global average cost of a data breach at USD 4.44 million (down from USD 4.88 million) and the mean breach lifecycle at 241 days (down from 258). The latest edition of the Verizon Data Breach Investigations Report (DBIR) separately analyzes 22,052 incidents and 12,195 confirmed breaches, and shows credential abuse (22%) and vulnerability exploitation (20%) as leading initial access vectors in non-error, non-misuse breaches.
For enterprise planning, cybersecurity in 2025–2026 should be interpreted as a cross-source risk model rather than a single trendline. Breach datasets explain how attackers gain entry, breach-cost studies quantify downstream financial exposure, incident-response casework shows time-to-impact and attacker mechanics, and complaint-loss reporting reveals how monetized fraud and extortion translate into realized losses. That distinction matters because these datasets describe different populations, different denominators, and different categories of harm. In practice, the measurable landscape spans breaches, phishing, ransomware, credential theft, cloud misconfiguration, API exposure, third‑party compromise, fraud-linked cyber incidents, downtime, and regulatory pressure.
Cybersecurity Statistics refer to quantified data about cyber incidents, breaches, attack methods, victim impact, financial losses, industry exposure, regional variation, and broader trends in how digital threats affect organizations, users, and critical business operations.
Cybersecurity statistics measure multiple layers of reality that are frequently conflated in board reporting: breach frequency (confirmed data disclosure), incident volume (security events requiring response, including near-misses), attack vectors (how adversaries gain initial access), financial losses (direct theft, fraud, ransom, response cost), operational disruption (downtime, degraded services), identity compromise (credential theft, session/token abuse, privileged misuse), industry exposure (which business models are repeatedly targeted), regional distribution (differences shaped by reporting regimes and attacker focus), control failures (what broke first), and recovery burden (time to detect, contain, and restore).
A practical example clarifies why these metrics cannot be treated as synonyms:
This is why breach reports, complaint data, vendor telemetry, incident-response case series, and public disclosures are not identical measures. The same year can show declining “average breach cost” in a breach-cost study while showing rising complaint losses and rising ransomware presence in breach datasets because they are measuring different populations and different impact categories.
| Metric | 2024 | 2025 or Latest Available | Trend | Notes |
|---|---|---|---|---|
| Average cost of a data breach (global) | $4.88M | $4.44M | Down | Modeled breach cost; not a direct-theft measure. |
| Breach lifecycle (identify + contain) | 258 days | 241 days | Faster | Mean time to identify: 194→181 days; contain: 64→60 days. |
| Ransomware present in breaches | 32% | 44% | Up | “Presence” includes extortion; dataset is confirmed breaches. |
| Third-party involvement in breaches | 15% | 30% | Up | Indicates supplier/SaaS exposure; definitions vary. |
| Intrusion vectors: phishing share (EU dataset) | ~60% (Jul 2024–Jun 2025) | High | Observed intrusion vectors; not “confirmed breaches.” | |
| Intrusion vectors: vulnerability exploitation (EU dataset) | 21.3% (Jul 2024–Jun 2025) | Prominent | Patch window pressure on exposed services. | |
| Top exploited CVEs initially exploited as zero-days | 2/15 (2022 list) | 11/15 (2023 list) | Up | “Top exploited” signal; not a prevalence estimate. |
Across authoritative sources, the most actionable shift is compositional: identity-driven initial access persists, exploitation emphasizes edge devices and remote access, third‑party dependence is a measurable breach contributor, and extortion remains common but with changing outcomes. Methodology differences are decision-relevant: breach datasets, incident-response caseloads, and complaint portals produce valid but non-comparable trendlines.
Methodology differences matter more than the trend arrows:
Cost figures in cybersecurity often appear comparable while describing very different categories of harm. A board-useful interpretation separates direct theft, fraud outcomes, breach-response cost, recovery effort, and broader business disruption before reading any table.
A decision-grade cost view distinguishes at least five impact layers that enterprises often lump into “the breach cost”:
This separation is not semantic; it affects budgeting. Complaint losses can be massive without implying the same magnitude of “per-breach cost,” and per-breach cost can rise even when direct theft is low if regulatory and customer-loss elements dominate.
Cost discipline remains essential: modeled breach cost, ransomware recovery spend, and complaint-based loss are different lenses and should not be added together.
| Indicator | Value | Change YoY | Notes |
|---|---|---|---|
| Global average breach cost | $4.44M | Down from $4.88M | Modeled total cost. |
| United States average breach cost | $10.22M | Up from $9.36M | Regional cost peak in that dataset. |
| Mean breach lifecycle | 241 days | Down from 258 days | Faster detect/contain correlates with lower cost. |
| Detection and escalation cost category | $1.47M | Nearly 10% down | Includes assessment, crisis management, exec/board comms. |
| Cross‑environment data breaches | 30% share; $5.05M avg | Share down from 40% | Hybrid complexity correlates with higher cost and longer cycles. |
| Ransomware recovery cost (excluding ransom) | $1.53M average | Down from $2.73M | Survey-based; excludes broader revenue drag. |
| Victim-reported cybercrime losses (US) | $16.6B (2024) | +33% vs 2023 | Complaint-based; includes cyber-enabled fraud. |
Read together, these figures show why cybersecurity budgeting cannot rely on a single “headline cost” number. Breach-cost studies describe post-breach enterprise burden, ransomware recovery research isolates restoration expense, and complaint-loss reporting captures monetized victim harm at a different denominator. The budgeting implication is to map each number to a spending category: incident response, recovery readiness, fraud controls, legal/compliance exposure, and continuity engineering.
ENISA reports phishing at about 60% of observed intrusion vectors in its reporting period dataset., and the Internet Crime Complaint Center (IC3) reports phishing/spoofing as the most common cybercrime type by complaint volume. Operationally, phishing is valuable because it scales trust abuse across email, browsers, and collaboration tooling, enabling credential theft, help-desk impersonation, and downstream fraud or intrusion.
Ransomware is best modeled as a disruption and leverage operation with optional encryption. In the breach dataset, ransomware presence increased to 44% of reviewed breaches, and the median paid amount dropped while a majority of victims did not pay. That combination implies two realities at once: extortion-linked compromise remains common, but payer behavior is changing. Incident-response casework adds the resilience lens: nearly half of impacted victims were restored from backups in one case series, and proof of deletion was not universal in data-theft cases. The architectural implication is straightforward: prioritize segmentation, privileged access hardening, immutable backups, and restore validation over assumptions about negotiation outcomes. Supporting survey data also indicates high recovery cost even when ransom is excluded, reinforcing that restoration maturity is financially decisive.
Credential theft is a repeatable, low-noise “way in.” DBIR-linked research reports compromised credentials as initial access in 22% of breaches; it also finds the median daily share of credential stuffing at 19% of authentication attempts, and infostealer infection data shows only 49% of a user’s saved passwords were distinct in the median case. Microsoft identity telemetry shows why this persists: more than 97% of identity attacks are password spray or brute force, and modern MFA is assessed to prevent over 99% of identity-based attacks when deployed. Attackers increasingly pivot post-login (tokens/OAuth grants), so the control objective extends beyond password hygiene to session and consent governance.
Defender telemetry still sees massive malware volume (including 4.5 million net new malware file blocks per day), but high-impact intrusions increasingly minimize malware, using valid accounts and trusted tooling. This shifts detection toward identity, process, SaaS, and cloud control-plane behavior (what happens after login), not only file indicators.
Cloud and SaaS compromise is often an identity event first and an infrastructure event second: compromised credentials, excessive permissions, and misconfigurations can turn a single account into broad access. Incident-response data indicates that 29% of cases were cloud-related, and 21% included adverse impact to cloud environments or assets, showing that cloud is not just hosting; it is part of the attack path and sometimes the direct impact surface. Third-party dependence is increasingly measurable as well: breach research reports third-party involvement in 30% of breaches, while cost research places vendor and supply-chain compromise among the highest-cost pathways. Unit 42 analysis further reinforces the exposure problem, finding excessive permissions across nearly all sampled cloud identities and identity weakness across most investigations. For architects, the operational rule is clear: treat third-party identity, secrets, and integration trust as part of the perimeter.
| Vector / Method | Share of Incidents or Relevance | Avg Impact / Cost | Notes |
|---|---|---|---|
| Phishing / social engineering | ~60% (EU intrusion vectors) | Phishing vector averaged ~$4.8M | Different datasets; one is vectors, one is breach cost by vector. |
| Stolen / compromised credentials | 22% (breach initial access) | MFA prevents over 99% of identity-based attacks | Adoption and phishing resistance are decisive. |
| Vulnerability exploitation | 20% (breach initial access) | Median remediation 32 days (edge/VPN focus) | Exploitation concentrates on exposed services. |
| Supply chain / third-party compromise | 30% of breaches involved third parties | ~$4.91M avg breach cost (vendor/supply chain) | Multiplies blast radius and recovery complexity. |
| Web compromise / malicious web | 9% (IR initial vector) | Browser-layer becomes a common delivery interface | Includes malvertising/SEO poisoning. |
| Identity-driven initial access | 65% (IR caseload) | Over-permissioning widespread in cloud identities | “Valid access” accelerates movement and blends in. |
These “shares” should be treated as dataset-specific, not global prevalence. For example, the Mandiant M-Trends 2025 report shows exploitation (33%), stolen credentials (16%), and email phishing (14%) as leading initial infection vectors in its incident response investigations.
Operationally, modern incidents commonly chain: initial access → persistence and privilege escalation (often via identity) → lateral movement → data theft, fraud, sabotage, or extortion. This aligns with MITRE ATT&CK patterns: the “break in” phase is often replaced by “log in,” and the control problem becomes detecting and constraining valid-but-abusive activity across identity, privilege escalation, and lateral movement.
| Industry | Relative Exposure Level | Typical Impact Pattern | Key Notes |
|---|---|---|---|
| Healthcare | High | Clinical disruption + identity fraud + high breach cost | Highest average breach cost in the latest dataset. |
| Finance | High | Fraud loss + regulatory exposure + credential-driven compromise | High breach cost; heavily targeted in IR datasets. |
| Technology | Medium–High | SaaS/cloud control-plane abuse + IP and credential theft | High credential density and API surface. |
| Manufacturing | Medium–High | Downtime pressure + supply-chain ripple + ransomware | Low tolerance for disruption. |
| Retail | Medium | Service disruption + help-desk abuse + data theft | Customer-facing downtime is immediate. |
| Government / Public sector | Medium | Service disruption + espionage + citizen data exposure | Mixed motives and legacy constraints. |
Industries differ because business models and architecture differ: regulated data increases notification and legal overhead; payment workflows increase fraud leverage; legacy/OT adjacency increases recovery complexity; identity sprawl increases valid-account exposure.
| Region | Key Trend | Cost or Impact Signal | Notes |
|---|---|---|---|
| North America | High modeled breach costs + high fraud reporting | US avg breach cost $10.22M; losses $16.6B (2024) | Cost model vs complaint losses. |
| Europe | Reporting regimes + social engineering dominance | Phishing ~60%, exploitation 21.3% | Observed vectors, not breach confirmations. |
| United Kingdom | Retail disruption + identity recovery abuse | Help-desk impersonation pattern in public reporting | Guidance emphasizes help-desk controls. |
| Australia | High hotline volume and incident response load | 42,500 hotline calls; 1,200 incidents (FY2024–25) | National assist statistics. |
| Singapore | Rising phishing and ransomware case volume | 6,100 phishing cases (2024); 159 ransomware cases (2024) | Country reporting. |
| Africa | Cybercrime share rising under capacity constraints | >30% of reported crime cyber-related in some subregions | Measures crime mix, not breach rate. |
Regional comparisons must account for underreporting and visibility bias: mandatory reporting and mature incident response can raise observed counts without implying higher attack rates.
Seen through a board lens, signal concentration differs by region: in North America (especially the United States), modeled breach cost and monetized-loss reporting are both high; in Europe and the United Kingdom, reporting obligations and high-profile digital disruption shape visibility; in Australia and Singapore, national reporting highlights fraud and ransomware patterns; and across Africa, crime mix and capacity constraints influence what’s captured.
Marks & Spencer and The Co-operative Group (retail, 2025): Reporting indicates attackers impersonated employees to persuade IT help desks to reset passwords, enabling access and sustained disruption; later reporting described arrests connected to the incidents. Strategic takeaway: account recovery is a privileged pathway and should be treated like a control plane.
Ingram Micro (IT distribution, 2025): The company disclosed ransomware on internal systems and took certain systems offline while investigating with external experts and notifying law enforcement. Strategic takeaway: operational disruption at infrastructure intermediaries can cascade to downstream enterprises.
Jaguar Land Rover (manufacturing, 2025): Reporting described severe disruption to retail and production activities and multi‑week factory shutdown and phased restart. Strategic takeaway: downtime sensitivity amplifies extortion leverage and supplier ecosystem risk.
These examples are included to illustrate control failure patterns and business consequences, not to replace the article’s dataset-led analysis.
Identity-first attack chains are now the most reliable path to enterprise impact: Unit 42 places identity weaknesses in nearly 90% of investigations; Microsoft shows identity attack volume dominated by password spray/brute force; and public reporting shows help‑desk reset workflows as an intrusion path.
Vulnerability exploitation continues to pressure the patch window: DBIR identifies exploitation among the top initial access vectors, and the joint “top exploited vulnerabilities” advisory shows most top CVEs in 2023 were first exploited as zero-days, driven heavily by edge and infrastructure products.
Intrusions are faster and more “malware-free”: CrowdStrike reports 82% malware-free detections and a 29-minute average breakout time in 2025, pushing programs to correlate identity, SaaS, and cloud telemetry rather than relying on file indicators.
Time-to-impact is compressing: incident data shows that compromise-to-exfiltration can unfold in hours rather than days, with first-quartile outcomes under five hours and a meaningful subset under one hour. That changes the operating model from “detect eventually” to “contain before business impact.”
| Attribute | Cybersecurity Statistics | Breach Statistics | Cybercrime Statistics |
|---|---|---|---|
| Primary Focus | Broad incident and impact domain | Confirmed breaches and data exposure | Criminal victimization and loss reporting |
| Typical Metrics | Vectors, containment time, downtime, cost, control gaps | Records exposed, breach causes, notification timing | Complaints, loss dollars, scam types |
| Financial Emphasis | Modeled cost + business impact | Post-breach cost categories | Direct victim loss and fraud outcomes |
| Reporting Source | Telemetry, IR casework, breach datasets, regulators | Investigations and disclosures | Complaint portals and law enforcement |
| Business Relevance | Control prioritization and architecture | Privacy and liability planning | Fraud controls and consumer/business protection |
| Common Limitation | Denominator mismatch | Underreporting, varied definitions | Underreporting, self-reported loss |
For enterprise decision-making, the practical question is not which dataset is “right,” but which one answers the decision in front of you: architecture priorities, breach liability, fraud controls, or resilience investment.
Identity controls should dominate control prioritization and testing. Treat phishing-resistant MFA for high-value roles, hardened help-desk resets, and token/OAuth governance as Tier‑0, because they reduce the probability of credential-led intrusion and limit attacker progression after authentication.
Email and collaboration security should be funded as an identity control. The “success metric” is not blocked emails; it is reduced credential entry on malicious pages and reduced fraud outcomes (including pretexting/BEC patterns).
Exposure management must treat edge and management planes as Tier‑0. Exploitation is a leading initial access route, and many top exploited vulnerabilities were initially exploited as zero-days. Use the Cybersecurity and Infrastructure Security Agency KEV signal as a prioritization input, enforce short patch SLAs for VPN/IdP/edge gateways, and add compensating controls when patching lags.
Cloud and API governance is identity engineering plus integration governance. Over‑permissioned cloud roles and unmanaged machine identities increase lateral movement; hybrid data breaches cost more and take longer to contain. Invest in least privilege, just‑in‑time access, secrets hygiene, and API authorization testing as part of the core security program.
Detection engineering and incident response should be designed for speed and malware‑minimal tradecraft. Integrate EDR/XDR with identity, SaaS, and cloud telemetry, and validate time-to-detect/contain/restore with realistic adversary emulation and recovery drills.
Board reporting should translate these statistics into expected loss and downtime scenarios tied to business services, not technical artifact counts.
Phishing-resistant MFA and hardened recovery. Deploy FIDO2/WebAuthn or passkeys for admins, developers, and finance roles, and treat password/MFA resets as privileged operations with strong verification, delay options, and logging.
Privileged access hardening. Remove standing admin rights, implement just‑in‑time elevation, separate admin identities, and monitor for token/OAuth misuse to reduce attacker progression after initial access.
Patch management. Prioritize known-exploited vulnerabilities, enforce short SLAs for edge/VPN/IdP, and apply compensating controls (network restrictions, segmentation, enhanced monitoring) when patching is delayed.
Email and collaboration security. Combine anti-phishing controls with safe-link handling, attachment isolation, and high-friction verification for payment and vendor-change workflows.
EDR/XDR telemetry and detection engineering. Treat identity, SaaS audit logs, and cloud control-plane logs as first-class signals alongside endpoints, because intrusions increasingly reduce malware and operate via valid accounts.
Cloud configuration governance and API security validation. Continuously enforce least privilege across human and machine identities, rotate secrets, and validate API authorization through security testing to reduce integration abuse and data exposure.
Third-party access control. Minimize and time-bound vendor privileges, review OAuth apps and integrations, and require incident notification SLAs, because third-party involvement is a measured breach contributor.
Backup isolation, restore testing, security awareness, and exercises. Assume extortion includes disruption; make backups immutable, rehearse restores, run awareness measured by reporting and response speed, and execute tabletop exercises that include supplier compromise and data theft without encryption.
For U.S. security teams, continuous penetration testing and adversary emulation should focus on identity-based attack chains (help-desk resets, pretexting paths, token theft), representative edge exploitation paths, and cloud control-plane abuse, measuring time-to-detect, time-to-contain, and time-to-restore rather than “findings count.”
Expected Loss = Probability × Impact.
Cybersecurity statistics inform both terms: probability indicators (credential abuse, phishing, exploitation, third parties) and impact indicators (breach cost and containment time).
Illustrative example (numbers are illustrative, not sourced): if you estimate a 10% annual probability of a materially disruptive incident and a $5M impact when it occurs (downtime + response + recovery), expected annual loss is $500k. Controls can be compared by how much they reduce probability (identity hardening, exposure management) and/or reduce impact (segmentation, backup restore capability).
Quantified measurements of cyber incidents, breaches, attack methods, and impacts, drawn from breach investigations, incident response casework, telemetry, and victim reporting.
It depends on whether you measure targeting or cost. In breach-cost data, healthcare and finance have high average breach costs; incident response datasets show heavy targeting of financial and business services.
Modeled breach costs average in the multi‑million‑dollar range and vary by region and sector; ransomware recovery spend can also be seven figures even excluding ransom.
Across major datasets, identity attacks, phishing/social engineering, vulnerability exploitation, and ransomware/extortion remain central; third‑party compromise is a growing contributor.
Breach statistics focus on confirmed breaches and data exposure; cybersecurity statistics include broader disruption and attack activity that still create business loss without a confirmed breach.
Yes. Reporting varies by jurisdiction and incident type. Mandatory reporting increases visibility but also changes trendlines by expanding what is counted.
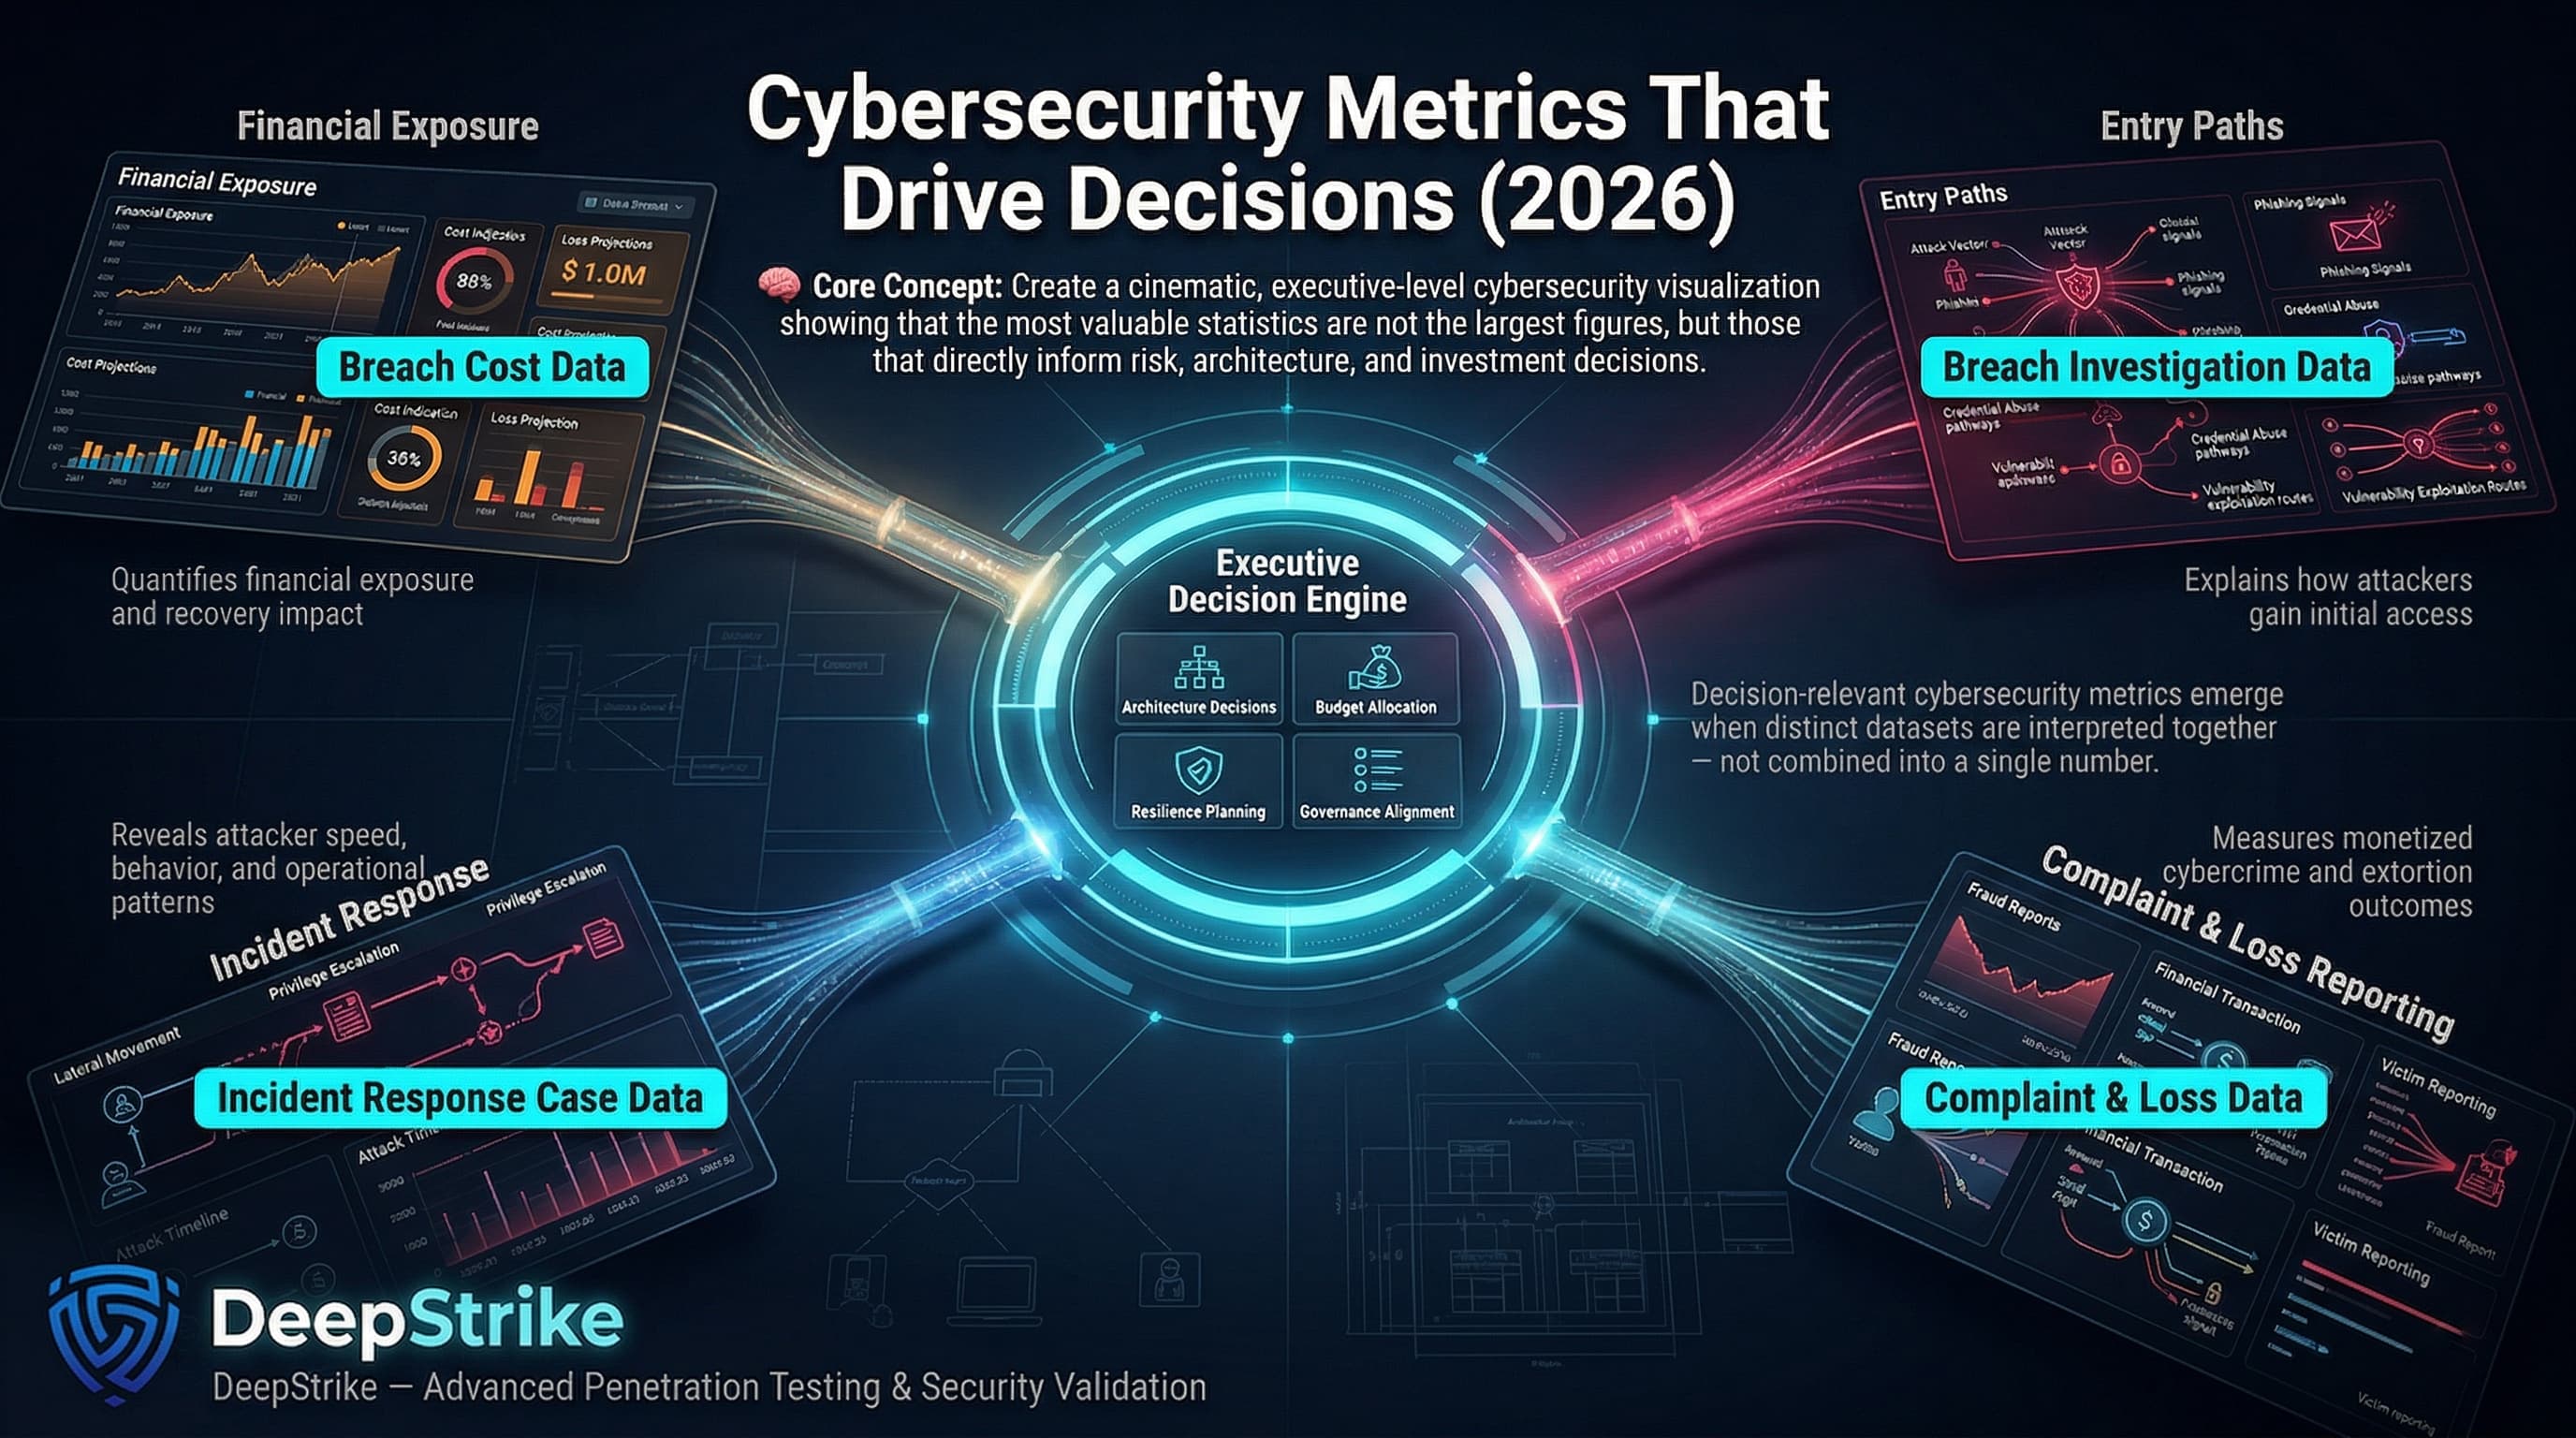
The most useful cybersecurity statistics for 2025–2026 are not the biggest numbers, but the most decision-relevant ones. Breach cost data informs financial exposure. Breach datasets explain entry paths. Incident-response casework shows attacker speed and operational mechanics. Complaint-loss reporting quantifies monetized fraud and extortion. When those datasets are kept separate and interpreted together, they support better architecture, budgeting, resilience, and governance decisions.
Mohammed Khalil is a Cybersecurity Architect at DeepStrike, specializing in advanced penetration testing and offensive security operations. With certifications including CISSP, OSCP, and OSWE, he has led numerous red team engagements for Fortune 500 companies, focusing on cloud security, application vulnerabilities, and adversary emulation. His work involves dissecting complex attack chains and developing resilient defense strategies for clients in the finance, healthcare, and technology sectors.

Stay secure with DeepStrike penetration testing services. Reach out for a quote or customized technical proposal today
Contact Us