November 4, 2026
Updated: November 5, 2026
Verified numbers on shadow IT and shadow AI from IBM, Verizon, Gartner, Microsoft and Cisco, what each study measures, and how shadow assets show up on your attack surface.

Mohammed Khalil
Shadow IT statistics for 2026 describe a visibility problem that AI has made more expensive. Gartner expected 75% of employees to acquire, modify or create technology outside IT's visibility by 2027, up from 41% in 2022. IBM's 2026 Cost of a Data Breach Report found that security incidents involving shadow AI more than doubled to 43%, from 20% a year earlier, and that those incidents averaged USD 5.39 million. Verizon's 2026 DBIR counts 45% of employees as regular AI users on corporate devices. Below are the verified numbers, what each measures, and how to find your own shadow assets.
Every figure below was checked against the publisher's own page or report on 4 November 2026. The studies measure different things, so read the "What it measures" column before comparing two rows.
| Statistic | Source and date | What it measures |
|---|---|---|
| 75% of employees will acquire, modify or create technology outside IT's visibility by 2027, up from 41% in 2022 | Gartner, press release, 28 March 2023 | Analyst forecast (strategic planning assumption) |
| 43% of security incidents studied involved shadow AI, up from 20% the year before | IBM Cost of a Data Breach Report 2026, 29 July 2026 | 602 breached organizations, March 2025 to February 2026 |
| USD 5.39 million average cost of shadow AI incidents (USD 4.63 million in 2025) | IBM Cost of a Data Breach Report 2026 | Same breach sample |
| USD 201,165 added to the average breach cost by poor visibility into the number and location of applications (shadow IT) | IBM Cost of a Data Breach Report 2026 | Cost factor measured against the USD 4.99 million average |
| 68% of breached organizations lacked AI governance to manage AI or detect shadow AI (63% in 2025) | IBM Cost of a Data Breach Report 2026 | Same breach sample |
| 45% of employees are regular users of AI on corporate devices, up from 15% | Verizon 2026 Data Breach Investigations Report | Partner telemetry on corporate devices |
| 67% of users access AI services through non-corporate accounts on corporate devices | Verizon 2026 Data Breach Investigations Report | Same telemetry |
| 69% of organizations suspect or have evidence that employees use prohibited public GenAI | Gartner survey of 302 cybersecurity leaders, March to May 2025 (released 19 November 2025) | Survey of security leaders |
| 60% of organizations lack confidence that they can identify unapproved AI tools in their environment | Cisco 2025 Cybersecurity Readiness Index, 7 May 2025 | Survey of 8,000 leaders in 30 markets |
| 78% of AI users bring their own AI tools to work | Microsoft and LinkedIn 2024 Work Trend Index, 8 May 2024 | Survey of 31,000 workers in 31 markets |
| 46% of infostealer-compromised systems holding corporate logins were non-managed devices | Verizon 2025 Data Breach Investigations Report | Infostealer credential logs |
| Business units control 81% of SaaS spend; IT directly manages 15% | Zylo 2026 SaaS Management Index, 29 January 2026 | Vendor dataset of 40 million licenses and USD 75 billion in spend |
| More than 40% of enterprises will have security or compliance incidents linked to unauthorized shadow AI by 2030 | Gartner, press release, 19 November 2025 | Analyst forecast |
Primary sources for each row are linked in the sections below and listed under Sources and References.
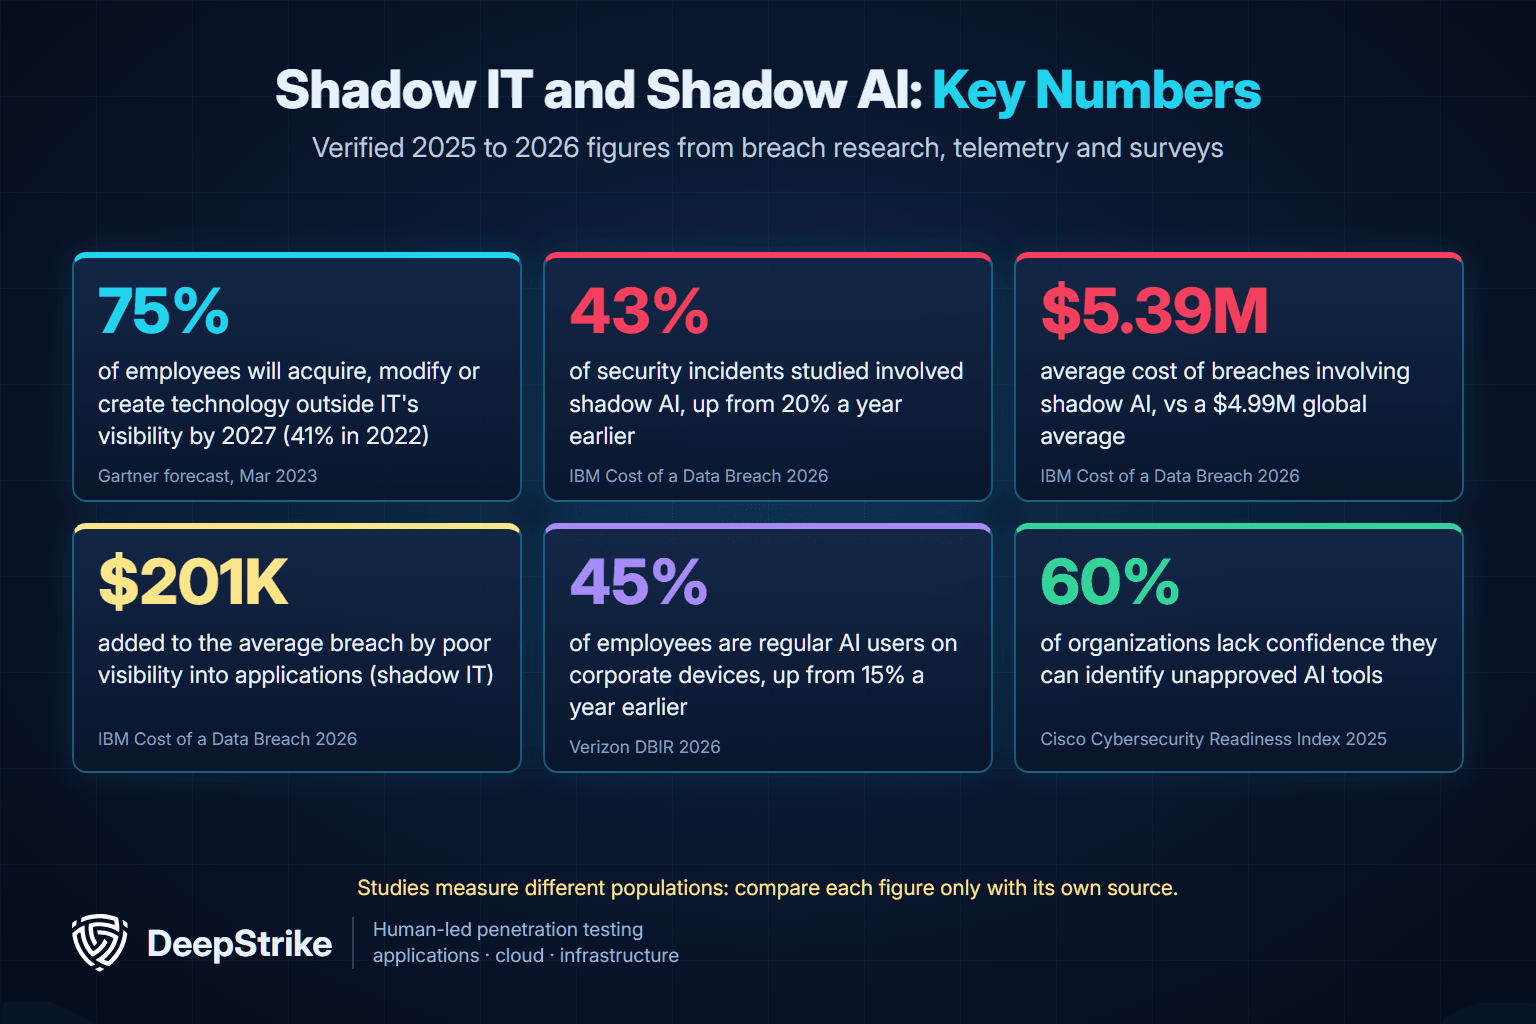
Three kinds of evidence sit in this table, and they should not be blended. IBM measures organizations that already suffered a breach, so its percentages describe breached companies, not all companies. Verizon and Netskope report telemetry from security products, which shows real behavior but only inside the customers those products cover. Gartner, Cisco and Microsoft report surveys and forecasts. A forecast is a planning assumption, not a measurement, and a survey answer is a self-report. None of these numbers can be added together into one "shadow IT rate."
Shadow IT is any hardware, software, cloud service or account that people use for work without the knowledge or approval of the team responsible for securing it. Typical examples are a SaaS tool paid for on a corporate card, a marketing site launched by an agency on a company subdomain, a test database left reachable from the internet, or a personal file-sharing account used for work documents.
Shadow AI is the same pattern applied to AI. IBM's 2026 report defines it as workers using unapproved AI. In practice it covers employees pasting data into consumer chatbots, signing in to AI services with personal accounts, connecting AI plug-ins or agents to company data without review, and teams deploying models or AI APIs outside the approved inventory.
Shadow IT is not always reckless. Gartner frames it as a shift of technology work into business units, and most shadow tools are adopted to get work done faster. The security problem is narrower: an asset nobody inventories is an asset nobody patches, monitors, tests or offboards. That is why the statistics below focus on visibility, cost and exposure rather than on how often employees break a policy.
Gartner's March 2023 cybersecurity predictions put the scale plainly: "By 2027, 75% of employees will acquire, modify or create technology outside IT's visibility – up from 41% in 2022." The Gartner press release presents this as a strategic planning assumption. The 41% is a 2022 survey-based estimate and the 75% is a forecast; Gartner's underlying research is behind a paywall, so this page quotes only the public release.
SaaS purchasing data tells the same story from the finance side. Zylo's 2026 SaaS Management Index, which the vendor says is built on more than 40 million SaaS licenses and USD 75 billion in spend under management, reports that business units now control 81% of SaaS spend while IT directly manages just 15%. Expense-based SaaS spend rose 267% year over year, and ChatGPT became the most expensed application (Zylo announcement, 29 January 2026). Zylo also reports that large enterprises add an average of 21 applications per month. These are a SaaS management vendor's customer figures, not a census of all companies, but they show why an inventory taken once a year goes stale.
Netskope's Cloud and Threat Report 2026, based on anonymized data from its platform between 1 October 2024 and 31 October 2025, found that 31% of users in the average organization upload data to personal cloud apps every month, and that 60% of insider threat incidents involve personal cloud app instances (Netskope Cloud and Threat Report 2026). Regulated data made up 54% of the data policy violations linked to personal cloud apps, followed by intellectual property (22%), source code (15%) and passwords and API keys (8%).
Unmanaged devices are the hardware side of shadow IT. In the Verizon 2025 DBIR executive summary, Verizon's analysis of infostealer credential logs found that 46% of compromised systems with corporate logins in their data were non-managed and held both personal and business credentials. Verizon attributes these most likely to bring-your-own-device programs or company devices used outside policy. Credentials stolen from a device that IT does not manage are invisible to endpoint controls until someone uses them. Our insider threat statistics cover the non-malicious insider side of the same problem.
IBM's 2026 Cost of a Data Breach Report analyzed 30 factors that raise or lower breach costs against the USD 4.99 million global average. "Lack of visibility into the number and location of applications (shadow IT)" added USD 201,165 to the average breach. Only supply chain breaches (USD 227,250) and security system complexity (USD 208,265) added more, with noncompliance with regulations close behind at USD 201,112 (IBM Cost of a Data Breach Report 2026). IBM measures each factor in isolation, so the factors cannot be summed into a single figure.
| Factor in IBM's 2026 analysis | Effect on the USD 4.99 million average breach |
|---|---|
| Supply chain breach (business partner compromise) | +USD 227,250 |
| Security system complexity | +USD 208,265 |
| Lack of visibility into the number and location of applications (shadow IT) | +USD 201,165 |
| Noncompliance with regulations | +USD 201,112 |
| Offensive security testing (red teaming, pen or vulnerability testing) | -USD 211,339 |
| Identity and access management | -USD 225,622 |
| DevSecOps approach | -USD 253,805 |
The same analysis shows the other side of the ledger. Offensive security testing, which IBM defines as red teaming, penetration testing or vulnerability testing, was associated with USD 211,339 lower breach costs. In IBM's 2025 edition, attack surface management tools were associated with USD 160,547 lower costs. These are associations in a breach sample, not proof that any one control causes a saving, but they point the same way: finding and testing what you own pays.
For the full cost picture across industries and regions, see our analysis of the cost of a data breach.
Shadow IT usually means shadow data. IBM's 2024 report found that more than one-third of breaches involved shadow data, meaning data stored in unmanaged sources, and that 40% of breaches involved data stored across multiple environments (IBM newsroom, 30 July 2024). In the 2026 report, breached data stored across multiple locations again took the longest to identify and contain, at 256 days, an improvement from 277 days the year before. Data that sits in an unknown SaaS tenant or a forgotten bucket is harder to find during an investigation as well as before one. Our cloud security statistics break down how misconfiguration and identity drive those cloud exposures.
Shadow AI statistics now dominate shadow IT research, because AI tools spread faster than any earlier category of unsanctioned software. This section stays on one question: how unsanctioned AI use creates exposure. For AI adoption, model attacks and AI testing data more broadly, see our AI security statistics. Our AI security guide explains where shadow AI fits in an AI security program.
Most organizations say they cannot see it well. In the Cisco 2025 Cybersecurity Readiness Index, a double-blind survey of 8,000 private sector security and business leaders in 30 markets, 60% said they lack confidence in their ability to identify unapproved AI tools in their environments. Smaller businesses struggled most (68%, compared with 51% of medium and large enterprises). Sixty percent said they cannot see the specific prompts or requests employees make to GenAI tools, and 22% of companies said employees have unrestricted access to publicly available GenAI tools.
Governance is moving backward among breached organizations. IBM's 2026 report found 68% of breached organizations lacked AI governance to manage AI or detect shadow AI, up from 63% in 2025. Only 32% had policies in place, down from 37%. Among the governance measures organizations reported, regular audits for unsanctioned AI fell to 29% from 34%, and only 19% said their governance and security teams coordinate.
Verizon's 2026 DBIR found that shadow AI became the third most common non-malicious insider action in its data loss prevention (DLP) dataset in 2025, a fourfold increase in share from the previous year. Source code was the data type most often submitted to external GenAI models, followed by images and other structured data. In 3.2% of DLP policy violations, research and technical documentation was uploaded to unauthorized AI systems. The figure is based on 858,440 untrusted DLP events that targeted GenAI tools.
Source code is a particular exposure for software companies. Code pasted into a consumer AI tool can carry hostnames, internal API routes, configuration values and occasionally credentials. Once it leaves, the organization loses control of where it is stored and how long it is kept, and the leak usually leaves no trace in the systems the security team monitors.
IBM's breach data is the clearest measure of what shadow AI costs once something goes wrong.
| Measure (IBM Cost of a Data Breach) | 2025 report | 2026 report |
|---|---|---|
| Security incidents involving shadow AI | 20% | 43% |
| Average cost of breaches involving shadow AI | USD 4.63 million | USD 5.39 million |
| Global average cost of a data breach | USD 4.44 million | USD 4.99 million |
| Data loss or compromise in shadow AI incidents | 44% | 49% |
| Operational disruption | 39% | 42% |
| Reputational damage | 23% | 35% |
| Increased security costs | 41% | 32% |
| Regulatory fines | Not asked | 21% |
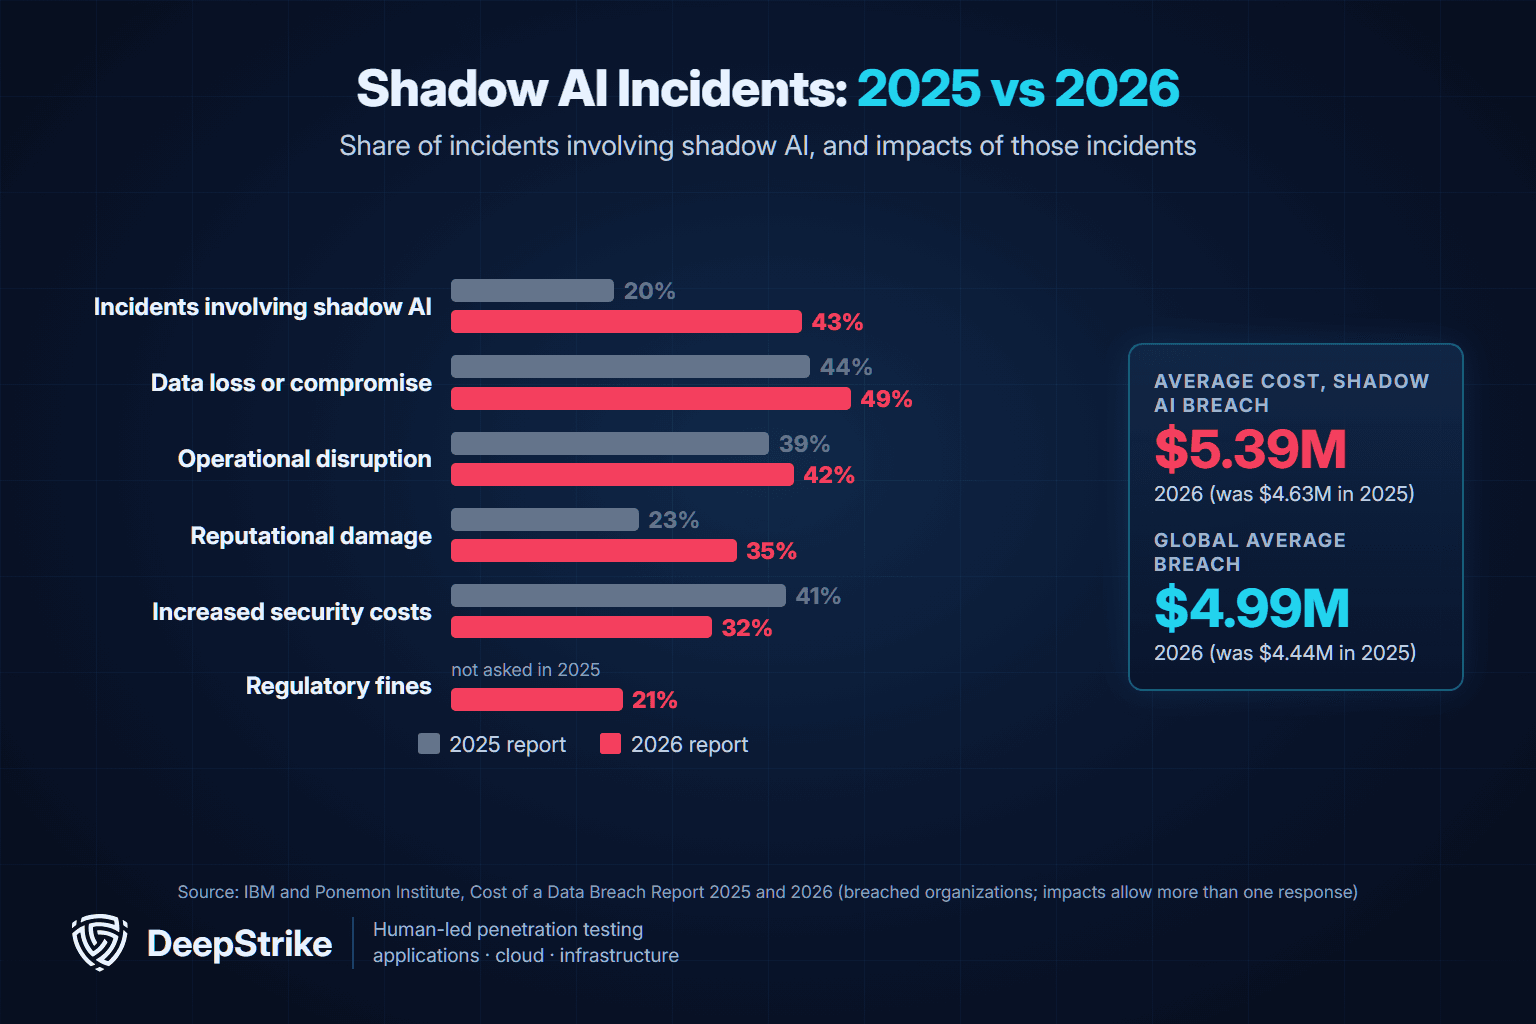
Three points stand out. First, the share of incidents involving shadow AI more than doubled in a single study cycle. IBM's 2025 report described its 20% as the share of studied organizations that reported a breach involving shadow AI, with a further 11% unsure; IBM's 2026 report describes the 43% as the share of security incidents involving shadow AI. Second, shadow AI incidents cost about USD 400,000 more than the 2026 global average (USD 5.39 million against USD 4.99 million; our calculation from IBM's figures). Third, about one in five shadow AI incidents in 2026 ended with a regulatory fine, a question IBM asked for the first time.
The 2025 edition adds detail the 2026 edition does not repeat. Organizations with high levels of shadow AI saw average breach costs of USD 4.74 million, USD 670,000 more than organizations with low levels or none (USD 4.07 million). In shadow AI incidents, customer personal data was compromised 65% of the time, against 53% across all breaches, and intellectual property 40% of the time, against 33% overall (IBM Cost of a Data Breach Report 2025, PDF).
Forecasts belong in a separate column from measurements. Gartner predicts that by 2030 more than 40% of enterprises will experience security or compliance incidents linked to unauthorized shadow AI, and recommends enterprise-wide AI usage policies, regular audits for shadow AI activity and GenAI risk evaluation in SaaS assessments. IBM's measured 43% describes breached organizations in 2025 and early 2026, so it is not evidence that Gartner's forecast has already been met.
The next layer of shadow AI is not a chatbot tab. It is an AI agent, plug-in or connector that someone wires into company systems with its own credentials. IBM's 2026 report found that fewer than half of organizations (46%) secure non-human identities in AI workflows, and only 40% use access controls on AI models and data. Among organizations that reported a breach of their AI models or applications, 92% lacked proper AI access controls, and the most common root causes were compromised APIs, applications or plug-ins and cloud misconfigurations affecting AI workloads.
An unapproved agent with a long-lived API key is shadow IT with the ability to act. If you are deploying agents or connecting them through the Model Context Protocol, our guides to agentic AI security and MCP security explain how to test what an agent can reach and do. For measured hijacking rates and how many organizations have no defined limits on agent access, see our AI agent security statistics.
Shadow IT matters to an attacker only when it is reachable. Most shadow assets leave public traces: DNS records, certificates, login pages, exposed storage and new API endpoints. The table below maps each statistic to the external signal it usually produces and to what a tester should validate. It is DeepStrike's method guidance, not data from the cited studies.
| Where shadow IT hides | Statistic that signals the risk | External signal | What testing should validate |
|---|---|---|---|
| SaaS bought by business units | Business units control 81% of SaaS spend (Zylo 2026) | Company subdomains pointed at SaaS providers, SSO-less login pages, OAuth apps | Whether the tenant uses company SSO and MFA, and whether a dangling DNS record allows a subdomain takeover |
| Forgotten web apps, staging and test systems | Shadow IT visibility gap adds USD 201,165 per breach (IBM 2026) | Hosts in certificate transparency logs and DNS that are missing from the asset register | Exposed admin panels, default credentials, outdated software and debug endpoints |
| Undocumented APIs | Compromised APIs, apps or plug-ins were a top root cause of AI breaches (IBM 2026) | New endpoints in public JavaScript, API documentation or GraphQL schemas | Authentication, object-level authorization and data exposure on each new endpoint |
| Unmanaged devices | 46% of infostealer-compromised systems with corporate logins were non-managed (Verizon 2025) | Corporate credentials in infostealer logs and breach dumps | Whether leaked credentials still work and whether MFA and session controls stop reuse |
| Shadow AI tools and agents | 43% of incidents involved shadow AI (IBM 2026) | AI connectors, browser extensions and API keys tied to company data | What data an AI integration can reach and whether its keys are scoped and revocable |
| Registered and lookalike domains | Not measured by the cited studies; a common external-discovery gap | Domains registered by teams or agencies, and lookalike domains registered by others | Expired or unmonitored domains, email authentication records and impersonation risk |
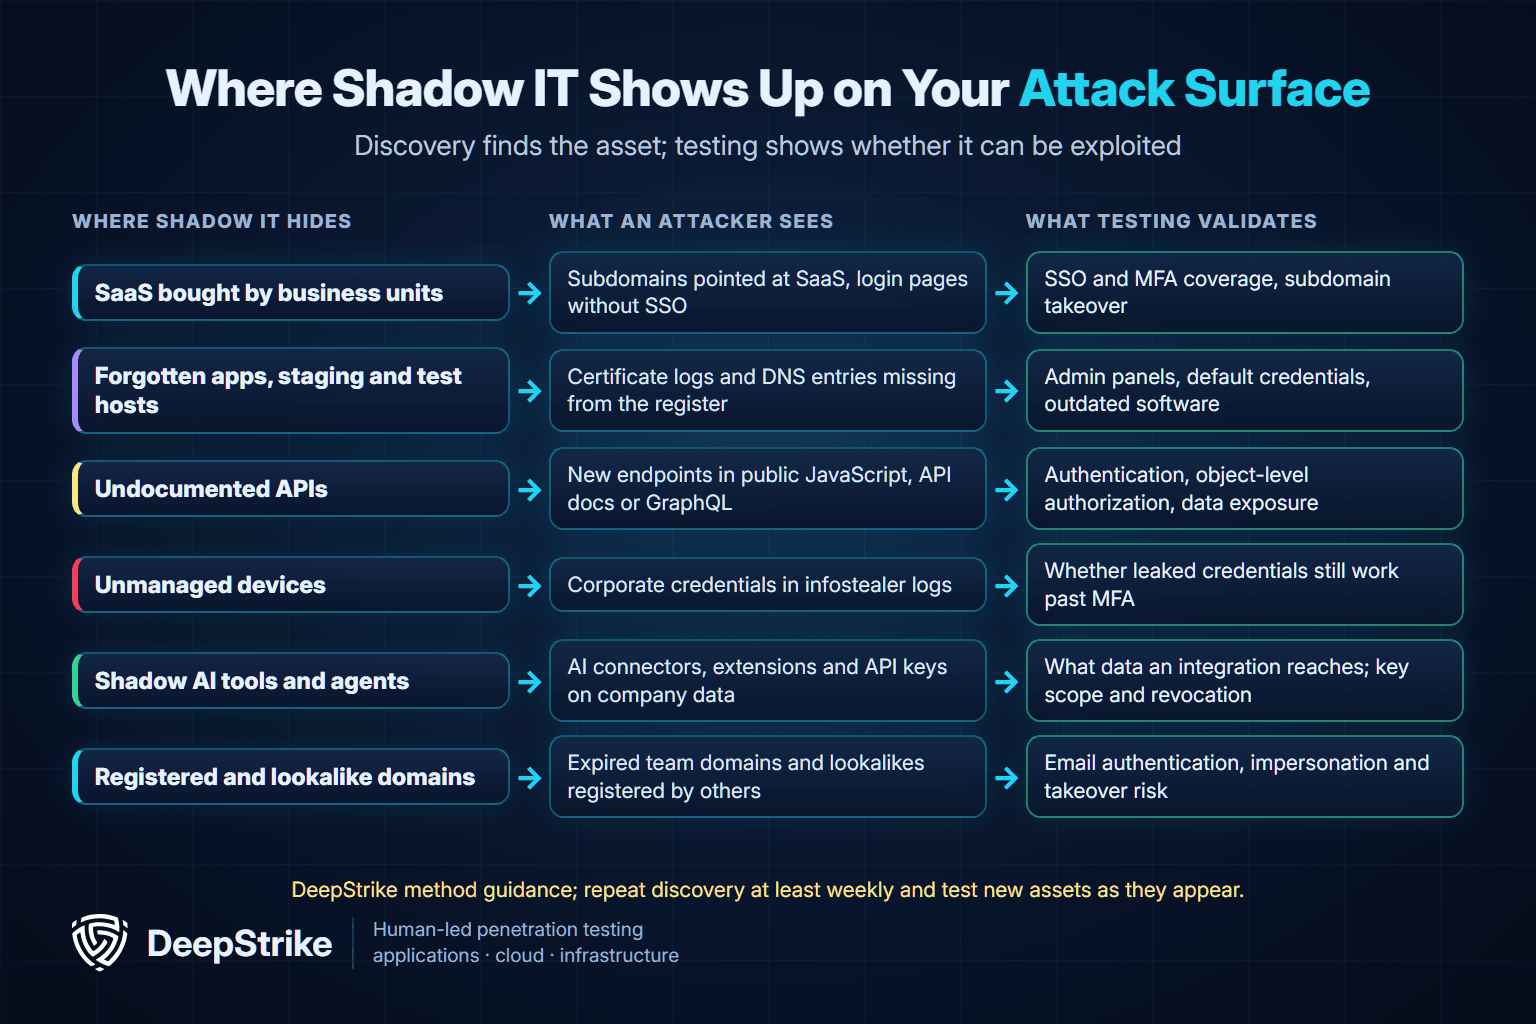
Two of these rows depend on external discovery. Our attack surface management guide explains how external discovery finds hosts that are missing from internal inventories and why each finding still needs validation. Domains deserve their own watch list: teams register campaign domains and forget them, and attackers register lookalikes of yours. Our guide to homoglyph attacks shows how lookalike domains are built and monitored.
US federal agencies already work to a discovery cadence. CISA's Binding Operational Directive 23-01, issued 3 October 2022, required federal civilian agencies by 3 April 2023 to run automated asset discovery every 7 days and to start vulnerability enumeration across all discovered assets every 14 days. The directive excludes ephemeral assets such as containers and third-party-managed SaaS, which is a useful reminder that IP-based discovery alone will not find SaaS shadow IT. Private companies are not bound by the directive, but its weekly cadence is a reasonable benchmark.
The statistics point to one practical conclusion: you cannot secure assets you have not found, and you cannot trust an inventory that is checked once a year. This is a starting sequence that a security team can run in about a month. It is DeepStrike's method guidance, not a requirement from any standard.
Selection. We included a statistic only if we could read it on the original publisher's page or report and record its date, sample and method. We prioritized independent breach research (IBM and Ponemon Institute, Verizon), analyst firms (Gartner), large surveys by technology companies (Microsoft, Cisco) and US government guidance (CISA). We also used two vendor datasets with published scope (Netskope telemetry and the Zylo SaaS Management Index) and labeled them as vendor data. We excluded figures that appear only in vendor blogs without a traceable original study, figures attributed to Gartner that we could not find in a public Gartner release, and paywalled analyst research we could not read.
Report years. Report titles carry the publication year, not the year of the events. IBM's 2026 report covers breaches from March 2025 to February 2026, and Verizon's 2026 DBIR covers incidents from October 2024 to November 2025. Netskope's 2026 report covers October 2024 to October 2025.
Calculations. The only derived figure on this page is the USD 400,000 difference between IBM's 2026 shadow AI breach cost (USD 5.39 million) and its 2026 global average (USD 4.99 million). All other numbers are quoted as published.
| Source | Publisher type | Data period | Sample or dataset | Method |
|---|---|---|---|---|
| IBM Cost of a Data Breach Report 2026 | Breach research (Ponemon Institute, sponsored and analyzed by IBM) | March 2025 to February 2026 | 602 breached organizations; 3,558 interviews | Interviews about real breaches |
| IBM Cost of a Data Breach Report 2025 | Breach research | March 2024 to February 2025 | 600 breached organizations | Interviews about real breaches |
| Verizon 2026 DBIR | Incident and breach research | October 2024 to November 2025 | More than 31,000 incidents; DLP subset of 858,440 GenAI events | Incident data and partner telemetry |
| Verizon 2025 DBIR | Incident and breach research | 1 November 2023 to 31 October 2024 | 22,052 incidents; infostealer logs | Incident data and partner telemetry |
| Gartner press releases | Analyst firm | 2022 baseline; March to May 2025 survey | 302 cybersecurity leaders (2025) | Survey and forecasts |
| Microsoft and LinkedIn Work Trend Index 2024 | Technology company survey | 15 February to 28 March 2024 | 31,000 workers in 31 markets | Online survey by Edelman Data and Intelligence |
| Cisco 2025 Cybersecurity Readiness Index | Technology company survey | January to February 2025 | 8,000 leaders in 30 markets | Double-blind survey |
| Netskope Cloud and Threat Report 2026 | Security vendor telemetry | 1 October 2024 to 31 October 2025 | Netskope One platform customers | Anonymized usage data |
| Zylo 2026 SaaS Management Index | SaaS management vendor data | Published 29 January 2026 | 40 million licenses; USD 75 billion spend; 218 IT leaders surveyed | Customer spend data and survey |
| CISA BOD 23-01 | US federal directive | Issued 3 October 2022 | Federal civilian agencies | Binding requirements |
Limits. IBM's percentages describe breached organizations, not all organizations. Telemetry reflects the customers of the vendor that collected it. Surveys reflect what respondents say. None of these sources gives a single, representative US shadow IT rate, and no such rate is claimed here.
Gartner estimated that 41% of employees acquired, modified or created technology outside IT's visibility in 2022 and forecast 75% by 2027. For AI specifically, Microsoft's 2024 Work Trend Index found 78% of AI users bring their own AI tools to work, and Verizon's 2026 DBIR counts 45% of employees as regular AI users on corporate devices.
IBM's 2026 Cost of a Data Breach Report found that a lack of visibility into the number and location of applications (shadow IT) added USD 201,165 to the USD 4.99 million average breach cost. Breaches involving shadow AI averaged USD 5.39 million in the same report.
IBM's 2026 report found security incidents involving shadow AI rose to 43% from 20%, at an average cost of USD 5.39 million, and 21% of those incidents led to a regulatory fine. Verizon's 2026 DBIR found 67% of users access AI services with non-corporate accounts on corporate devices. Gartner forecasts that more than 40% of enterprises will have a shadow AI incident by 2030.
Shadow AI is a subset of shadow IT, but it moves data faster. A personal file-sharing account stores data; an AI tool can also process it and return it in new forms, often under a personal account. IBM's data shows shadow AI breaches cost more than the global average, and Verizon found source code is the data type most often sent to unauthorized AI tools.
Combine three views: external discovery of domains, subdomains, certificates and exposed services; finance data on expensed and card-paid software; and identity, DLP or proxy logs that show which SaaS and AI services people actually use. Then validate the assets you find with testing, because discovery alone does not show whether an asset is exploitable.
A penetration test can find shadow IT within its scope, especially when it starts with external reconnaissance and includes newly discovered hosts and APIs. A one-time test only shows a point in time. Continuous discovery paired with continuous testing catches assets that appear between scheduled tests.
It can be. Data stored or processed in an unapproved tool may sit outside the controls that privacy and security regulations expect, and IBM's 2026 report found that about one in five shadow AI incidents ended with a regulatory fine. Whether a specific tool breaks a specific rule depends on the data involved and the jurisdiction.
The numbers agree on one thing: shadow IT is now normal, and shadow AI is growing faster than the governance around it. The defensible response is not a ban but a cycle of discovery, ownership and testing that runs as often as your environment changes.
DeepStrike's continuous penetration testing service watches public JavaScript files, API documentation, release changelogs and GraphQL schema changes, then has testers assess new features and endpoints as they ship. The Premium plan on our penetration testing pricing page adds attack surface management, dark web monitoring and weekly automated vulnerability scanning to two comprehensive penetration tests a year. If you want to know which shadow assets an attacker could reach today, talk to us about continuous testing.
Mohammed Khalil is a Cybersecurity Architect at DeepStrike, specializing in advanced penetration testing and offensive security operations. With certifications including CISSP, OSCP, and OSWE, he has led numerous red team engagements, focusing on cloud security, application vulnerabilities, and adversary emulation. His work involves dissecting complex attack chains and developing resilient defense strategies for clients in the finance, healthcare, and technology sectors.

Stay secure with DeepStrike penetration testing services. Reach out for a quote or customized technical proposal today
Contact Us
