April 14, 2026
Updated: April 14, 2026
A global, source-disciplined analysis that translates cybercrime data into enterprise risk and control decisions.
Mohammed Khalil

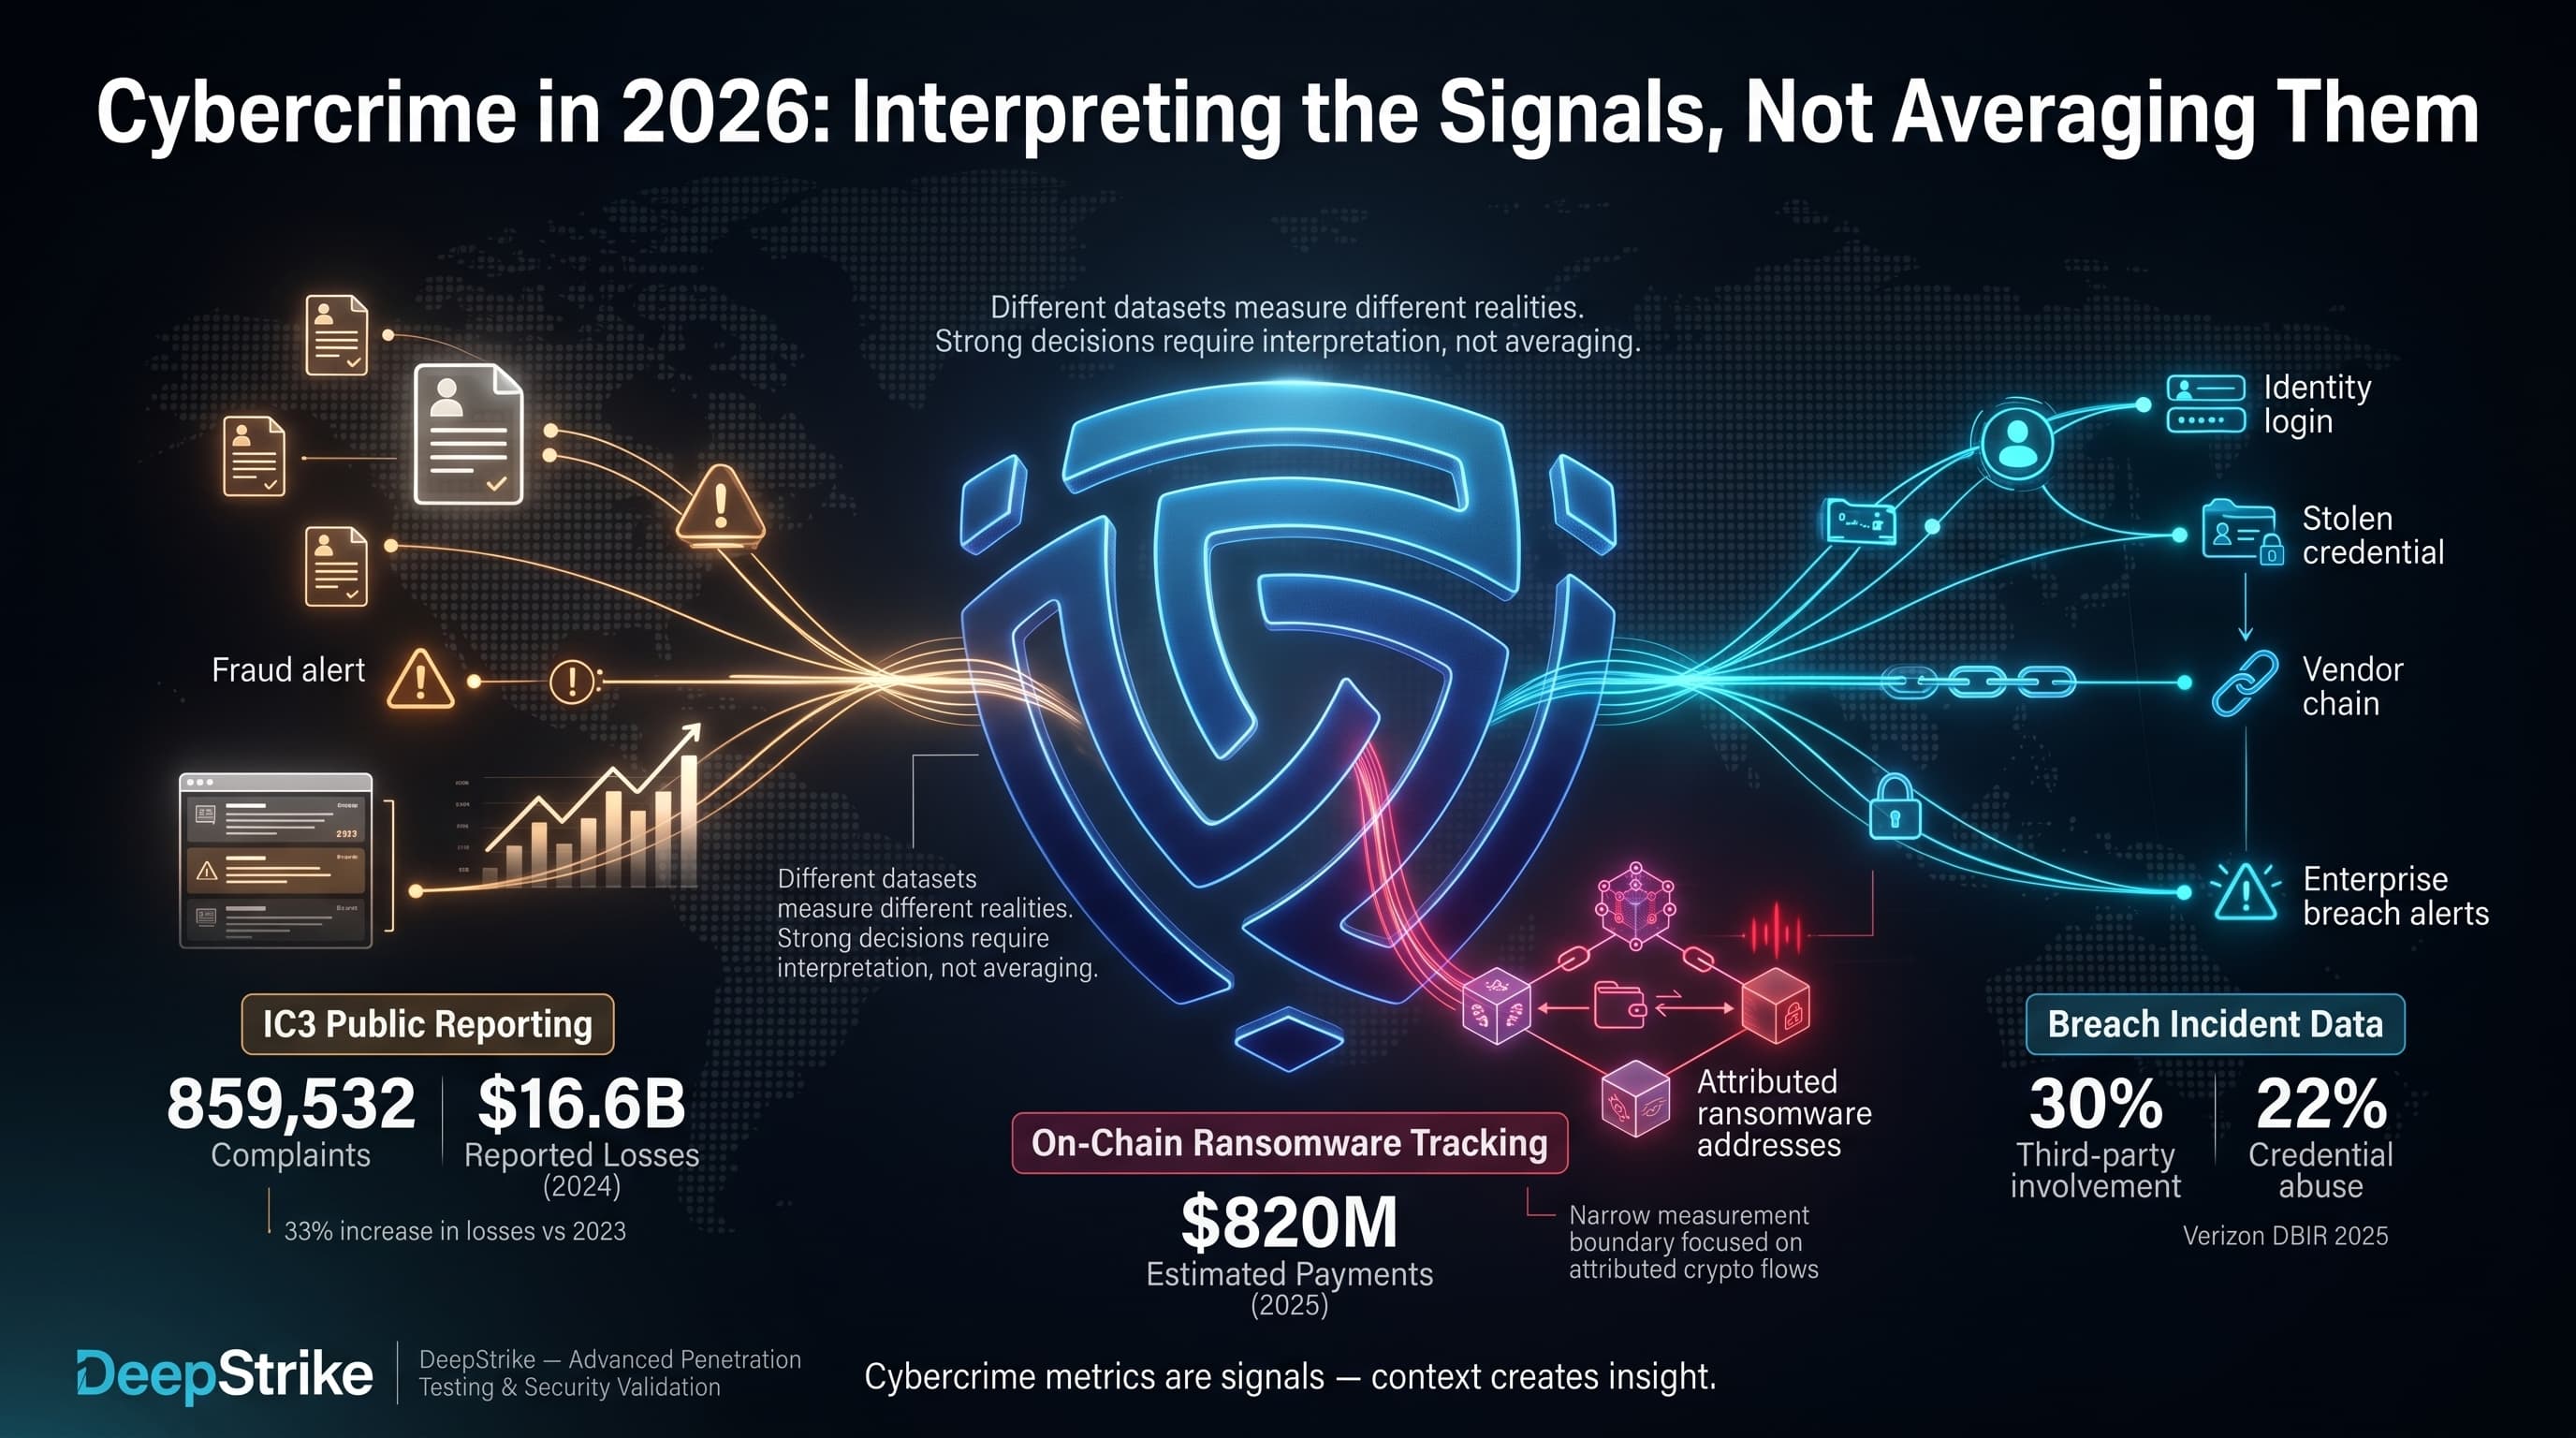
In 2026, cybercrime statistics are most useful when treated as multiple measurement systems that must be interpreted, not averaged. The latest available Internet Crime Complaint Center annual reporting shows 859,532 complaints and $16.6B in reported losses for 2024 (a 33% increase in losses versus 2023). At the same time, on-chain ransomware payments were estimated at about $820M in 2025—within a narrower measurement boundary that captures only cryptocurrency flows to attributed ransomware addresses. Separately, breach-focused incident data continues to show identity and external dependency pressure: Verizon’s 2025 DBIR press release reports third-party involvement in 30% of breaches and credential abuse at 22% of breaches.
For enterprise leaders, cybercrime matters in 2026 because it combines financial loss, operational disruption, rapid monetization through payment rails, and ecosystem risk across suppliers, identities, and business processes. This is why the most decision-relevant cybercrime statistics connect phishing to credential theft, credential theft to business email compromise (BEC), BEC to payment workflow failure, ransomware to business interruption and data theft, and third-party exposure to inherited risk and multi-victim cascades.
Cybercrime Statistics refer to quantified data about digitally enabled criminal activity, including victimization, financial losses, fraud patterns, extortion activity, attack methods, industry targeting, regional differences, and trends in the cybercriminal economy.
Cybercrime statistics typically measure (1) reported complaints, (2) victim counts, (3) reported financial losses, (4) attack frequency as observed by specific sensors, (5) category mix (fraud vs. intrusion vs. extortion), (6) incident prevalence within a studied dataset, (7) sector exposure, and (8) regional distribution. The key operational reality is that these are not interchangeable.
Complaint-based datasets are a visibility window into reported victimization and reported losses to a specific authority. For example, the latest available annual IC3 reporting provides counts and losses for categories like Phishing/Spoofing, Investment fraud, BEC, and Ransomware. However, IC3 itself emphasizes that ransomware loss totals in its reporting can be artificially low due to non-reporting and excluded cost categories (for example, unreported loss amount, downtime, wages, files, equipment, and third-party remediation services).
Incident-response datasets (vendor or consortium) measure confirmed incidents or breaches for participating organizations, often with strong fidelity on initial access vectors and execution patterns, but not total population prevalence. Verizon’s DBIR results, for example, are designed to explain “how” breaches happen, and include proportions like credential abuse and exploitation of vulnerabilities as leading initial access vectors.
Survey findings measure perceptions, exposure experiences, or self-reported changes—not verified counts of incidents. The World Economic Forum’s 2026 survey results on cyber-enabled fraud exposure are informative for executive concern levels and “direction of travel,” but they must not be treated as measured global prevalence.
A practical example that separates these measures: A global enterprise might see 500 phishing attempts in a month (security telemetry), 5 attempted vendor payment diversions (internal fraud reporting), 1 successful BEC payment loss (finance incident), 0 law-enforcement reports filed (complaint reporting gap), and a $2M internal cost of response and recovery (business impact). These numbers can all be “true” at the same time because they measure different layers of the cybercrime system.
The most verifiable, numerically explicit loss-and-category dataset available at scale remains country-scoped, most notably the United States IC3 annual reporting. For a global overview, this section uses IC3 as a high-fidelity complaint-and-loss lens, then layers EU and global executive signals with explicit labeling.
| Metric | 2023 | 2024 (Latest Available) | Trend | Notes |
|---|---|---|---|---|
| Reported complaints | 880,418 | 859,532 | Down slightly | Complaint-based; not global prevalence |
| Reported losses | $12.5B | $16.6B | Up | Complaint-based; underreporting expected |
| Investment fraud losses | $4.57B | $6.57B | Up | High-ticket fraud dominates reported losses |
| BEC losses | $2.9B | $2.77B | Down slightly | Still a top loss category |
| Ransomware complaints | 2,825 | 3,156 | Up | Counts rise even when reported losses vary |
| Ransomware reported losses (adjusted) | $59.6M | $12.47M | Down (reported) | Loss reporting is incomplete; not total impact |
The 2023 figures above are from the 2023 Internet Crime Report, and the 2024 figures are from the 2024 IC3 annual reporting.
The core shift visible in this anchor dataset is not “more complaints,” but “more dollars per successful criminal outcome.” Total complaints decreased slightly from 2023 to 2024, while reported losses rose substantially. This pattern is consistent with two operational dynamics that matter for enterprises: (1) high-ticket fraud (investment scams, BEC, tech support) drives disproportionate financial damage versus high-volume nuisance categories, and (2) reporting behavior changes year to year by category, victim segment, and organizational willingness to disclose.
Methodology differences are non-trivial. IC3 is complaint-based and can undercount non-reporting; ransomware loss reporting is explicitly flagged as potentially artificially low; and breach datasets focus on confirmed data disclosure rather than direct fraud loss.
Cybercrime cost should be separated into at least four layers, because these are often mixed incorrectly:
The latest available IC3 reporting records $16.6B in reported losses for 2024 within its dataset, and shows that “Investment” fraud ($6.57B) and BEC ($2.77B) are among the highest-loss categories. IC3 also isolates “cyber-enabled fraud” at $13.7B in losses (83% of its total losses), which is a useful reminder that the “cybercrime cost center” in many organizations is actually fraud controls, payment controls, and identity trust—not only malware defense.
On the extortion side, Chainalysis estimates on-chain ransomware payments at about $820M in 2025 (down ~8% YoY), but notes totals can change as more payments are attributed (a critical reliability constraint for any single-year KPI). This is a narrower measure than “ransomware cost”: it captures crypto payments to attributed wallets, not downtime, rebuild, legal exposure, regulatory response, or lost business.
For enterprise total impact modeling, breach cost research is often used as a proxy for the “full economic blast radius” of an intrusion that results in data compromise. IBM’s Cost of a Data Breach 2025 materials place the global average cost at $4.44M (US average $10.22M) and break down cost components such as lost business, detection/escalation, post-breach response, and notification. This is not “cybercrime loss,” but it is decision-relevant because many cybercrime campaigns now include data theft and extortion, and because breach lifecycle and response efficiency strongly shape total cost.
| Indicator | Value | YoY | Notes |
|---|---|---|---|
| Reported cybercrime losses (complaint-based, US-focused dataset) | $16.6B (2024) | 2023 | Reported losses; undercounting expected |
| Investment fraud losses (same dataset) | $6.57B (2024) | 2023 | Largest loss category in the dataset |
| BEC losses (same dataset) | $2.77B (2024) | Slightly down vs 2023 | Still a top enterprise-relevant fraud vector |
| On-chain ransomware payments (global crypto measure) | ~$820M (2025) | -8% vs 2024 (updated estimate) | Crypto flows only; attribution can change totals |
| Average cost of a data breach (enterprise impact proxy) | $4.44M (global, 2025) | -9% vs 2024 | Includes response and lost business; not direct criminal proceeds |
The IC3 values above come from the 2024 IC3 annual reporting and its 2023 Internet Crime Report; the ransomware crypto estimates come from Chainalysis; and breach cost values come from IBM’s 2025 reporting.
Phishing remains the leading “front door” for both consumer fraud and enterprise intrusion because it is cheap, scalable, and adaptable across channels (email, SMS, voice, collaboration platforms). In the latest IC3 reporting, Phishing/Spoofing is the highest-volume crime type by complaint count (193,407 in 2024).
The enterprise-relevant interpretation is not the raw count, but the conversion chain: phishing → credential capture or session hijack → account takeover or mailbox rule abuse → payment diversion, data theft, or privileged access expansion. Verizon’s breach data summary reinforces that credential abuse and social engineering remain leading entry patterns in confirmed breaches.
From a criminal economy perspective, Europol’s IOCTA explicitly frames social engineering as a prevalent technique and highlights that the adoption of large language models improves the efficacy of social engineering by tailoring communication and automating parts of the criminal process.
BEC is one of the most operationally dangerous cybercrime categories for enterprises because it targets trust and payment workflow authorization—not endpoints. In the IC3 2024 reporting, BEC shows 21,442 complaints and $2.77B in reported losses. In 2023, IC3 described 21,489 BEC complaints and roughly $2.9B in reported losses.
BEC often exceeds expectations because it is frequently not a “hack” problem; it is a verification failure in the presence of compromised identities, compromised email sessions, convincing impersonation, and time pressure. BEC also benefits from the broader cybercrime supply chain described by Europol: initial access is sold, data is commodified, and criminal operations leverage end-to-end encrypted channels to negotiate and transact.
At board level, BEC loss is rarely bounded by IT controls alone; it is bounded by payment rails, approval thresholds, and the last trusted human checkpoint.
Ransomware remains a core cybercrime business model because it monetizes operational disruption and time—often with data theft as leverage. In IC3 2024 reporting, ransomware appears as 3,156 complaints, with an adjusted loss number listed at $12.47M. IC3 explicitly warns that ransomware loss totals can be artificially low due to non-reporting and excluded cost categories (for example, lost business, time, wages, files, equipment, or third-party remediation services).
That warning aligns with real enterprise economics: ransom paid is often not the dominant cost driver. Restoration, downtime, response labor, legal exposure, and customer impact frequently matter more, which is why breach-cost research remains relevant for ransomware-extortion scenarios.
For one narrow but globally comparable measure, Chainalysis estimates ransomware actors received more than $820M in on-chain payments in 2025, while noting totals may approach or exceed $900M as attribution improves. This is a useful “enablement KPI” for extortion monetization pressure, but it should not be merged with complaint-based loss data as if they are measuring the same population.
Credential theft is a force multiplier because it converts many other cybercrime categories into “log in and operate.” It enables mailbox takeover for BEC, session-based access for SaaS data theft, and privilege escalation inside cloud and identity platforms after lateral movement.
Breach cost research provides a useful proxy for the economic gravity of credential-based compromise. IBM’s 2024 report notes compromised credentials were involved in 16% of breaches studied and carried an average breach cost of $4.81M; it also describes longer identification and containment timelines for credential-based attacks.
Operationally, this is why identity must be treated as an attack surface, not a directory: adversaries do not need malware to generate loss if they can operate through legitimate tokens and authenticated sessions.
Online fraud is not a single pattern; it is a family of monetization plays that exploit users, business processes, and payment infrastructure. In IC3 2024 reporting, the top loss categories include Investment fraud ($6.57B), Tech Support ($1.46B), and Government Impersonation ($405.6M), in addition to BEC.
The “Investment” category is especially relevant because it demonstrates cybercrime’s ability to extract high-dollar losses through narrative engineering (“returns,” “platform legitimacy,” “trusted advisor”), not only through technical compromise.
At the international coordination layer, INTERPOL describes financial fraud as a rapidly evolving transnational crime intersecting with organized crime and cybercrime, and reports increased cross-border collaboration supporting asset recovery and casework.
This table mixes incident datasets and relevance signals deliberately, because no single source measures “all cybercrime vectors globally.” Each row indicates whether the “share” is a measured percentage from a specific study or a relevance indicator grounded in category losses and observed patterns.
| Vector / Method | Share of Incidents or Relevance | Avg Impact / Cost | Notes |
|---|---|---|---|
| Phishing/Spoofing | Very high volume in complaint reporting | Often low per event, high at scale | Primary initial contact vector; fuels credential theft and fraud |
| Credential abuse / stolen credentials | 22% (breach dataset) | High when used for privileged workflows | Often “log in” rather than “break in,” complicating detection |
| Exploitation of vulnerabilities | 20% (breach dataset) | High when perimeter or critical systems hit | Often paired with extortion and data theft |
| Business Email Compromise | High direct loss category in complaint reporting | High per successful event | Targets payment workflow trust and vendor changes |
| Ransomware / extortion | Present in 44% of breaches (breach dataset); dominant in EU cybercrime claims | High operational disruption | Loss reporting varies; total cost includes restoration and downtime |
| Third-party compromise | 30% of breaches involve third parties (breach dataset) | Multi-victim cascade risk | Inherited risk can bypass internal controls |
| Vishing / phone impersonation | Increasing relevance in European LE analysis | High where finance approvals rely on voice | Enables account/PIN harvesting and payment diversion |
| Data brokers / initial access brokers | Structural enablement layer | Indirect but high leverage | Access resale links low-skill entry to high-impact outcomes |
The credential abuse, exploitation, ransomware, and third-party proportions above are from Verizon’s 2025 DBIR press release summary. Europol’s IOCTA provides the structural view of access brokers, data brokers, and vishing as part of the cybercrime ecosystem.
In practice, cybercrime campaigns frequently chain:
Mapped to MITRE ATT&CK thinking, this often aligns with the intent of techniques such as phishing (T1566) and use of valid accounts (T1078), followed by collection and exfiltration patterns when data theft is part of monetization.
Industry exposure differs because cybercrime targets where money moves fast, verification is weak, data is monetizable, and downtime is unacceptable.
| Industry | Relative Exposure Level | Typical Impact Pattern | Key Notes |
|---|---|---|---|
| Healthcare | High | Extortion + data theft + disruption | High breach costs; downtime impacts safety; ransomware pressure persists |
| Finance | High | Fraud + account takeover + data breaches | High-value targets; identity and payment integrity are primary controls |
| Technology | High | Credential theft + access resale + third-party cascade | Supplier concentration increases inherited risk and blast radius |
| Manufacturing | High | Ransomware + operational disruption | IT/OT convergence and downtime sensitivity drive extortion leverage |
| Retail | Medium to high | Payment fraud + account takeover + impersonation | Customer-facing scale makes fraud economics attractive |
| Government / Public Sector | High | Disruption + data exposure + extortion | Public services and citizen data raise political/regulatory costs |
Healthcare breach costs in IBM’s 2025 materials are reported as the highest average breach cost for the 14th consecutive year at $7.42M. For EU finance-sector cybercrime claims, ENISA reports a distribution dominated by data breaches (64%) and ransomware (36%) in its reporting period.
For manufacturing, ENISA’s cybercrime sector impact reporting highlights manufacturing among targeted sectors in EU cybercrime claims, and Verizon’s DBIR press release notes an increase in espionage-motivated attacks in manufacturing and healthcare.
A global view requires explicit acknowledgment of reporting gaps and unequal measurement coverage. The best practice is to triangulate: complaint-and-loss reporting (country-scoped), regional threat landscape analysis, global executive survey signals, and law-enforcement disruption outcomes.
| Region | Key Trend | Cost or Impact Signal | Notes |
|---|---|---|---|
| United States | High complaint volume; high reported losses | $16.6B reported losses (2024 IC3 dataset) | Complaint-based; not total prevalence |
| Europe | Extortion-dominant cybercrime claims | Ransomware 81.1% of EU cybercrime activities in ENISA dataset | Dataset-specific; focuses on EU organizations |
| Africa | Strong focus on scam operations and infrastructure takedowns | 651 arrests and $4.3M recovered in one multi-country operation | Operational disruption signals, not prevalence |
| Southeast Asia | Scam center industrialization and enforcement escalation | Sanctions and large-scale compound targeting | Strong link to trafficking and fraud ecosystems |
| Global executive view | Fraud and phishing prioritized at leadership level | 77% reported increase; 73% affected in WEF survey | Survey signal; not incident count |
US IC3 2024 annual reporting provides the $16.6B figure. ENISA’s Threat Landscape 2025 reports ransomware dominance in EU cybercrime activities in its reporting period. INTERPOL reports major operations against online scams in Africa, including arrests and infrastructure takedowns. The UK government describes sanctions against an illicit crypto marketplace supporting scam centers, including a named compound capacity estimate and prior asset freezes/seizures cited as exceeding £1B. The World Economic Forum provides survey signals for cyber-enabled fraud exposure and perceived increases.
European Commission cloud-hosted web platform attack (public sector)In March 2026, reporting indicates the European Commission’s cloud infrastructure hosting the Europa web platform was targeted, with early findings suggesting data extraction from affected websites; the incident was contained and internal systems were not affected. Why it matters: public-sector cloud platforms remain attractive for opportunistic data theft, and executive reporting must distinguish clearly between affected public-facing systems and unaffected internal systems.
INTERPOL Operation Synergia III (global cybercrime infrastructure disruption)INTERPOL reports that Operation Synergia III (July 2025–January 2026) took down more than 45,000 malicious IP addresses and servers, led to 94 arrests, and involved 72 countries and territories; reported targets included phishing, malware, and ransomware infrastructure. Why it matters: this is a measurable disruption signal against the enablement layer. For enterprises, it supports the assumption that attackers will shift infrastructure and reconstitute quickly, so detection and response must remain adaptive.
INTERPOL Operation Red Card 2.0 (online scam crackdown in Africa)INTERPOL reports 651 arrests and recovery of more than $4.3M in an operation targeting online scams (high-yield investment scams, mobile money fraud, and fraudulent loan apps), and cites investigations linked to over $45M in financial losses and 1,247 identified victims, plus takedown of 1,442 malicious IPs/domains/servers. Why it matters: the fraud ecosystem is not only a “phishing problem.” It is a supply chain of scripts, call centers, mule accounts, telecom access, and infrastructure—requiring AML, telco controls, and cross-sector response.
Cambodia scam center law and enforcement reporting (scam center industrialization)AP reporting in March 2026 describes Cambodia adopting a law targeting online scam operations with penalties up to life imprisonment, and cites government statements about 250 targeted locations (200 shut down), 79 cases, nearly 700 arrests, and repatriation of nearly 10,000 workers from 23 countries. Why it matters: the “scam center” operating model compresses cybercrime into an industrial process (recruitment, coercion, scripts, tooling, laundering). Enterprises should expect more scalable, multilingual fraud attempts and more aggressive identity verification needs.
UK sanctions targeting scam center enablement (crypto marketplace and compound capacity)The UK government reports sanctions against an illicit crypto marketplace described as supporting scam centers by selling stolen personal data and providing equipment, and cites a facility (“#8 Park”) described as having capacity for 20,000 trafficked workers; it also references prior coordinated sanctions leading to asset freezes and seizures cited as exceeding £1B. Why it matters: this demonstrates targeted pressure against the financial and infrastructure layer of fraud operations. For enterprises, it reinforces that fraud risk is entangled with identity data exposure and illicit market liquidity.
AI-assisted social engineering at scaleEuropol’s IOCTA states that wider adoption of large language models and generative AI improves the efficacy of social engineering by tailoring communication and automating criminal processes. Security implication: email security alone is insufficient; organizations need identity proofing, anti-impersonation controls, and rapid verification pathways for high-risk requests.
Scam center industrialization and forced criminalityINTERPOL and public reporting highlight scam centers as a transnational fraud model, with law-enforcement initiatives targeting both actors and infrastructure. Security implication: enterprises should expect cross-channel fraud attempts (social, voice, messaging, email) and invest in stronger customer and employee verification standards.
Initial Access Brokers and the access resale economyEuropol describes a thriving ecosystem around selling access to compromised systems and accounts, with Initial Access Brokers (IABs) advertising services and commodities on specialized platforms. Chainalysis also notes IAB activity as a potential leading indicator, with inflow spikes preceding ransomware payments and victim leaks (as observed through on-chain analysis). Security implication: identity telemetry (abnormal login patterns, session anomalies, impossible travel, OAuth grant anomalies) becomes a primary detection surface.
Third-party and inherited risk as a breach catalystVerizon reports third-party involvement in 30% of breaches, doubling year over year in its DBIR summary. Security implication: procurement and vendor governance must be treated as security architecture. Contractual controls, validation, and monitoring for third-party access paths are no longer optional.
EU ransomware dominance in regional cybercrime claims datasetsENISA reports ransomware as 81.1% of cybercrime activities in its reporting period and frames ecosystem fragmentation and RaaS program churn. Security implication: focus on resilience and rapid containment, not only prevention. RaaS diversity increases detection variance; control outcomes must be measured through exercises and validation.
| Attribute | Cybercrime Statistics | General Cybersecurity Incident Data |
|---|---|---|
| Primary Focus | Monetization: theft, fraud, extortion | Compromise mechanics: how breaches and intrusions occur |
| Typical Metrics | Losses, complaint counts, fraud categories, payment diversion | Incident/breach counts, initial vectors, affected assets, dwell time |
| Financial Emphasis | High (direct loss and fraud outcomes) | Variable (may focus on compromise mechanics) |
| Reporting Source | Law enforcement complaints; consumer reporting; financial crime bodies | IR investigations; consortium datasets; vendor telemetry |
| Business Relevance | Payment workflow integrity; fraud controls; identity trust | Control failure analysis; detection and response maturity |
| Common Limitation | Underreporting; uneven disclosure; non-comparable categories | Sampling bias; participant scope; not direct loss totals |
IC3 and INTERPOL reporting are examples of complaint- and operation-driven cybercrime statistics focused on fraud and monetization outcomes. Verizon DBIR is an example of incident-focused analysis explaining initial vectors and breach patterns.
The practical takeaway is that cybercrime datasets lean toward losses, complaints, and monetization patterns, while general incident datasets often explain how controls fail and how intrusions progress. Enterprise decision-making needs both: monetization risk to prioritize business controls, and intrusion mechanics to prioritize technical controls.
For CISOs and fraud leaders, the most actionable interpretation is clear: control the trust boundaries where money, identity, and privileged actions move.
Identity controls are primary loss controlsCredential abuse remains a leading initial access vector in breach datasets, and credential-driven intrusions are consistently expensive in breach cost research. This supports three architectural priorities: phishing-resistant MFA for workforce and admins, strict conditional access and session controls, and continuous credential exposure monitoring (especially for executives, finance staff, and helpdesk). DeepStrike’s work on compromised credential trends can support credential-centric risk reviews.
Payment workflows are a cybercrime control surfaceIC3 shows BEC remains a multi-billion-dollar loss category. This implies that payment authorization, bank detail change processes, vendor onboarding, and “out-of-band verification” are security-critical systems. Security architecture should explicitly map every path that can result in a transfer of funds (ERP, email, ticketing, procurement portal, supplier portal), and apply controls such as step-up verification and dual approval.
Extortion resilience should be measured in time-to-contain, not “ransom paid”Ransomware reporting has known loss undercounting in complaint datasets, while on-chain payment measures focus on a subset of payment rails. Therefore, executive reporting should track: time to detect, time to contain, backup restoration RTO/RPO achievement, identity containment (token invalidation, credential resets), and irrecoverable data exposure. DeepStrike’s ransomware trend analysis can be used to benchmark extortion operating models.
Third-party risk is a quantified breach contributorWith third-party involvement implicated in 30% of breaches in Verizon’s DBIR summary, vendor access paths and supplier dependencies must be governed like internal systems. This impacts procurement and compliance decisions: minimum security requirements, evidence-based control validation, and monitoring of supplier identity flows.
Law-enforcement disruption is a signal, not a shieldINTERPOL operations show that large-scale takedowns and arrests matter, but cybercrime infrastructure reconstitutes quickly. Organizations should treat disruption as temporary friction, not durable risk reduction, and maintain layered controls.
Phishing-resistant MFA and session hardeningPhishing volume remains high and credential abuse is a leading vector. Prioritize FIDO2/WebAuthn-based authentication for privileged users and finance workflows, enforce conditional access, restrict legacy authentication, and implement session binding and token theft controls where possible.
Payment verification controls engineered for BECGiven the scale of reported BEC losses, implement process controls that remain effective even when email is compromised: verified vendor master data changes, mandatory callback verification using pre-established numbers, dual control for payment releases, and strict segregation of duties between vendor creation and payment approval.
Executive impersonation safeguardsAs social engineering improves with AI-assisted tailoring, implement executive fraud playbooks: high-risk request patterns, “no urgency override” rules, and a secure verification channel for approvals (for example, signed approvals in a controlled workflow system rather than email).
Email and collaboration security with business contextDeploy DMARC enforcement and inbound impersonation detection, but treat them as necessary, not sufficient. BEC is a business process compromise; integrate email security signals into finance workflows and incident response triggers.
Identity monitoring and privileged access hygieneImplement least privilege, just-in-time access for admins, and privileged session monitoring. Credential theft and account takeover are leverage points for both fraud and extortion.
Third-party validation and continuous assuranceBecause third-party involvement is a quantified contributor to breaches, require evidence of control maturity, implement least-privilege vendor access, and continuously monitor supplier identity events.
Logging, anomaly detection, and rapid containmentFocus on detecting the “money moment” and the “privilege moment”: unusual payment workflow events, mailbox rule creation, anomalous OAuth grants, and unusual remote access. Measure containment speed.
Continuous penetration testing and adversary simulationCybercrime chains blend social engineering, identity abuse, and business workflow exploitation. Validate controls against realistic attack paths (credential theft → mailbox takeover → invoice diversion; exposed VPN credential → lateral movement → ransomware staging). DeepStrike’s guidance on continuous penetration testing can be used for program structure.
Tabletop exercises focused on fraud and extortionRun separate exercises for BEC payment diversion and ransomware extortion. They stress different executive decisions (freeze funds vs. restore operations) and different external coordination pathways.
Expected Loss = Probability × Impact
Cybercrime statistics inform both terms, but only when mapped correctly:
Illustrative example (numbers labeled as illustrative, not sourced):Assume a mid-size enterprise estimates a 6% annual probability of a successful BEC event that passes existing controls (based on internal near-miss data, not public datasets), and the expected direct loss per successful event is $250,000 (based on historical internal loss distribution). Expected annual direct BEC loss = 0.06 × $250,000 = $15,000. If the organization also estimates that 20% of successful BEC events trigger additional response costs of $100,000 (for investigation, legal, and process redesign), add 0.06 × 0.20 × $100,000 = $1,200. Expected annual BEC loss (direct + response) ≈ $16,200.
How public statistics calibrate this: IC3 establishes that BEC is a top-tier loss category in complaint reporting, justifying executive attention and control spend; Verizon indicates that credential abuse is a major initial vector, suggesting identity controls reduce probability; and IBM cost research helps bound the potential impact when a cybercrime event includes data compromise.
Cybercrime statistics are measured data about digitally enabled crime—complaints, losses, fraud categories, extortion signals, vectors, and how criminals monetize online activity.
There is no single verified global total. Complaint-based loss data (for example, IC3) and on-chain ransomware payments (for example, Chainalysis) measure different populations and should not be merged.
High-volume categories include phishing/spoofing in complaint reporting, while high-loss categories include investment fraud and BEC.
Exposure differs by sector; high-risk sectors typically include healthcare, finance, manufacturing, and public sector due to regulated data, downtime sensitivity, and high-value transactions.
Phishing is a primary initial access and credential-harvesting mechanism that enables account takeover, BEC payment diversion, and intrusion-driven extortion.
Cybercrime emphasizes criminal monetization outcomes (fraud, extortion, theft), while broader incident data emphasizes compromise mechanics and control failures; both are needed for enterprise risk decisions.
Prioritize phishing-resistant authentication, harden payment workflows against BEC, reduce privilege and third-party exposure, and validate controls through testing and incident exercises.
Yes. Complaint-based datasets reflect reported losses, and multiple sources note reporting gaps and measurement limitations (especially for categories like ransomware).
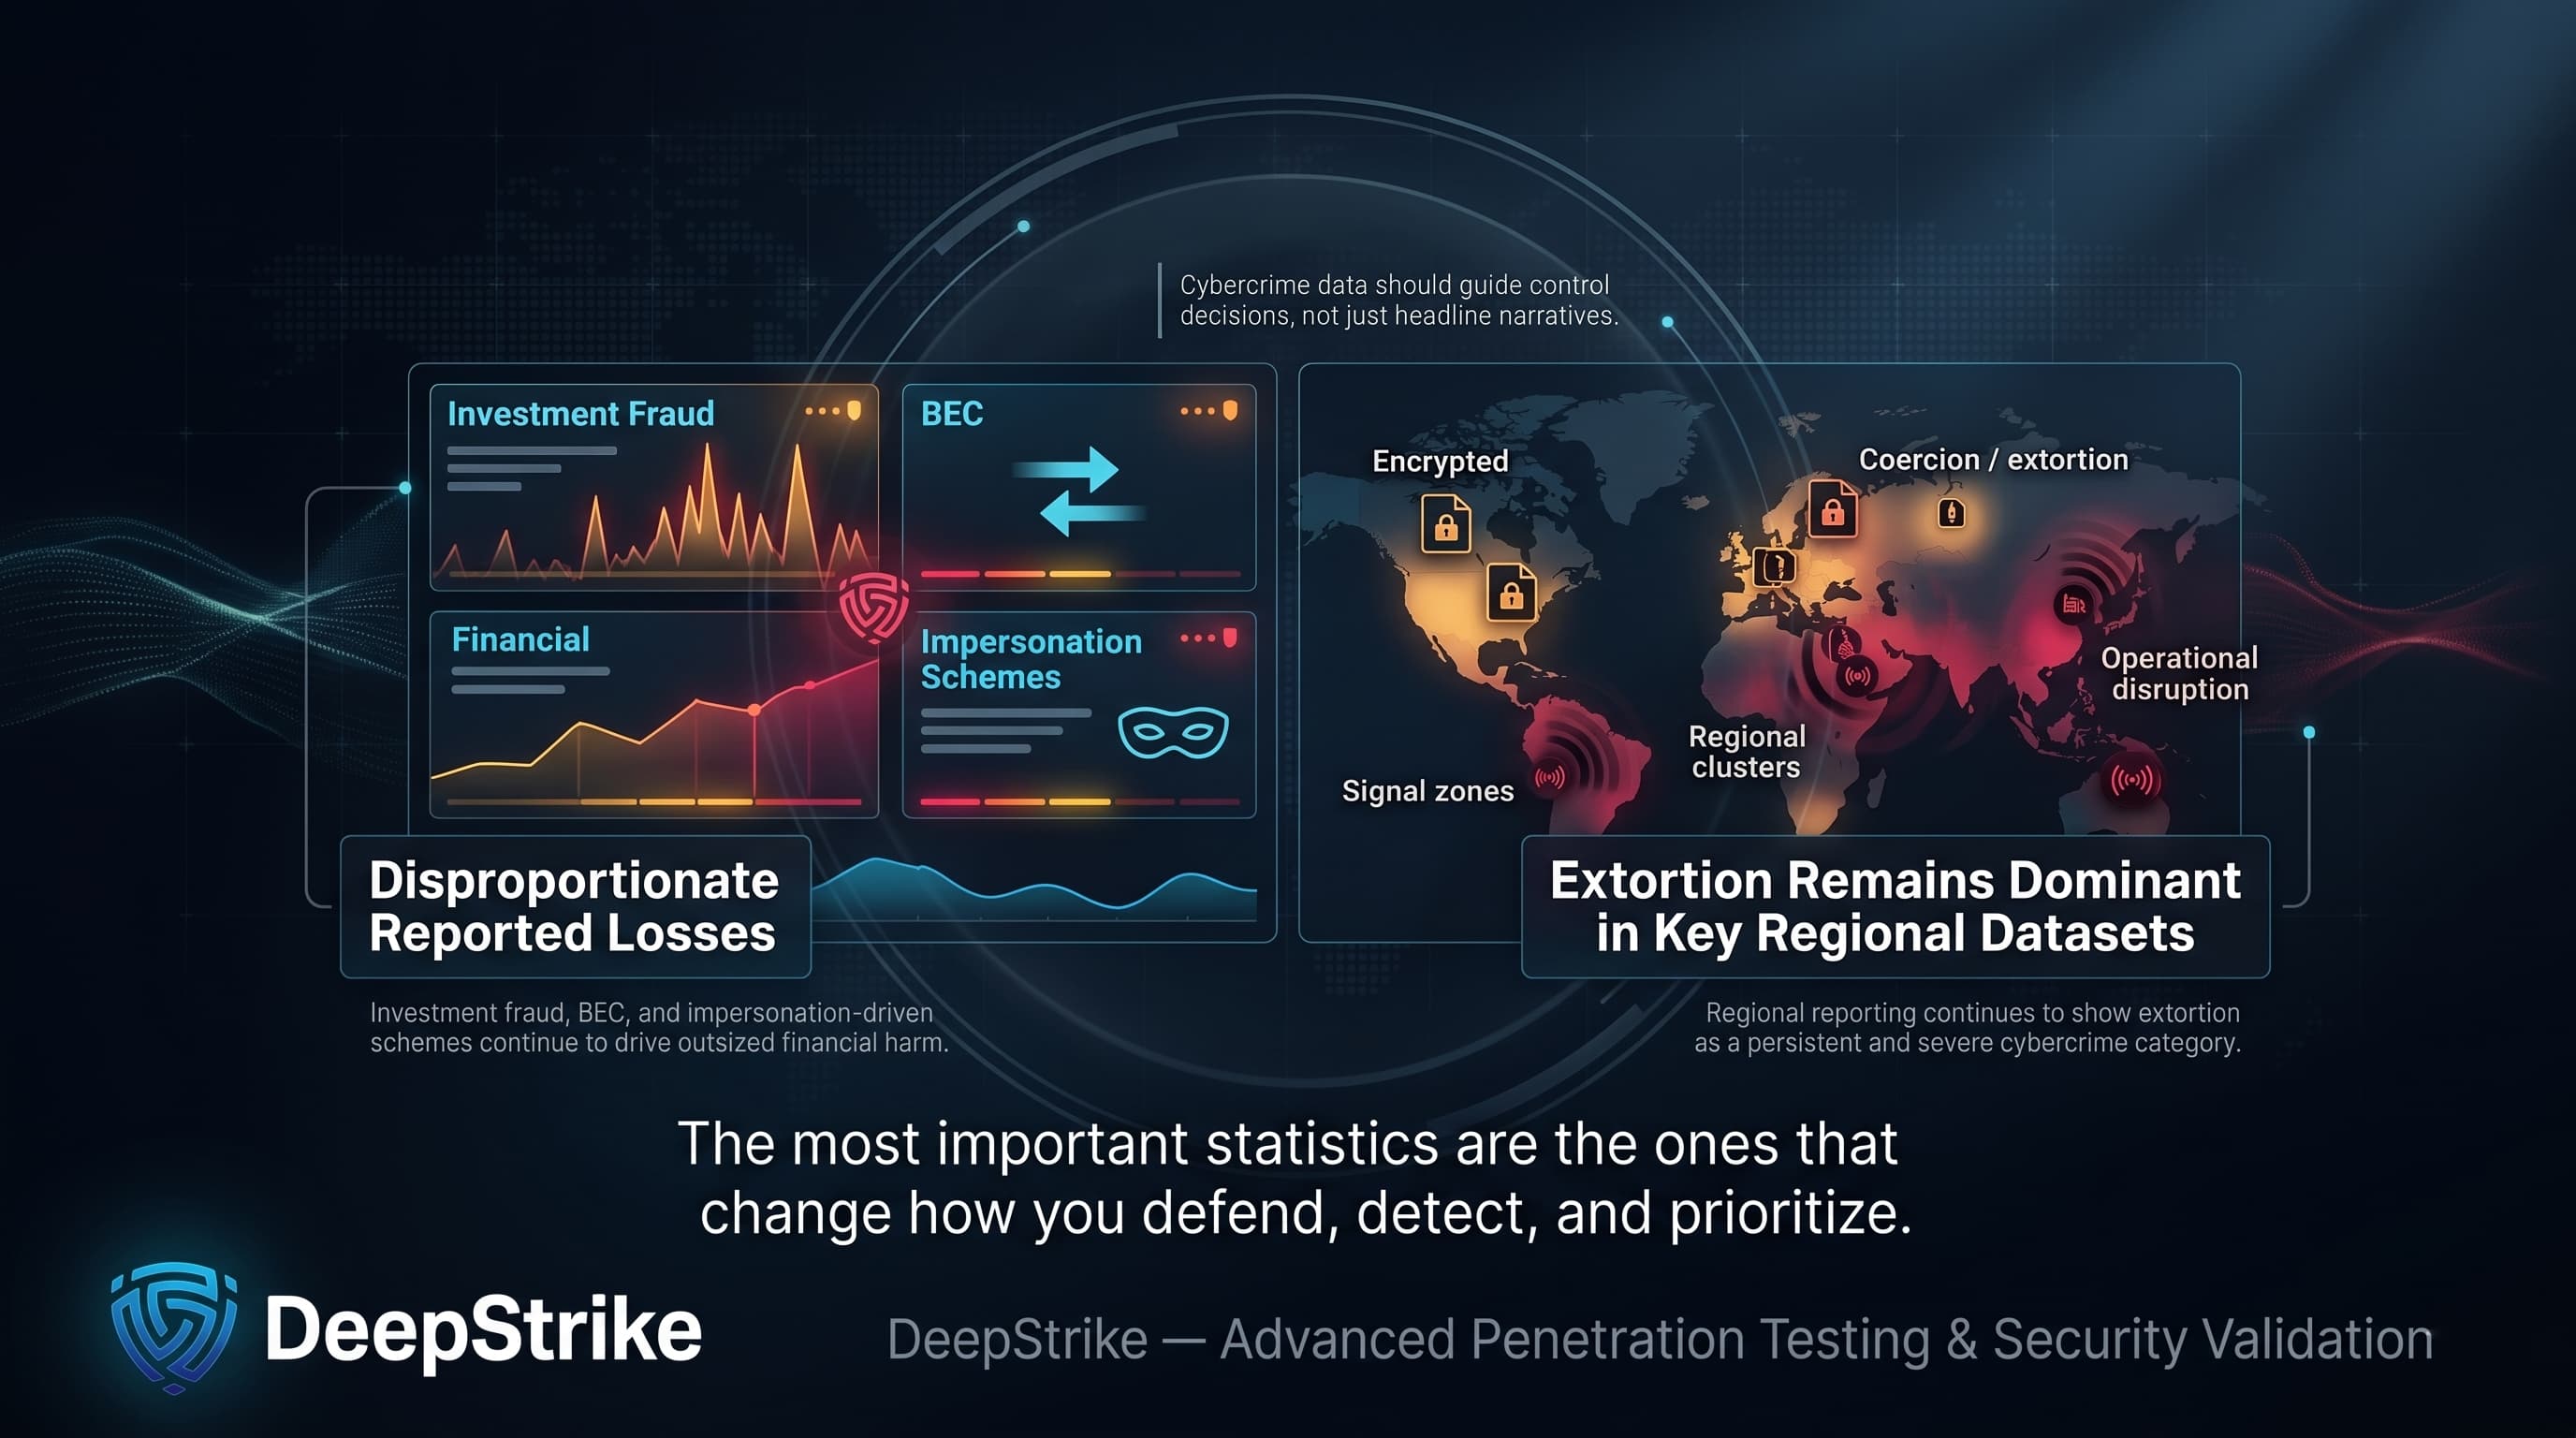
Cybercrime statistics in 2026 should be read as a set of decision signals, not a single headline number. The most reliable figures show that high-ticket fraud categories (investment fraud, BEC, and related impersonation-driven schemes) drive disproportionate reported losses, while extortion remains dominant in several regional cybercrime datasets.
The operational lesson is that cybercrime is not a single attack type. It is an ecosystem spanning fraud, extortion, credential abuse, account takeover, data theft, and third-party-enabled access resale, with law-enforcement disruption acting as friction rather than elimination.
Enterprises should use cybercrime statistics to guide identity security, payment and fraud controls, resilience planning, testing strategy, and executive risk modeling, because that is where measurable loss is concentrated and where risk reduction is most defensible.
Mohammed Khalil is a Cybersecurity Architect at DeepStrike, specializing in advanced penetration testing and offensive security operations. With certifications including CISSP, OSCP, and OSWE, he has led numerous red team engagements for Fortune 500 companies, focusing on cloud security, application vulnerabilities, and adversary emulation. His work involves dissecting complex attack chains and developing resilient defense strategies for clients in the finance, healthcare, and technology sectors.

Stay secure with DeepStrike penetration testing services. Reach out for a quote or customized technical proposal today
Contact Us