April 29, 2025
Updated: April 19, 2026
A data-driven update on verified phishing volumes, BEC losses, attack vectors, and risk for 2026 planning.
Mohammed Khalil
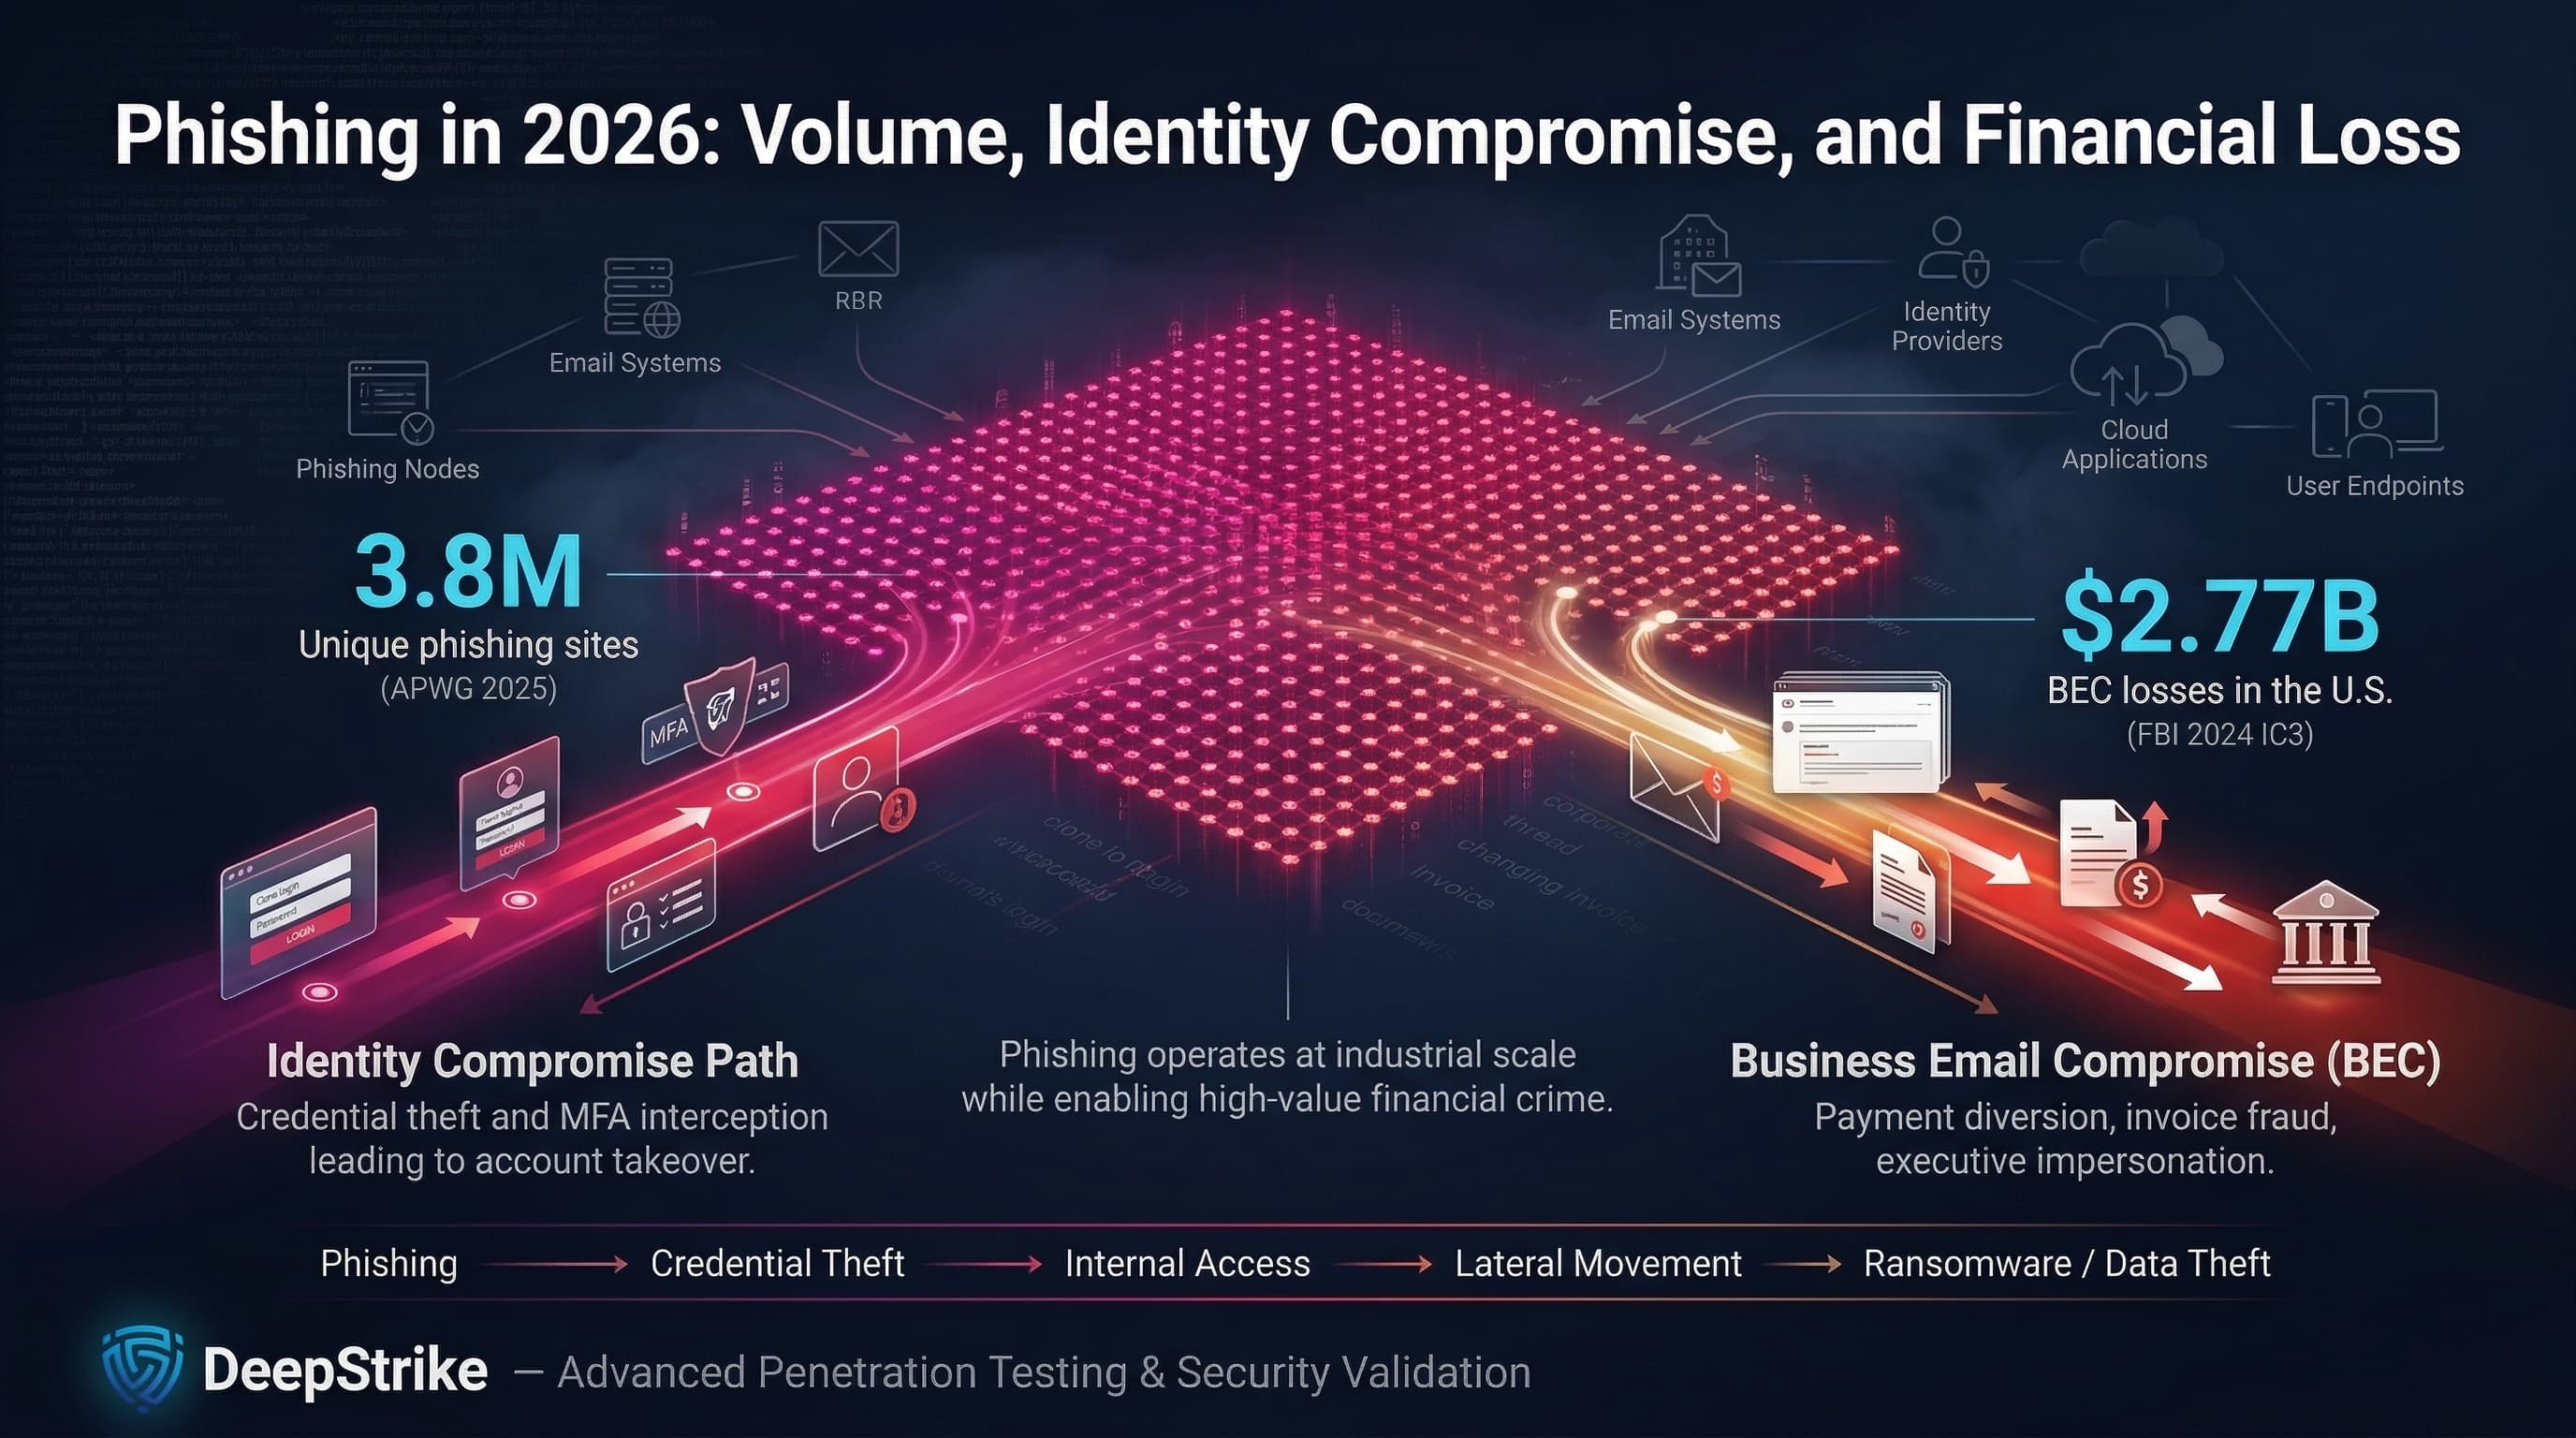
For 2026 enterprise planning, phishing remains a core risk driver. Latest data reinforce that email-based social engineering is at industrial scale and closely tied to identity and financial crime. In 2025, the Anti-Phishing Working Group (APWG) recorded 3.8 million unique phishing attack sites worldwide, exceeding 2024’s 3.76 million. At the same time, the FBI’s 2024 Internet Crime Report (used for 2026 threat modeling) shows $2.77 billion in U.S. business email compromise (BEC) losses. This juxtaposition of very high ‘volume’ metrics and multi-billion dollar ‘loss’ metrics highlights two key roles of phishing: as an identity compromise mechanism (credential/MFA theft leading to account takeover) and as a fraud mechanism (payment redirection, invoice scams). Phishing remains a common initial access mechanism in ransomware, account-compromise, and data-theft incident chains.
Phishing is multifaceted in 2026 terms: it includes credential and token phishing (for cloud logins and MFA bypass), executive/vendor impersonation (invoice or payroll fraud), malicious URLs and attachments (for malware delivery or browser-based payloads), and even multi‑channel lures (SMS, voice, collaboration platforms, QR codes). The operational impact crosses technical and business domains: each click could seed malware, hijack identities, or facilitate wire fraud. Our analysis uses the latest available 2025 data (APWG, Microsoft telemetry, IC3 complaints) to illuminate these dynamics for security and risk decision-making.
Phishing Statistics refer to quantified data about phishing activity, including campaign volume, delivery methods, victim interaction, credential theft, business email compromise, financial losses, industry targeting, regional variation, and broader changes in social-engineering attack patterns.
Phishing statistics should never be collapsed into one undifferentiated number. Each metric reflects a distinct measurement model:
For example: an organization might get 10,000 phishing emails in a week. The email gateway blocks 99%, 100 reach inboxes, 10 users click (10% click rate), and 1 user submits credentials (1% of clicks). If incident response then immediately resets that account and no funds are lost, the enterprise impact is “near miss” despite actual credential harvest. This illustrates why we don’t conflate email volume (10,000) with loss ($0) and need separate metrics for campaign count, victim actions, and business outcome.
Methodology note: This article uses the latest credible data (primarily 2024–2025 reports and telemetry) for 2026 planning. Platform telemetry (APWG, Microsoft) and complaint/loss data (IC3) are reported with clear scope. We explicitly distinguish “pressure” signals (attack volume) from “harm” signals (losses) and warn that platform scans are not global counts, just the provider’s view.
| Metric | 2024 | 2025 (Latest) | Trend | Notes |
|---|---|---|---|---|
| APWG observed phishing attacks (unique phishing sites) | 3.76M | 3.80M | ↗ Slight rise | Recorded phishing URLs (“attacks”); not raw email count. |
| APWG observed phishing attacks in Q4 | 989,123 | 853,244 | ↘ Down | Quarter-to-quarter volumes fluctuate (Q2 2025 was a peak). |
| Share of phishing targeting SaaS/Webmail (APWG quarterly) | 23.3% (Q4) | 20.3% (Q4) | ↘ Down | Sector share; indicates focus shift (social media rise, telecom surging). |
| US phishing/spoofing complaints (IC3) | 193,407 | N/A (latest 2024) | Full-year 2025 data pending; this is complaint count, not attack count. | |
| US BEC losses (IC3) | $2.77B | N/A (latest 2024) | Full-year 2025 pending; reported U.S. fraud losses (confirmed transfers, etc.). | |
| Microsoft emails screened daily (avg) | 5B (reporting) | 5B (reporting) | → Stable | Global Microsoft 365/Outlook user telemetry (all threats). |
Phishing attacks remain at persistently high volume: APWG’s 2025 total (3.8M) is more a durability signal than a surge. Even a 4% Q4 drop (989K→853K) is within normal ebb and flow. No quarter in 2025 fell below Q4 2024 levels, indicating continuous industrialized campaign rotation rather than intermittent quiet.
Sector shares reveal shifting attacker ROI. In late 2024, SaaS/webmail was ~23% of lures; by Q4 2025, social media and SaaS/webmail each ~20% while telecom/IT jumped (18.7%). Attackers appear to be increasingly leveraging phone-based account recovery and messaging apps, consistent with rising SMS/BEC tactics.
Complaint and loss data must be interpreted as partial sightlines. FBI IC3 received 193,407 phishing/spoofing complaints in 2024, and $2.77B in BEC losses. Those are confirmed U.S. figures (mostly business reporting) and do not capture global volume or unreported impact. For enterprises, the key is to see these as confirmed harm floor values. The FBI notes phishing/spoofing was the top complaint category in 2024, highlighting phishing’s prominence in reported fraud.
Methodology context: APWG data are built from member and public reports of phishing URLs. IC3 data come from public complaints (self-selected victims). Microsoft data are telemetry from its cloud and email platforms and should not be treated as global totals; they reflect Microsoft’s visibility and customer footprint rather than universal prevalence. Verizon DBIR data (used below) reflect vetted breach incidents with human involvement. Each dataset is granular to its scope, so we keep them separate when drawing conclusions.
| Indicator | Value | Change YoY | Notes |
|---|---|---|---|
| US BEC reported losses (IC3) | $2,770,151,146 (2024) | –6.0% vs 2023 | Direct reported fraud loss; does not include hidden losses or global cases. |
| US BEC complaints (IC3) | 21,442 (2024) | –0.2% vs 2023 | Complaint volume roughly unchanged; underreporting likely. |
| US phishing/spoofing complaints (IC3) | 193,407 (2024) | –35.3% vs 2023 | Category shifts reflect changing tactics and/or reporting behaviors. |
| US phishing/spoofing reported losses (IC3) | $70,013,036 (2024) | +273.8% vs 2023 | Spike may reflect a small number of large cases and complaint-classification effects; still far below BEC. |
| Avg. cost of a data breach (IBM/Ponemon) | $4.88M (2024) | +10% vs 2023 | Cross-industry average; includes downtime and investigation (source of cost, not attack vector-specific). |
| Avg. days to identify & contain phishing breach (IBM) | 261 days | Lifecycle cost driver even if fraud is halted. |
The business cost narrative is that clicks alone have no fixed price tag impact comes from what follows. IC3’s latest data show multi‑billion-dollar BEC losses remain steady, underscoring that even isolated successful social-engineering breaches yield outsized losses. However, a ~6% drop in reported BEC losses year-over-year doesn’t imply a massive security gain; it could reflect any number of factors (improved internal checks, slower reporting, or just statistical variance). Importantly, the “loss” figures should be viewed as confirmed transfers or payments, not total enterprise impact: legal, reputational, and recovery costs can vastly exceed the stolen amount.
Phishing/spoofing losses remain far below BEC in absolute dollar terms, but the 2024 increase (+274%) should be interpreted cautiously because complaint totals can be influenced by a small number of large cases, reporting behavior, and classification changes. A prudent approach is to treat these loss numbers as a lower bound on actual fraud: many victims never report or detect such crimes, especially in unregulated sectors. Thus, phishing telemetry = pressure signal, while complaint/loss data = confirmed harm signal.
Non-fraud costs dominate internal impact. IBM’s data breach report shows that phishing-related incidents still take ~261 days to identify and contain (the longest of any vector), meaning hundreds of person-hours in forensics and business disruption. Those “hidden costs” (IT overtime, downtime, lost productivity, brand damage) often dwarf direct fraud loss.
Finally, remember: a million phishing emails (volume) is not equivalent to $X in loss. Our perspective keeps campaign volume, email clicks, credential theft, and actual loss clearly separated. Each must be weighed on its own: campaign counts and email volume for risk exposure, training stats for user susceptibility, and complaint/loss figures for quantified damage. These metrics drive different budget and control decisions.
Credential phishing is the mass delivery of fake login interfaces or SSO/OAuth lures to harvest passwords, tokens, or session cookies. It remains a leading path to corporate access because many account-takeover incidents still begin with stolen credentials, captured session material, or consent abuse. Attackers have shifted focus to cloud identity flows (Azure AD, Okta, Google Workspace) since those are gateway to email, files, and privileged accounts. Modern tactics include adversary-in-the-middle phishing-as-a-service (where users enter credentials and then real-time OTPs, yielding live sessions) and OAuth consent phishing (tricking users into granting malicious apps broad permissions).
Why it matters: Once an attacker has a valid credential or token, they can move laterally, exfiltrate data, or initiate fraud under the guise of a legitimate user. In 2025, Microsoft observed that identity-based attacks spiked (up 32% in H1 2025) as adversaries weaponized AI and token flows. MFA and phishing-resistant factors can dramatically reduce this risk (MFA blocks over 99% of identity-based compromises), but only if implemented and monitored properly.
Business Email Compromise (BEC) is a targeted subset of phishing focused on financial fraud. Attackers impersonate a trusted executive or supplier and manipulate payment processes (invoice fraud, payroll diversion, vendor account changes). Though BEC email volumes are far lower than mass phishing, the stakes are high: IC3 data show BEC as the top source of phishing-related losses ($2.77B in 2024).
Operationally, BEC attacks usually chain initial access (often via phishing, account takeover, or replay of legitimate reply-chains) to action. For example, APWG/Fortra reported that wire-transfer BEC requests jumped 136% in Q4 2025, even as average requested amounts (~$50.3K) remained modest. Gift cards, wire transfers, and payroll remain the primary cash-out methods (59%, 17%, 8% respectively in Q4 2025).
Why it matters: BEC attacks exploit process trust. A single successful email can bypass automated controls (it looks like a business email) and authorize payments. For decision-makers, the implication is that strong multi-step verification is needed in finance processes (e.g. call-back verification of any payment change). Preventing phishing alone (e.g. email filters) catches only part of BEC risk; the rest lies in catching anomalies in approval workflows.
Traditional phishing lures use malicious links and attachments to infect endpoints or steal credentials. Link-based lures (URLs pointing to fake login pages) dominated global phishing in 2025, and APWG notes that most phishing emails include multiple URLs (to evade simple URL filtering). These links lead victims to credential harvesters or drive-by downloads.
Attachment-based phishing (malicious Office docs, PDFs, or HTML smuggling payloads) is still widely used, especially to install malware or drop ransomware. Phishing attachments have become more elaborate (password-protected archives, embedded executables) and often fool users in urgent contexts. Training simulations indicate attachments produce higher failure rates than plain links, which matches real incident patterns: when users think “document” rather than “link,” they tend to bypass simple hover checks.
Why it matters: If a link or attachment bypasses email defenses, it can directly install malware (credential loggers, ransomware) or redirect to a login page. Defenders must assume any clicked link or opened attachment could be malicious. The enterprise response should include endpoint protection (sandboxing attachments), link analysis (time-of-click scanning), and user habits training. It also means “blocking phishing” requires more than blocking URLs in mail; it involves network and endpoint monitoring.
Phishing increasingly spans beyond email. Attackers use SMS (smishing) to deliver malicious links (bypassing email gateways), voice calls (vishing) to trick helpdesk or reset MFA, and chat/collaboration (Teams, Slack) to abuse internal trust. APWG reported rising smishing volumes in late 2025, noting SMS was used to deliver credential phishing and MFA bypass lures.
Collaboration platforms are prized because they innately authenticate the sender and often lack phishing controls. Simulated attacks confirm this trend: a sizable share of training campaigns now target Teams/Slack with malicious links or files, resulting in notable user clicks.
Why it matters: Phishing cannot be labeled an “email only” problem. Any channel where users click unvetted content is at risk. Security teams must extend protection and user training to mobile devices, messaging apps, and telephony. For example, enabling “report phishing” in Teams/Slack and enforcing SMS security policies (block known malicious SMS providers) help close off these auxiliary channels.
| Vector / Method | Share or Relevance | Impact / Cost | Notes |
|---|---|---|---|
| Email links (phishing URLs) | High (bulk campaigns) | Credential theft, malware | Dominant initial vector; often multiple URLs per message |
| Malicious attachments (docs, HTML) | High (targeted malware) | Malware/Ransomware damage | Prefabricated malware payloads; bypasses URL defenses |
| Vendor impersonation (invoices) | High (targeted attacks) | Direct financial fraud | Often delivered by email with spoofed vendor address; A/P teams targeted |
| Executive impersonation | Med–High (targeted attacks) | High-value fraud | Spearphish or deepfake calls for payment changes; CFO/dept heads targeted |
| Reply-chain hijacking | Med–High (spearphish) | Trusted communications | Breached or spoofed internal emails gain inherent trust; hard to detect |
| SMS phishing (Smishing) | Med–High (emerging) | Account recovery fraud | Direct attack on mobile; often combined with stolen credentials for MFA |
| Voice phishing (Vishing) | Medium | IT/social engineering | MFA reset or helpdesk call abuse; gets around email inbox entirely |
| Collaboration platform abuse | Medium | Internal trust abuse | Phishing in Teams/Slack; invites to malicious cloud resources |
| OAuth app consent & device-code phishing | Medium | Token theft | Exploits legitimate auth flows; often bypasses passwords/MFA |
| QR code phishing | Medium | Mobile device compromise | Legitimate-looking QR lures with malicious payloads or links |
Most successful phishing-based breaches are multi-step. A typical chain: the adversary sends an initial email (or SMS/chat) that abuses trust (e.g. a brand logo or a known contact). Once a victim clicks or enters credentials, attackers hijack accounts or mailboxes (setting inbox rules or forwarding). This allows them to circulate further phish within the organization or reach high-value targets internally. Successful phish often conclude in financial theft, data exfiltration, or ransomware deployment.
Mapping to MITRE ATT&CK: Initial phishing aligns to T1566 (Phishing) with sub-techniques (URLs, attachments). Post-compromise access often uses T1078 (Valid Accounts) and T1098 (Account Manipulation) as attackers use stolen credentials. Financial exfiltration might involve T1110 (Brute Force), T1114 (Email Collection), and T1485 (Data Destruction) in ransomware cases.
| Industry | Exposure Level | Typical Impact Pattern | Key Notes |
|---|---|---|---|
| Healthcare | High | Credential & data theft; downtime risk | Complex identity sprawl; patient-care impact if systems locked. Breaches often aim for PHI theft or extortion. |
| Finance/Banking | High | BEC, account takeover, fraud | High-value transactions and compliance scrutiny. Social-engineering attacks often target finance teams. |
| Technology/IT | High | SaaS credential theft; IP theft | Large cloud footprint; compromised developer/admin accounts can expose intellectual property or enable wide breaches. |
| Manufacturing | Medium–High | Supplier impersonation; Ransomware | Broad supply chains and OT environments; delays cost dearly. |
| Retail/E-commerce | High | Brand impersonation, payment fraud | Customer communications (invoices, delivery notices) are phish targets. Peak seasons amplify risk. |
| Government/Public | Medium–High | Spearphishing of officials; ransomware | High-value data and citizen records; state focus on supply chain (critical infrastructure). |
Verizon DBIR 2025 highlights that social engineering is a top breach pattern in finance, retail, and tech sectors (around 16-22% of breaches as initial access). Technology firms see larger blast radii from single compromised identities, while finance and retail suffer direct theft. Healthcare and government endure extended disruptions: even thwarted phish can trigger hours of investigation that delay care or public services. In practice, industries with stringent identity and payment controls tend to contain phishing better, whereas sectors reliant on third-party communications (manufacturing, retail, supply chain) see higher impact per successful phish.
| Region | Key Trend | Impact Signal | Notes |
|---|---|---|---|
| United States | Continued high fraud losses | $2.77B BEC (2024, IC3) | Large complaint volume; high reporting and regulation pressure |
| EMEA (Europe) | Social engineering as major breach vector | Social Engineering ~19% of breaches (DBIR) | GDPR/disclosure enhances breach visibility; finance and government targets |
| APAC | Elevated incident counts | Social Engineering ~17% of breaches (DBIR) | Rapid tech adoption; digital payments and BEC risk in emerging economies |
| LAC (Latin America & Caribbean) | Rising phishing and extortion | Social Engineering significant in breaches (DBIR) | Underreporting likely; local banking/payment fraud remains pervasive |
| Global | Growing digital payment and impersonation exposure | Evidence remains fragmented; underreporting likely | Rapid digitization, supplier trust abuse, and variable national reporting maturity complicate regional comparison. |
In the absence of a global phishing registry, regional patterns come from mixed sources: complaint volume (strongest in US), macro breach studies (Verizon’s DBIR), and provider telemetry (Microsoft, Google). Verizon’s regional analysis shows social engineering consistently among top breach causes in Europe, APAC, and globally. The US stands out by having robust reporting via IC3 (hence the $2.77B BEC loss in 2024). Europe’s regulatory environment yields detailed incident disclosures, often highlighting phishing-based intrusions in finance and healthcare. APAC’s outsourcing economies see frequent supplier BEC attacks, although aggregate statistics are sparse. In all regions, third-party phish (via partners or vendors) and cloud identity breaches are major cross-border risks.
Each of these cases was documented by security research (Microsoft, Fortra, APWG) rather than media leaks. They underline the shift: credential theft and account compromise (Tycoon 2FA) or process abuse (BEC gang) are core concerns, not just high-volume email spam.
| Attribute | Phishing | Business Email Compromise | Broader Social Engineering |
|---|---|---|---|
| Primary Objective | Credential/token theft; malware delivery; wide initial access | Fraud (payment diversion, data theft) | Human manipulation for any goal (beyond email) |
| Typical Delivery | Email (or multi-channel) with malicious link/attachment | Email impersonation in trusted workflow | Email, phone, SMS, in-person, or hybrid |
| Financial Impact Pattern | High volume; per-event loss often small (credential reuse); indirect breach cost | Low volume; per-event loss very high | Variable: could be none, data breaches, or fraud |
| Credential Theft Role | Often essential (key goal) | Often enabler (compromise used for internal phishing) | Optional (some pretexting uses persuasion only) |
| Detection Pattern | Email filters, user reports, time-of-click scanning | Process anomalies (unusual invoice, new account), mailbox rules | Hard to detect automatically; relies on cross-org intelligence |
| Executive Relevance | Important (CEO domains phished often) | Critical (direct C-level financial exposure) | Board-level (overall fraud and espionage exposure) |
These data points guide practical decisions:
Expected Loss = Probability × Impact.
Accurate modeling requires mapping phishing stats to these terms. For probability, use measures of exposure and defense gaps: e.g. proportion of spam still getting through, user click rates, and observed successful spearphish incidents (internal logs). For impact, use known loss amounts (IC3 BEC figures or in-house incident cost data) plus downtime figures.
Illustrative example (hypothetical): an organization estimates a 5% annual chance that one of its payroll officers will be targeted successfully by a sophisticated BEC email (based on sector trends). If an average fraud event costs $100,000 in transferred funds and $50,000 in remediation, then Expected Loss = 0.05 * $150,000 = $7,500 per year. They then consider an MFA project costing $100,000 that might cut that probability to 1% (new EL = $1,500). With a $6,000 annual risk reduction, the MFA investment could be justified in about 17 years likely too long. But if they instead focus on adding a strict vendor-verification step (cost $10K) that cuts probability to 0.5% (EL = $750), then the payback is much faster.
The point: phishing stats (attack volumes, success rates, loss sizes) feed into this model. External statistics calibrate the estimates (are you below or above industry norms?). For example, if your board knows IC3’s multi-billion-dollar BEC loss floor, even a small modeled probability yields a significant risk number. The key is to avoid “just hoping it won’t happen”; use data to quantify your specific expected loss scenario.
Measured data about phishing activity such as number of phishing campaigns detected, email volumes, user click rates, credential submissions, reported BEC cases, and loss amounts always within a defined scope (telemetry, simulation, complaints). Phishing stats are context-specific indicators (telemetry = pressure; losses = confirmed harm).
Extremely common in telemetry. APWG recorded 3.8 million distinct phishing attack sites in 2025, indicating industry-scale automation. A more accessible lens: IC3 saw phishing/spoofing as the #1 complaint category in 2024. So while many individual phishes go unreported, both threat feeds and complaints signal that phishing is very frequent.
Any industry with email and payments is targeted. Recent data highlight finance and e-commerce (transaction targets), technology (cloud identities), and healthcare (high-value data) as high-risk sectors. APWG consistently finds SaaS/webmail and social platforms heavily targeted, which implicates tech and higher-ed as well. Verizon’s breach reports show social engineering as a leading breach pattern in finance and retail. In short, focus on high-identity/high-finance sectors, but don’t overlook smaller sectors: attackers exploit trust everywhere.
Phishing is the broader category of trust-based attacks. BEC is a specialized subset of phishing aimed specifically at defrauding companies through invoice/payment scams. In practice, most BEC schemes start with phishing or account takeover (to gain a foothold) and then proceed to impersonate a CEO or supplier to get money.
Costs vary widely. IC3 reports billions in BEC losses, but that’s the tip of the iceberg. For individual companies, a successful phishing incident can mean hundreds of thousands in direct loss plus far more in investigation, system lockdowns, and brand impact. IBM’s breach report shows phishing-related breaches incur multimillion-dollar impact on average (due to detection and remediation).
Phishing often provides initial access (e.g. stolen login or malware drop). Attackers then use that access for follow-on attacks: lateral movement to plant ransomware, internal phishing to broaden access, or direct BEC to drain funds. For instance, a phished admin credential might let attackers deploy crypto-lockers, while a compromised CFO email might be used to approve a fake invoice payment.
By layering defenses. Key measures include phishing-resistant MFA, strict email authentication (DMARC/SPF/DKIM), secure email gateways with real-time link scanning, and red team/purple team exercises supported by penetration testing services in the U.S.
Yes. Complaint data capture only cases where victims come forward. Many companies secretly absorb losses (especially BEC) or never realize smaller steals. Surveys indicate a significant portion of organizations never report cyber fraud, and some losses (like account-takeover attempts) are mitigated internally without formal complaint. Thus, IC3’s figures represent just the known minimum.
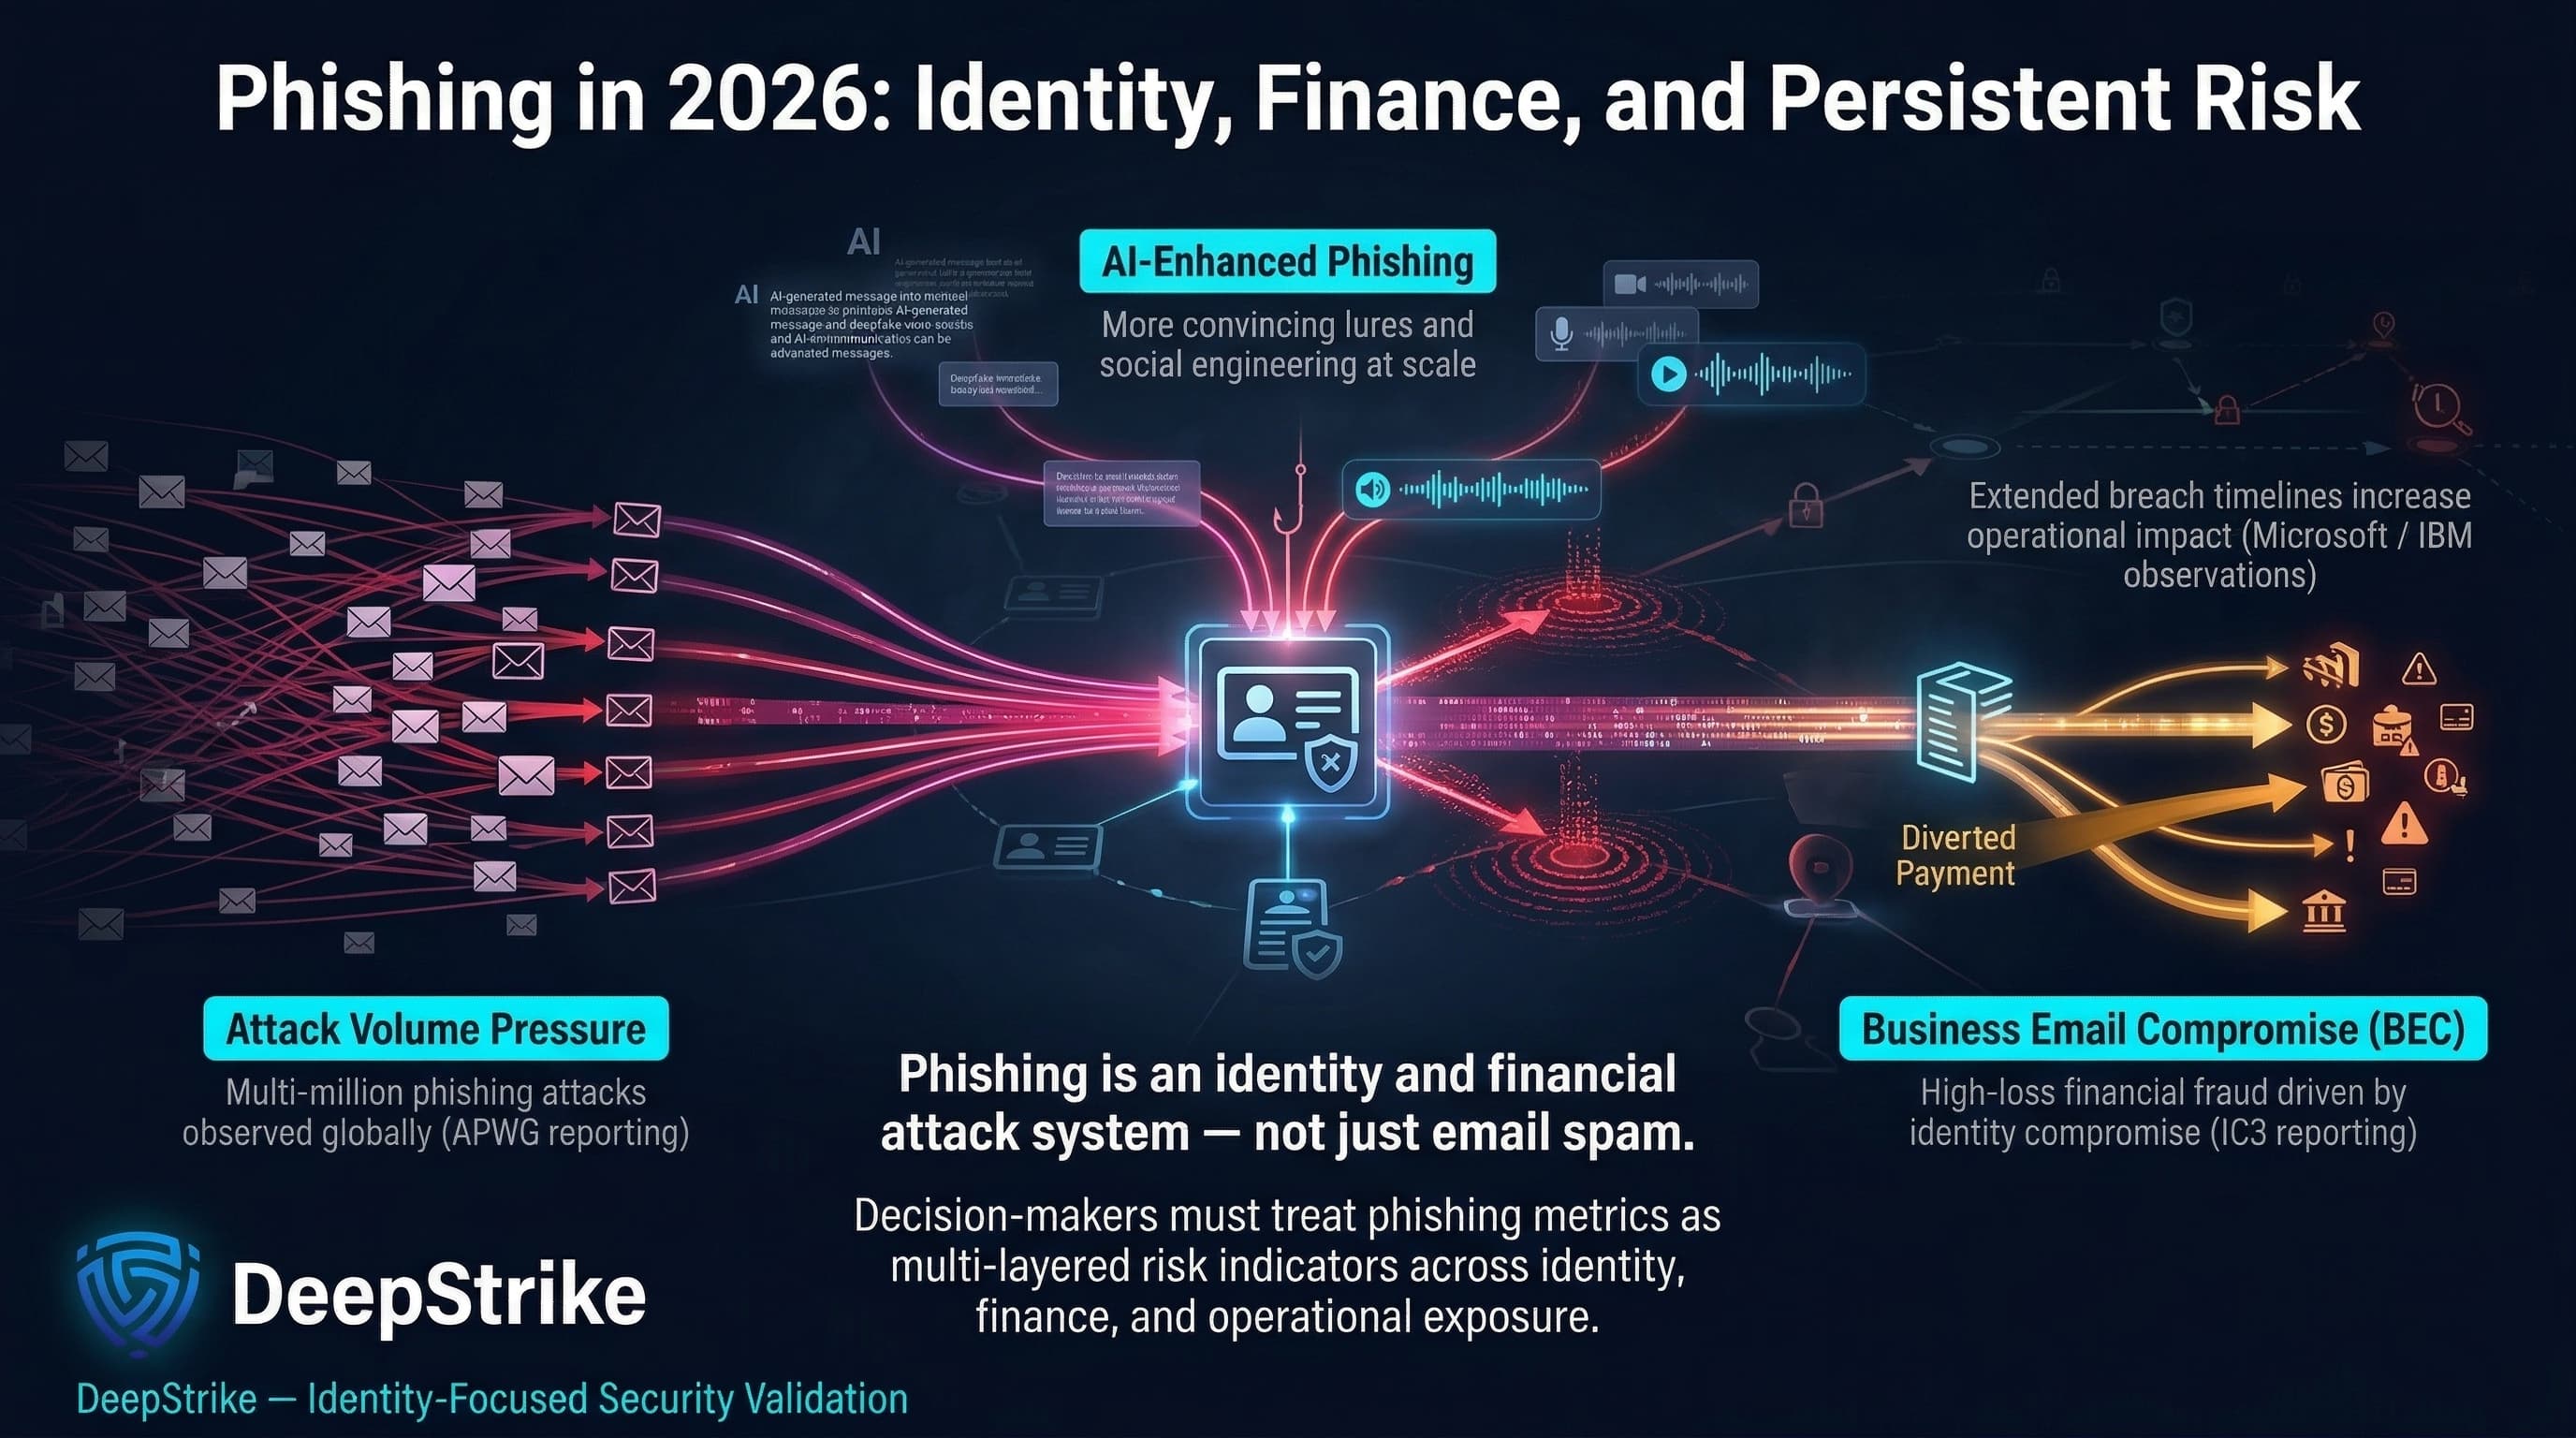
Phishing data for 2026 planning reinforce key truths: phishing is a persistent, evolving identity/finance problem, not just spam. APWG’s multi-million attack count signals unrelenting attacker pressure. IC3’s BEC losses remind us of the confirmed harm at stake. Microsoft and IBM metrics reveal new scales (AI-enhanced lures, multi-month breach timelines). Decision-makers must therefore treat phishing statistics as multi-faceted risk signals. The data underscore that effective defense is both identity-centric (strong authentication, token monitoring) and process-centric (payment verification, vendor checks), augmented by continuous testing. In short, phishing isn’t confined to email alone; it is an enterprise risk loop from compromised identity to fraud. Organizations should use these statistics to guide a layered strategy: tighten identity and email defenses, validate financial workflows, conduct aggressive simulation and pen testing with UK penetration testing services, and detect/report phishing quickly. The raw numbers of emails or clicks matter only insofar as they drive those concrete controls and investment priorities.
Mohammed Khalil is a Cybersecurity Architect at DeepStrike, specializing in advanced penetration testing and offensive security operations. With certifications including CISSP, OSCP, and OSWE, he has led numerous red team engagements for Fortune 500 companies, focusing on cloud security, application vulnerabilities, and adversary emulation. His work involves dissecting complex attack chains and developing resilient defense strategies for clients in the finance, healthcare, and technology sectors.

Stay secure with DeepStrike penetration testing services. Reach out for a quote or customized technical proposal today
Contact Us