August 2, 2026
Updated: September 15, 2026
CertiK, TRM Labs, Chainalysis, and FBI data on 2025 and H1 2026 crypto theft, with a cross-source methodology matrix and original charts.
Abdalla Mohamed
Data note. Every figure in this guide is attributed to a named source and reporting period. Blockchain-analytics totals are modeled estimates that may be revised as more incidents, addresses, recoveries, and attributions are identified. Different trackers also use different scopes and classification rules. Where sources disagree, this guide reports them separately instead of blending them into a false consensus.
Web3 security in 2026 can be summarized in one sentence: attack counts remain high, a handful of infrastructure failures still create catastrophic losses, and people, keys, and signing workflows now matter as much as smart-contract code.
The numbers are immediate. Chainalysis estimated more than $3.4 billion stolen in 2025. CertiK counted $1.316 billion across 344 incidents in H1 2026. TRM Labs counted 207 hacks, its highest six-month total, even though its recorded loss fell to $972 million. Wallet compromise caused more than $444 million in losses, while code vulnerabilities remained the most frequent CertiK category at 204 incidents. North Korea-linked activity accounted for approximately 66% of TRM's H1 loss total.
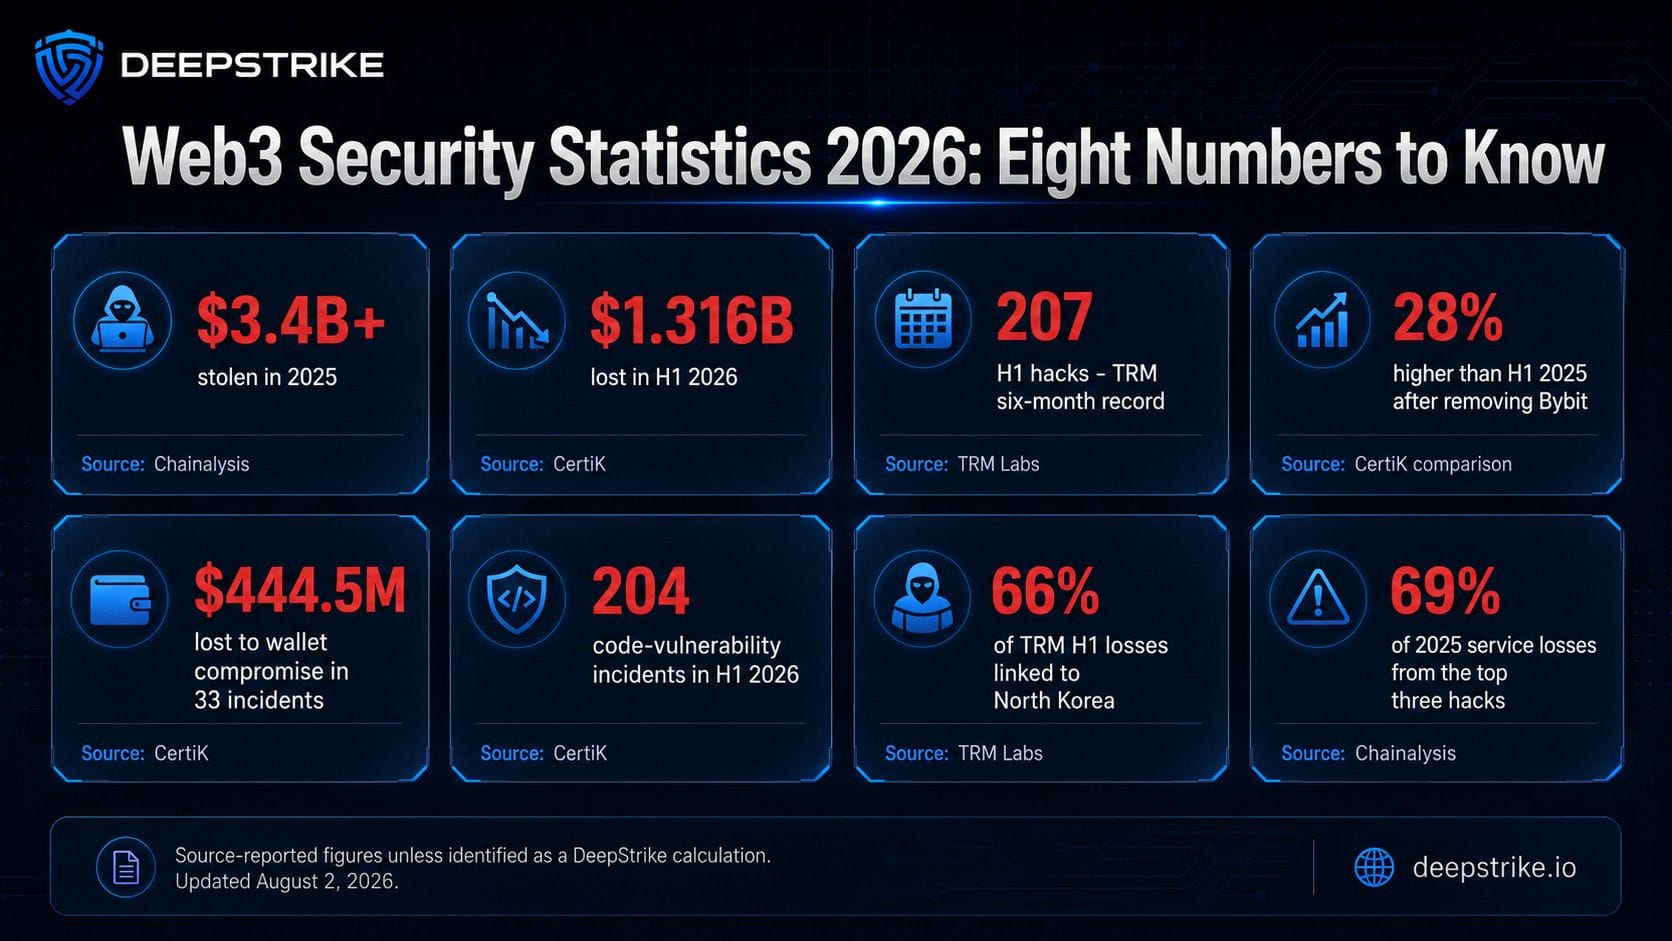
Eight key Web3 security statistics for 2026
This page is built as a reusable research resource for journalists, cybersecurity teams, financial-crime analysts, developers, investors, policymakers, and academic researchers. It includes copy-ready statistics, a methodology comparison, and original statistical charts embedded throughout the article.
The statements below are written so journalists and researchers can cite them directly while retaining the original source.
CertiK's 2025 annual report counted $3,352,850,816 in losses across 630 incidents. Its restated 2024 comparison baseline was $2,446,285,251, making 2025 a 37.06% increase in value. However, the annual increase was dominated by Bybit. CertiK calculated the Bybit loss at $1,447,063,421; without it, 2025 would have recorded less loss than the restated 2024 baseline.
Chainalysis used a different stolen-funds methodology and estimated that more than $3.4 billion was stolen in 2025. The two figures are directionally consistent but are not interchangeable.
For H1 2026:
The correct headline is not "all trackers recorded a universal incident record." It is:
TRM Labs recorded a six-month incident high in H1 2026, while CertiK recorded a roughly flat year-over-year incident count under a different classification framework.
The largest Web3 loss totals are highly concentrated. Chainalysis reported that the top three hacks caused 69% of 2025 service losses. The largest incident was more than 1,000 times the median hack, the first time that ratio had crossed the 1,000x threshold in its data.
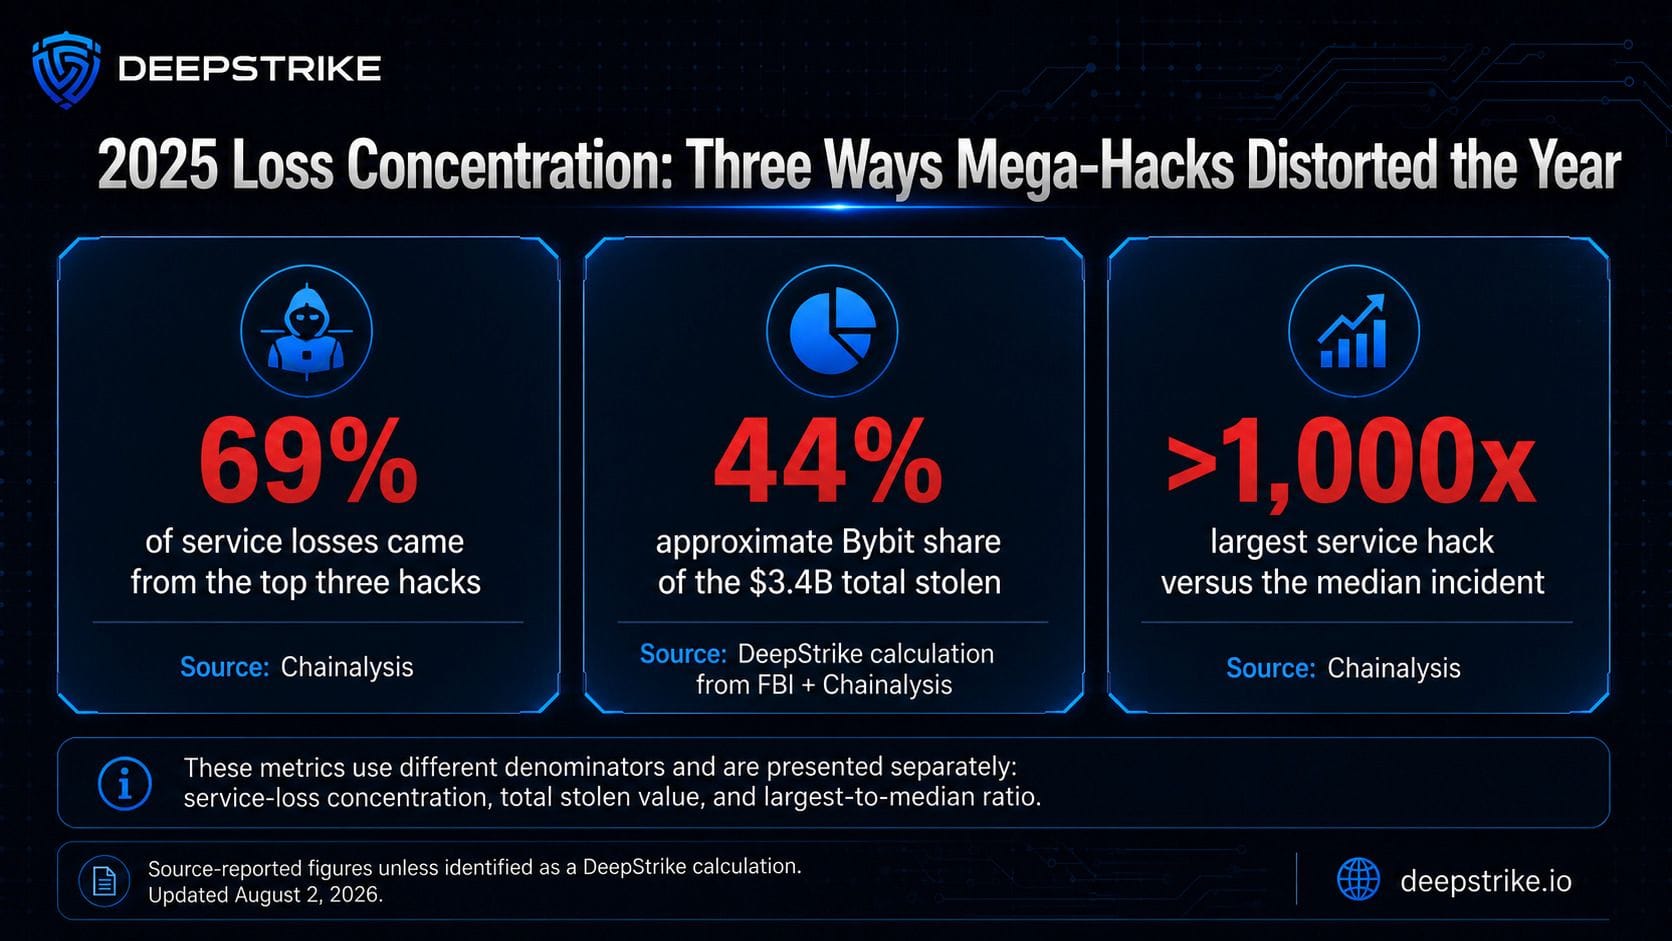
2025 crypto theft concentration
The concentration metrics use different denominators and should be cited separately. Chainalysis's 69% figure applies to service losses, while Bybit's approximate 44% share is a DeepStrike calculation using the FBI's $1.5 billion estimate and Chainalysis's broader $3.4 billion stolen-funds total. The largest-to-median ratio is a third measure of outlier severity.
This is the money-and-risk story in its simplest form: most incidents are not billion-dollar events, but one trusted signer, compromised key, or manipulated interface can dominate an entire year's loss total.
CertiK's originally published 2024 report listed $2,362,748,975.83 across 760 incidents. Its 2025 annual comparison later used a higher 2024 loss baseline of $2,446,285,251 and stated that 2025's 630 incidents were 137 fewer than 2024, implying a revised count of 767 incidents.
| CertiK 2024 version | Losses | Incidents | How to cite it |
|---|---|---|---|
| Original 2024 publication | $2.363B | 760 | Use when discussing the originally published report |
| Restated comparison in the 2025 report | $2.446B | 767 implied | Use for CertiK's 2025 year-over-year comparison |
This is why statistics resources should include a source date and version. Blockchain-security datasets are routinely revised as classifications change and additional losses are traced.
CertiK's H1 2026 total was 46.8% lower than its H1 2025 total of $2.474 billion. That percentage is mathematically correct but incomplete because H1 2025 included the $1.447 billion Bybit outlier.
Using CertiK's figures:
H1 2026 was therefore approximately 28.2% higher than H1 2025 after removing Bybit. CertiK described the comparable increase as roughly 28%.
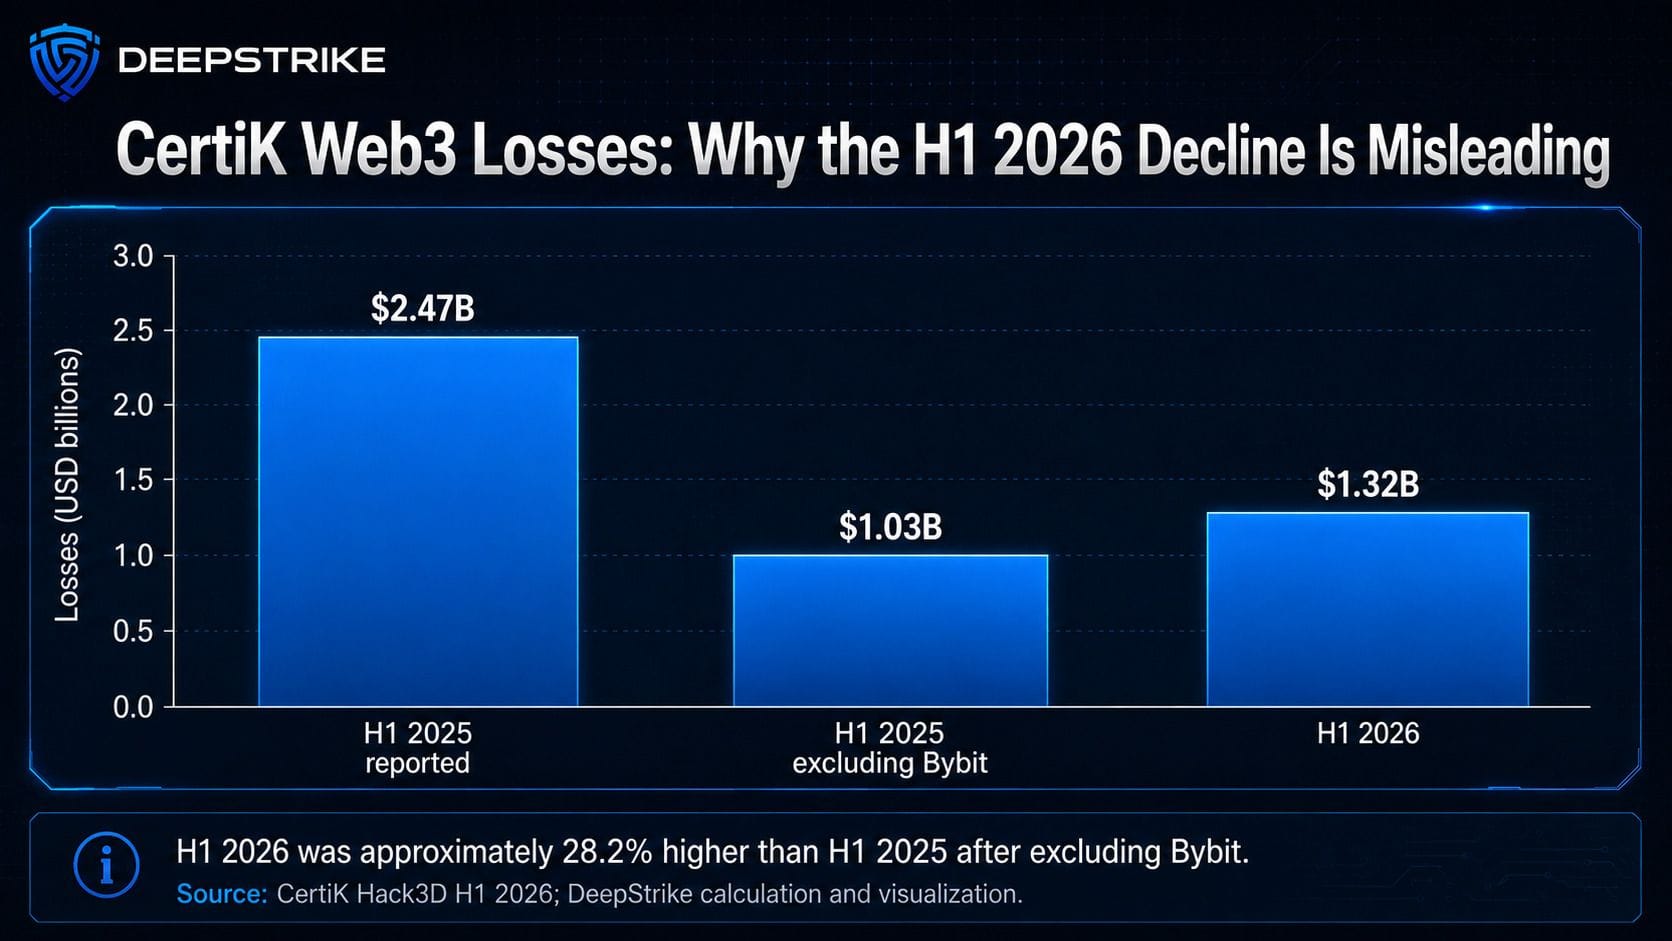
CertiK H1 losses before and after removing Bybit
The defensible interpretation is that 2026 has not produced another Bybit-scale event so far, but the underlying loss level has not improved.
The average loss is a poor description of a typical Web3 incident because a few extreme events pull the mean upward.
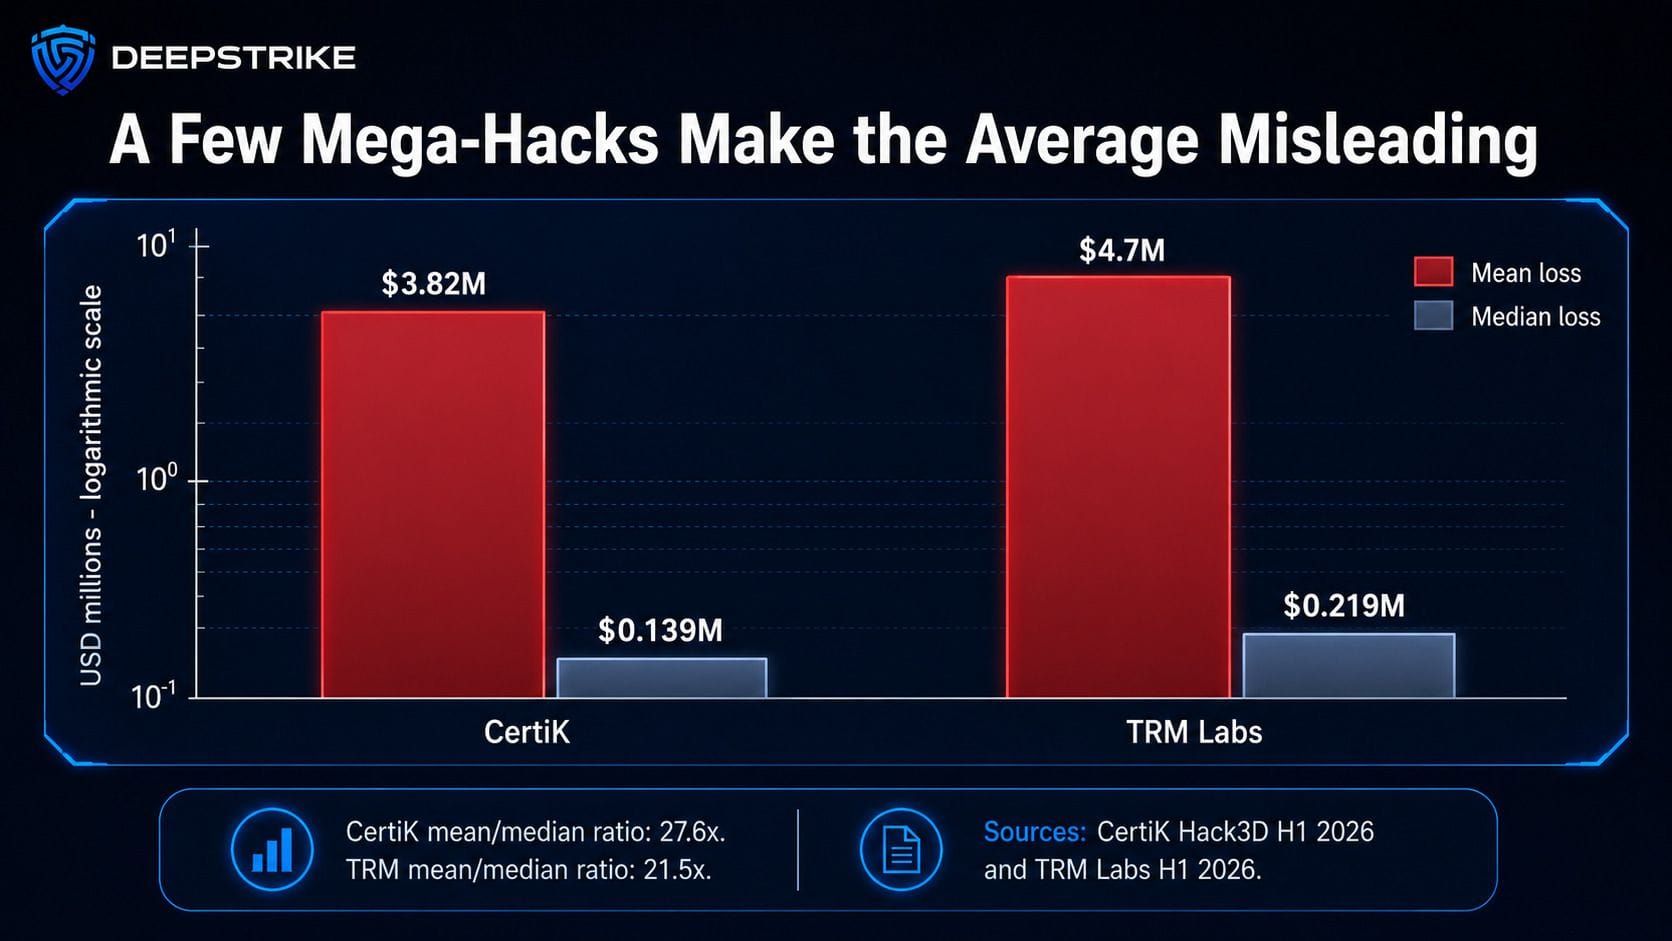
Mean versus median Web3 hack losses
For journalists and boards, the practical implication is simple: the median describes routine exposure; the mean describes the effect of catastrophic outliers. Security budgets and incident-response plans need to account for both.
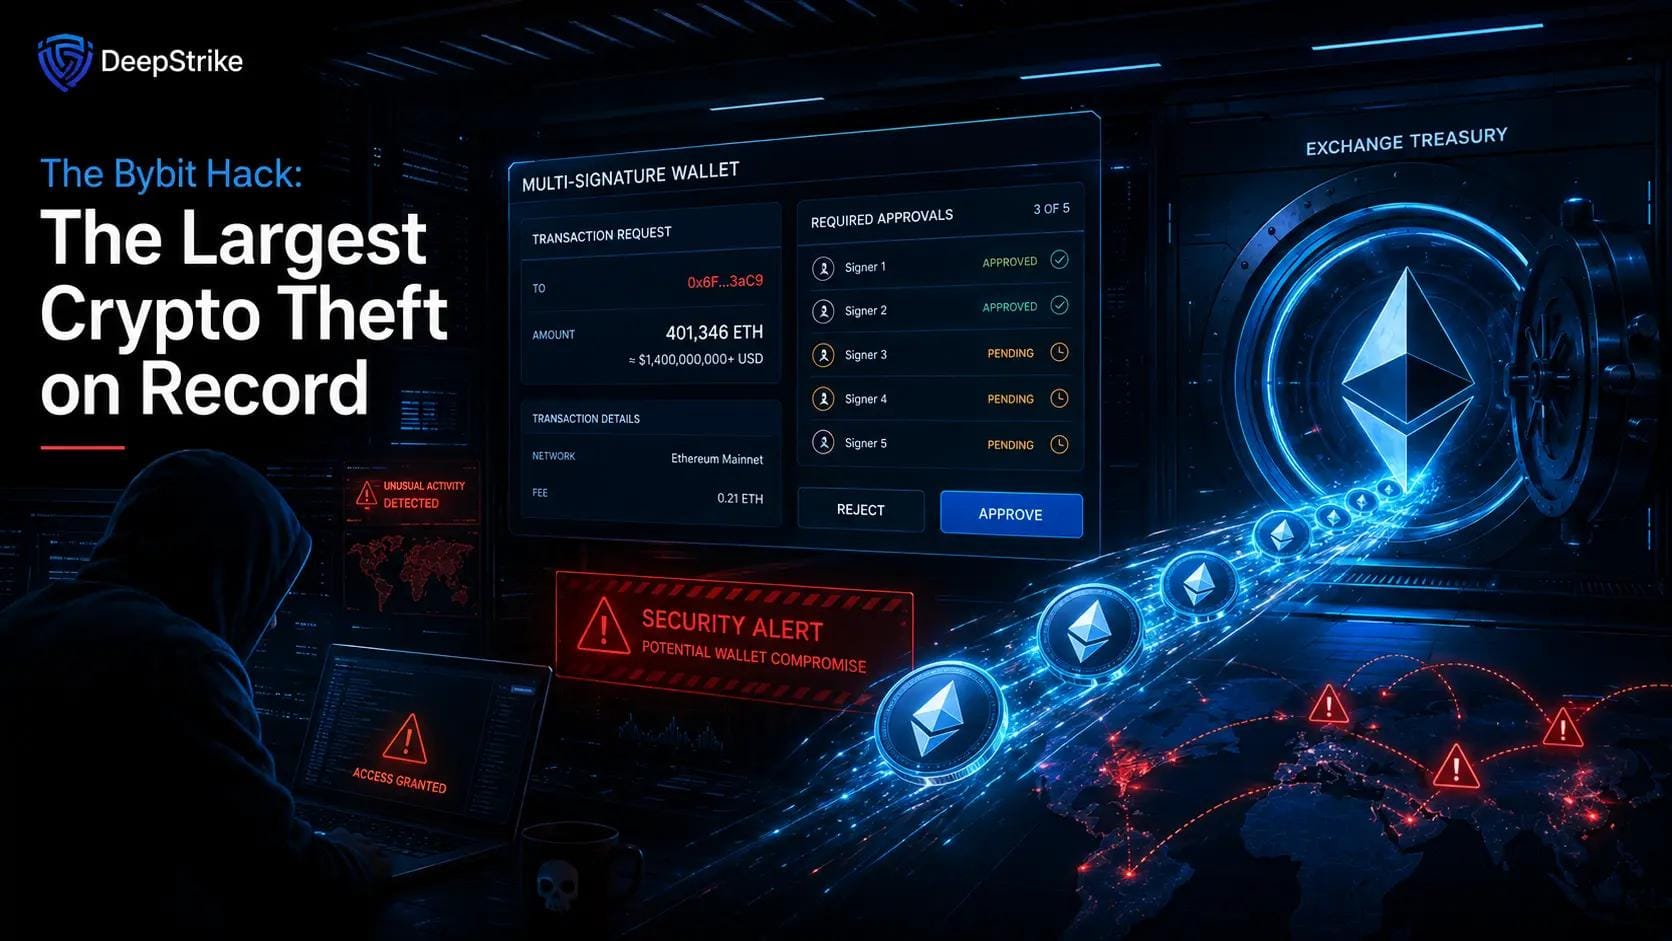
The Bybit Hack: The Largest Crypto Theft on Record
On February 21, 2025, Bybit lost approximately $1.45-$1.5 billion in virtual assets. The FBI attributed the theft to North Korea and tracks the activity as TraderTraitor.
The incident did not depend on a conventional smart-contract vulnerability:
The human dimension is what makes the case broadly relevant: authorized people approved what appeared to be a legitimate transaction, while the compromised workflow caused the blockchain to execute something else. Contract auditing remained necessary, but it did not protect the developer endpoint, user interface, signer verification process, or custody workflow.
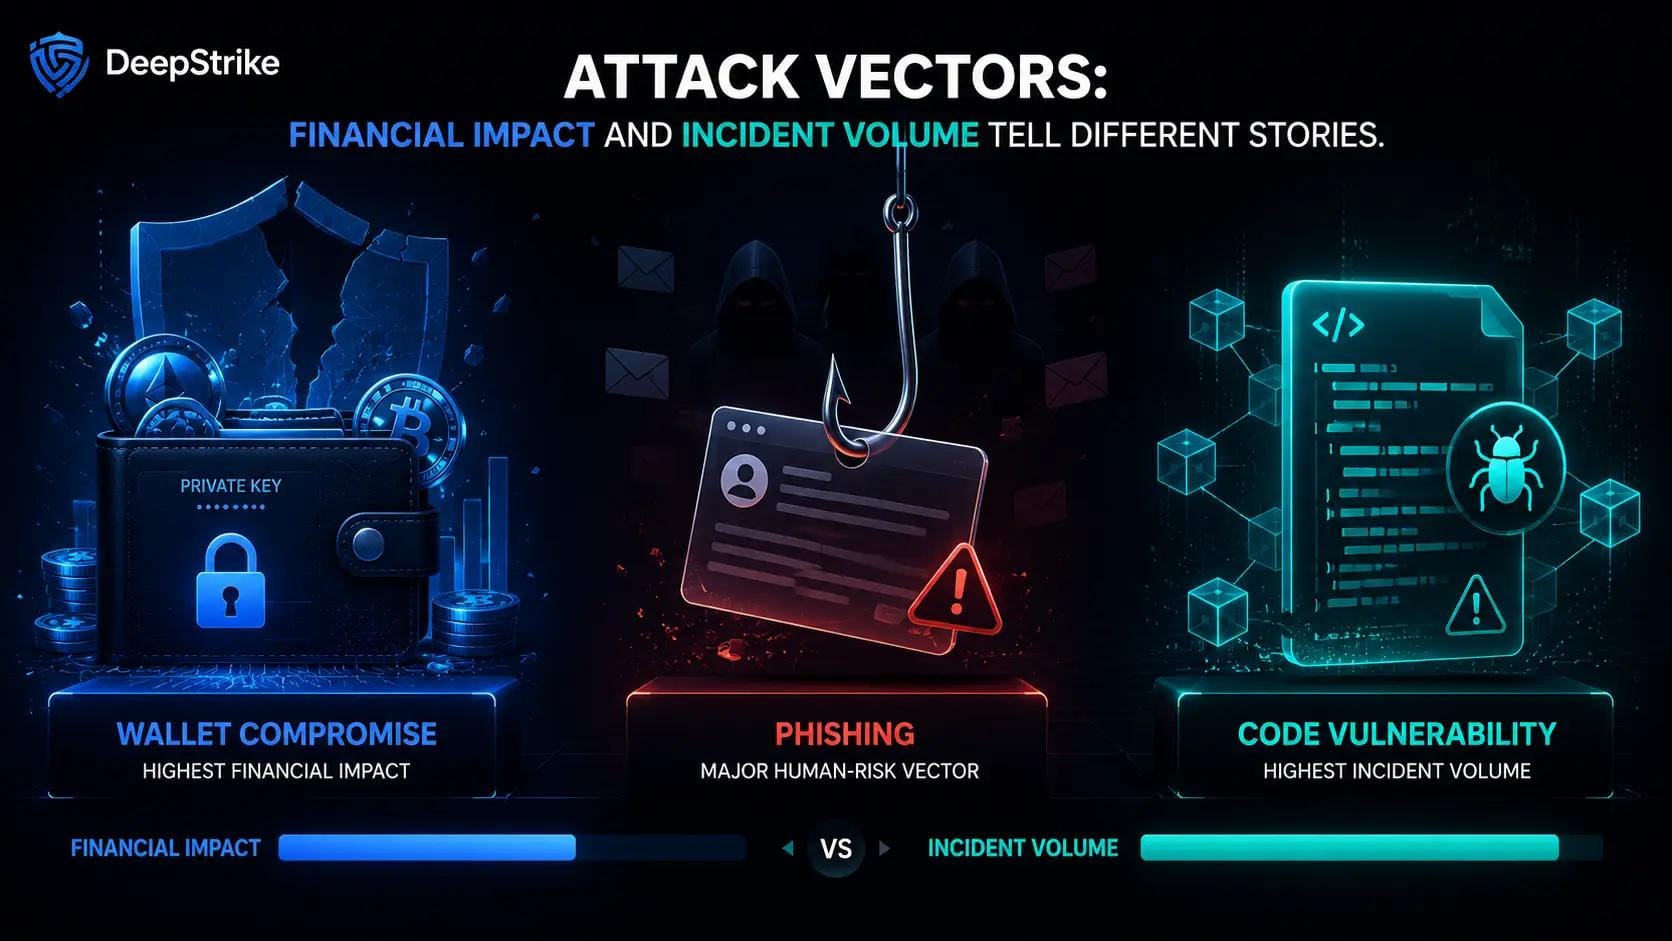
Attack vectors: financial impact and incident volume tell different stories
CertiK's H1 2026 data shows a divide between attack types that produced the most incidents and those that produced the largest losses.
| Attack vector | H1 2026 losses | Incidents | Average loss per incident* |
|---|---|---|---|
| Wallet compromise | $444.53M | 33 | $13.47M |
| Phishing | $366.31M | 63 | $5.81M |
| Code vulnerability | $151.59M | 204 | $0.74M |
Average values are DeepStrike calculations from CertiK's source-reported totals.
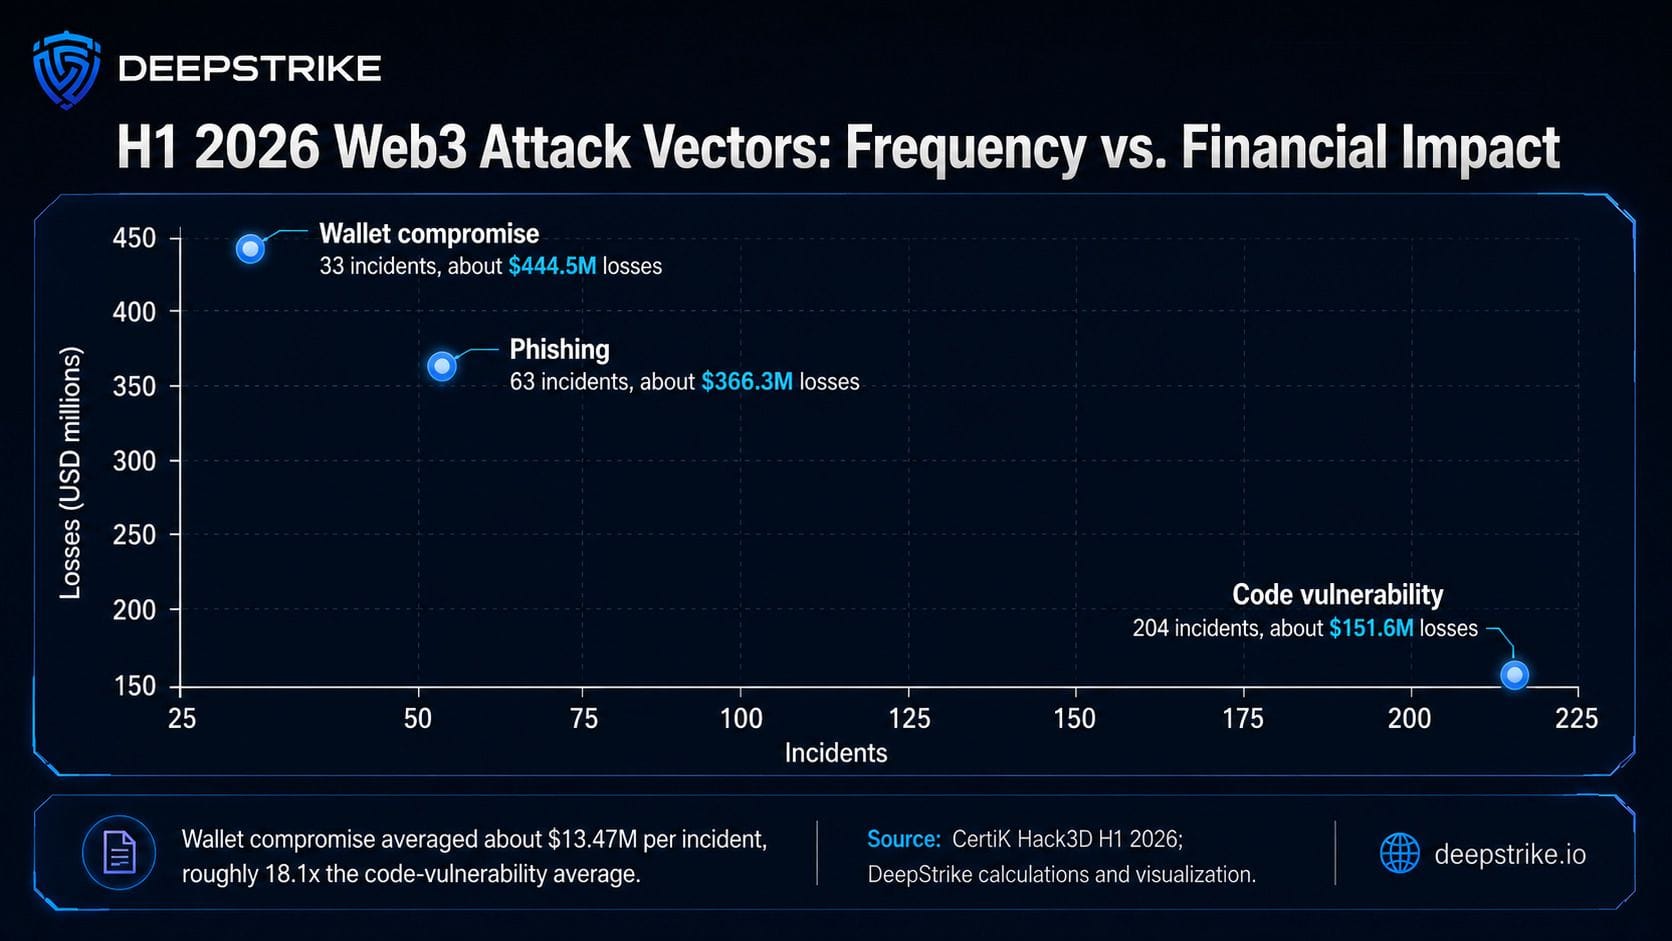
H1 2026 attack vectors by incidents and losses
The average wallet-compromise incident was approximately 18.1 times as costly as the average code-vulnerability incident.
TRM Labs reported the same structural split using a different classification system:
The accurate conclusion is:
Code vulnerabilities and smart-contract exploits drive attack frequency. Compromised wallets, keys, people, and infrastructure drive catastrophic loss.
CertiK recorded 63 phishing incidents in H1 2026, down 52.3% from 132 incidents in H1 2025. Losses, however, fell only 10.8%, to $366.31 million. Four incidents caused approximately 85% of phishing losses, equivalent to roughly $311.4 million.
The practical lesson is not that phishing is disappearing. It is that broad-volume phishing is being supplemented by highly targeted social engineering against people controlling significant assets, signing authority, or privileged access. The wider AI in cybersecurity trend also matters because generative tools can accelerate impersonation, reconnaissance, and message personalization.
Chainalysis estimated that North Korea-linked actors stole at least $2.02 billion in 2025, a 51% year-over-year increase, bringing the cumulative identified total to approximately $6.75 billion.
Relative to Chainalysis's estimate of more than $3.4 billion stolen globally, the DPRK figure represents roughly 59.4% of 2025 stolen value. TRM Labs separately estimated that North Korea-linked activity caused $643 million, or 66%, of its H1 2026 hack-loss total.
This makes Web3 security relevant to more than crypto companies. It intersects with:
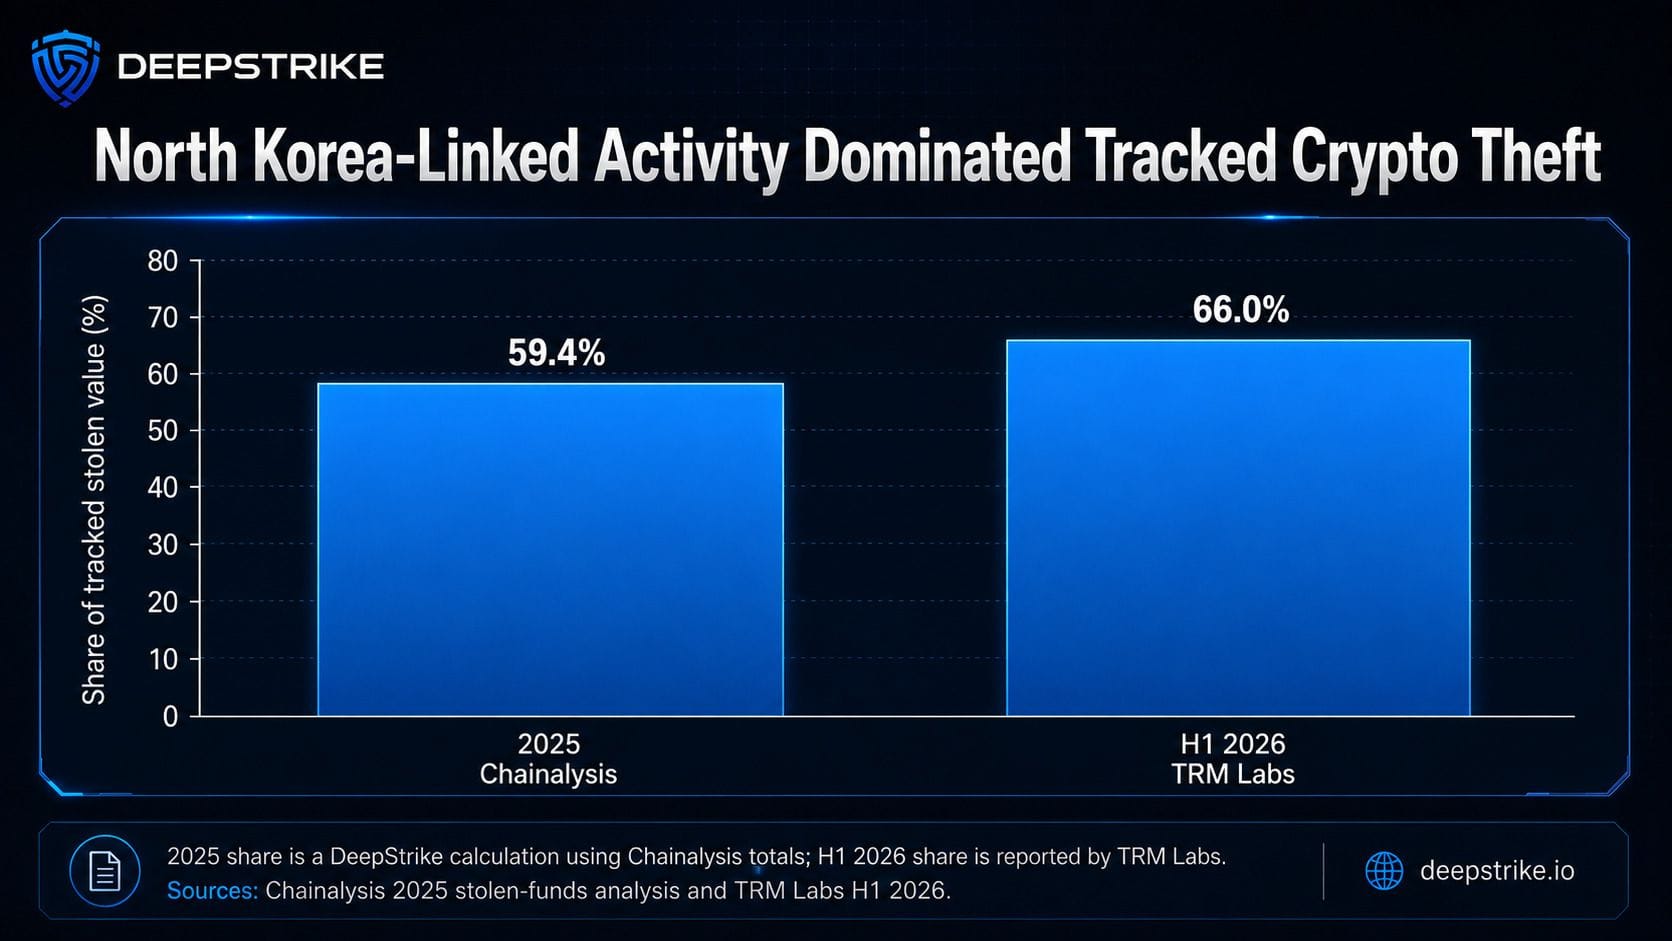
North Korea-linked share of tracked crypto theft
The enterprise mega-hacks receive most headlines, but Chainalysis also identified a broad consumer-security problem. It recorded approximately 158,000 individual wallet-compromise incidents affecting 80,000 unique victims in 2025, with about $713 million stolen.
That combination - many victims but a lower total than the largest institutional incidents - creates a second narrative for consumer-protection, identity-security, and wallet-safety reporting. Institutional losses are concentrated; personal-wallet harm is dispersed. Related research on bot attack statistics and credential stuffing statistics helps place automated account abuse and credential reuse in the broader identity-risk picture, and our crypto hacking incidents statistics breakdown tracks the same losses at the incident level.
Chainalysis reported that identified illicit cryptocurrency addresses received at least $154 billion in 2025, a 162% year-over-year increase.
That is not the amount stolen in hacks. The figure includes sanctions activity, fraud, scams, darknet markets, money-laundering services, stolen funds, and other identified illicit addresses.
Additional context matters:
By comparison, Chainalysis estimated more than $3.4 billion stolen through crypto theft in 2025. Any article claiming that "$154 billion was stolen from Web3" is conflating two fundamentally different metrics.
The data supports stories about private-key compromise, developer endpoints, phishing, access control, supply-chain risk, incident response, and asset recovery.
The mean-versus-median gap and the 69% concentration among the top three hacks show why average-loss planning is inadequate for custodians, exchanges, insurers, and boards. DeepStrike's cyber insurance claims statistics provide additional context for loss severity, coverage pressure, and board-level risk planning.
North Korea's theft share, covert IT-worker activity, cross-chain laundering, and the wider $154 billion illicit-flow figure connect Web3 security to sanctions enforcement and state-backed finance. Similar state-linked and supply-chain pressures appear across telecom cybersecurity statistics, energy and utilities cybersecurity statistics, and manufacturing cybersecurity statistics.
The 158,000 personal-wallet incidents and 80,000 victims support reporting on wallet security, impersonation, phishing, recovery, and user education.
The 204 CertiK code-vulnerability incidents and 125 TRM smart-contract exploits show that code security remains the most frequent technical problem even when operational compromise dominates financial loss.
The totals are not interchangeable because each organization measures a different slice of the ecosystem.
| Source | Period and headline figure | Scope | Important limitation | Best use |
|---|---|---|---|---|
| CertiK Hack3D | H1 2026: $1.316B, 344 incidents | Hacks, scams, and exploits under CertiK's classifications | Broader classification than TRM; reports gross, recovered, and adjusted losses | Attack-vector, chain, incident-count, and recovery analysis |
| TRM Labs | H1 2026: $972M, 207 hacks | Hacks and exploits in TRM's dataset | Does not represent all scams, fraud, or wider illicit revenue | Hack frequency, operational compromise, DPRK attribution |
| Chainalysis stolen-funds analysis | 2025: more than $3.4B stolen | Stolen funds attributed through blockchain analytics | Lower-bound figures may rise as more addresses are identified | Actor, victim-type, concentration, and laundering analysis |
| Chainalysis Crypto Crime Report | 2025: at least $154B to illicit addresses | Broad illicit-address inflows | Not a hacking-loss total | Crypto crime, sanctions, asset-type, and national-security context |
| FBI IC3 | Bybit: approximately $1.5B | Official incident attribution and advisory | Not an ecosystem-wide loss tracker | Law-enforcement attribution and laundering indicators |
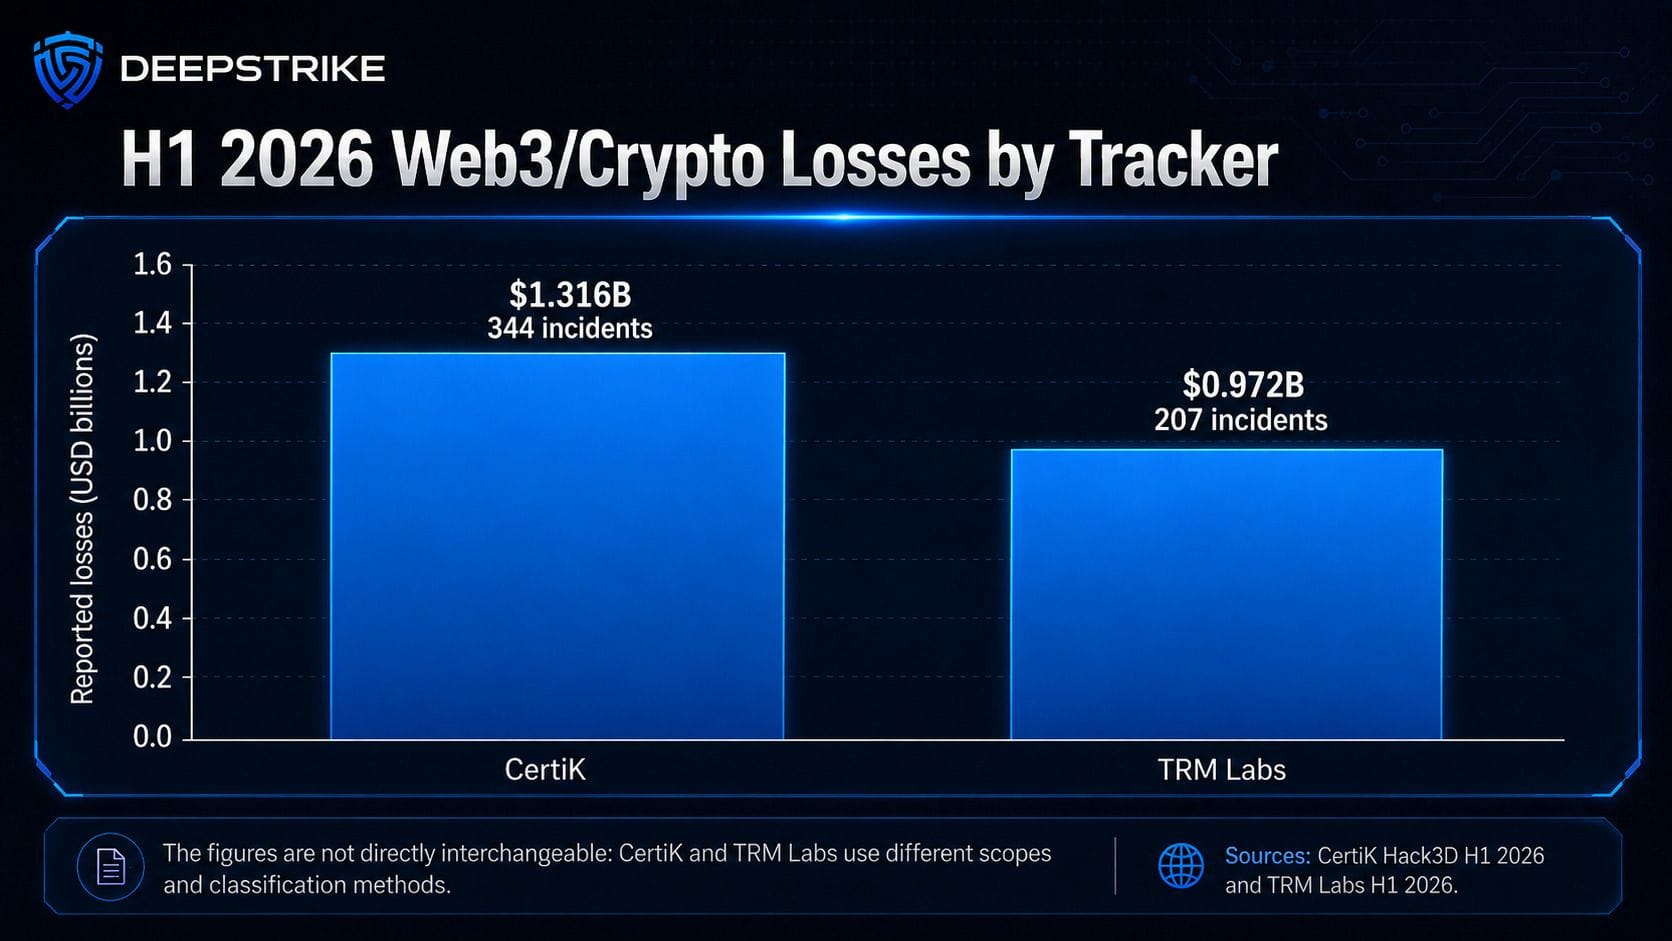
H1 2026 tracker comparison
| Data signal | What it means | Practical response |
|---|---|---|
| Code vulnerabilities caused 204 CertiK incidents | Application and contract defects remain frequent | Maintain pre-deployment audits, secure development practices, monitoring, and an ongoing bug bounty |
| Wallet compromise caused $444.53M in 33 incidents | A small number of custody failures can create catastrophic loss | Use hardware-backed signing, transaction simulation, independent verification, limits, and tested recovery procedures |
| Infrastructure caused 76% of TRM losses but about 15% of incidents | Catastrophic risk sits in keys, credentials, endpoints, and approval workflows | Test cloud, identity, developer endpoints, signing infrastructure, and administrative paths - not only contracts |
| Four incidents caused about 85% of CertiK phishing loss | Targeted social engineering matters more than campaign volume | Use phishing-resistant MFA, out-of-band verification, role separation, and executive/signatory protections |
| Top three hacks caused 69% of service losses | Annual loss totals are controlled by rare mega-events | Plan insurance, reserves, response, freezing, and crisis communications around severe but plausible events |
| $115.31M was frozen or returned | Response speed can materially reduce net loss | Pre-establish contacts with exchanges, analytics firms, RPC providers, bridges, law enforcement, and incident-response partners |
| North Korea caused 59%-66% of tracked stolen value in key datasets | Some teams face state-linked, patient adversaries | Screen hires and vendors, protect developer access, monitor insider risk, and rehearse nation-state intrusion scenarios |
CertiK reported $115,311,507 frozen or returned in H1 2026, reducing adjusted loss from $1.316 billion to approximately $1.200 billion. The recovered or frozen amount represented about 8.8% of gross loss.
This statistic is operationally important. Fast detection, address attribution, exchange coordination, bridge and RPC collaboration, and law-enforcement notification can change the final financial outcome even after an on-chain theft begins.
The 2026 figures cover only the first half of the year and should not be mechanically doubled into a full-year forecast. One mega-event can alter the annual total, and trackers may revise figures as funds are traced or recovered.
The most durable signals are:
The useful conclusion is not that the attack surface has moved completely from code to operations. It is that Web3 security has two simultaneous problems: frequent code exploitation and concentrated operational compromise.
CertiK reported approximately $3.353 billion in losses across 630 incidents. Chainalysis separately estimated more than $3.4 billion stolen. The totals differ because the organizations use different tracking and classification methods.
The February 21, 2025 Bybit theft, valued at approximately $1.45-$1.5 billion, is the largest publicly reported cryptocurrency theft. The FBI attributed it to North Korea and tracks the activity as TraderTraitor.
Both answers can be true depending on the metric. TRM Labs recorded 207 hacks, its highest six-month incident count, while total loss fell to $972 million. CertiK recorded 344 incidents, approximately flat year over year, and $1.316 billion in gross loss. After excluding Bybit from the H1 2025 baseline, CertiK's H1 2026 loss was about 28% higher.
By CertiK incident count, code vulnerability was the most common vector at 204 incidents. By financial loss, wallet compromise ranked first at $444.53 million. TRM similarly found that smart-contract exploits drove incident volume while infrastructure and operational compromise drove most losses.
They use different scopes, classifications, and incident-inclusion rules. Their totals should be cited separately rather than averaged or combined.
Chainalysis estimated that North Korea-linked actors stole at least $2.02 billion in 2025. TRM attributed approximately $643 million, or 66% of its H1 2026 hack losses, to North Korea-linked activity.
No. Chainalysis's $154 billion figure is the value received by identified illicit cryptocurrency addresses in 2025. It includes sanctions activity, fraud, scams, darknet markets, stolen funds, and other categories. Chainalysis estimated stolen cryptocurrency at more than $3.4 billion.
Name the original tracker for source-reported figures. Cite DeepStrike when using the cross-source methodology matrix, Bybit-adjusted analysis, original charts, or DeepStrike calculations.
DeepStrike reviewed the primary publications linked in this article as of August 2, 2026. Figures are not silently merged across sources. When a source revises a historical baseline, both the original and restated value are retained where relevant.
Corrections will be dated and described in this section so readers can distinguish the originally published figure from later revisions.
The data shows that code weaknesses remain frequent while the largest losses increasingly involve wallets, keys, signing infrastructure, people, and operational access. Web3 security programs should test both surfaces.
DeepStrike provides application and infrastructure penetration testing for organizations that need to assess the systems surrounding their on-chain assets. Explore DeepStrike's penetration testing services. Virtual asset firms licensed in Dubai should also review VARA penetration testing for the testing evidence the regulator expects.
Abdalla is an offensive security engineer at DeepStrike, where he runs penetration tests across web applications, cloud infrastructure, and internal networks. He breaks into systems so defenders can fix them first and writes about the attack paths he sees most often in real engagements.

Stay secure with DeepStrike penetration testing services. Reach out for a quote or customized technical proposal today
Contact Us
