August 2, 2026
Updated: August 2, 2026
Losses, protocol-logic risk, bridge trends, custodial exposure, and H1 2026 attack data.
Abdalla Mohamed

Data note. This article keeps DeFi protocol statistics separate from all-crypto and centralized-service statistics. Source methodologies are not interchangeable, and gross theft is not the same as permanent loss. Every external figure is linked on the relevant word or source name.
DeFi protocol security has improved sharply, but not because code-level risk disappeared. Immunefi's protocol-only dataset shows losses falling about 74% from the 2022 peak to 2025, while 89% of 2025 DeFi protocol losses came from application-specific protocol-logic exploits. Generic bridge and ecosystem-class attack patterns declined; the remaining onchain risk became more specialized. Across the wider crypto industry, however, catastrophic losses increasingly concentrated in exchanges, custody, key management, and signing infrastructure.
| Metric | Figure |
|---|---|
| DeFi protocol losses in 2022 | $2.62B |
| DeFi protocol losses in 2025 | $680M |
| Decline from the 2022 peak | 74% |
| Median loss in 2025, down from $6M | $1.5M |
| Bridge share of DeFi losses | 73% → 3% |
| 2025 DeFi losses from protocol-logic exploits | 89% |
Scope Map: Which Dataset Each Number Comes From
| Scope | Statistic | Figure | Source |
|---|---|---|---|
| DeFi protocol | 2022 loss peak | $2.62 billion | Immunefi |
| DeFi protocol | 2025 losses | $680 million | Immunefi |
| DeFi protocol | Median loss per incident | $6M in 2022 → $1.5M in 2025 | Immunefi |
| DeFi protocol | Bridge share of losses | 73% in 2022 → 3% in 2025 | Immunefi |
| DeFi protocol | Protocol-logic share, 2025 | 89% | Immunefi |
| All crypto | Private-key compromise share, 2024 | 43.8% of stolen value | Chainalysis |
| All crypto hacks | Smart-contract exploits, H1 2026 | 125 of 207 incidents | TRM Labs |
| All crypto hacks | Infrastructure impact, H1 2026 | 15% of incidents; 76% of losses | TRM Labs |
Sources: Immunefi DeFi loss dataset, Chainalysis stolen-funds analysis, and TRM Labs H1 2026 hack data.
Headlines saying that DeFi hacks are exploding and reports showing that protocol losses are down can both be accurate because they measure different things. Immunefi's multi-year series tracks exploit-driven DeFi protocol losses, which remained far below the 2022 peak in 2025. TRM Labs' H1 2026 dataset covers hacks and exploits across the broader crypto ecosystem and recorded a six-month high in incident count, driven mainly by frequent smart-contract exploits, while infrastructure and operational compromise produced 76% of losses.
The distinction is frequency versus financial impact, and DeFi protocol trends versus all-crypto incident data. This article keeps those scopes separate rather than combining bridges, exchanges, wallets, DeFi protocols, and industry-wide theft under one headline.
The following statistics are written so they can be quoted without losing the scope that makes them accurate.
Source for all DeFi protocol figures in this table: Immunefi.
| Quote-ready statistic | Scope |
|---|---|
| DeFi protocol losses fell approximately 74% from $2.62B in 2022 to $680M in 2025. | DeFi protocols |
| Median loss per DeFi incident fell 75%, from $6M to $1.5M. | DeFi protocols |
| Bridge incidents fell from 73% to 3% of DeFi protocol losses. | DeFi protocols |
| Ecosystem-class attacks fell from roughly 19% to under 1%. | DeFi protocols |
| Protocol-logic exploits caused 89% of DeFi protocol losses in 2025. | DeFi protocols |
| Private-key compromise fell to 8.1% inside DeFi protocols in 2025. | DeFi protocols |
| Private-key compromise represented 43.8% of all crypto value stolen in 2024. | All crypto |
| TRM counted 125 smart-contract exploits among 207 crypto hacks in H1 2026. | All crypto hacks |
| Infrastructure compromise caused 76% of H1 2026 crypto-hack losses while representing about 15% of incidents. | All crypto hacks |
According to Immunefi's six-year DeFi loss analysis, exploit-driven DeFi protocol losses peaked at $2.62 billion in 2022, fell to $534 million in 2024, and partially rebounded to $680 million in 2025. The 2025 increase was concentrated in a handful of severe incidents rather than a broad return to 2022 conditions.
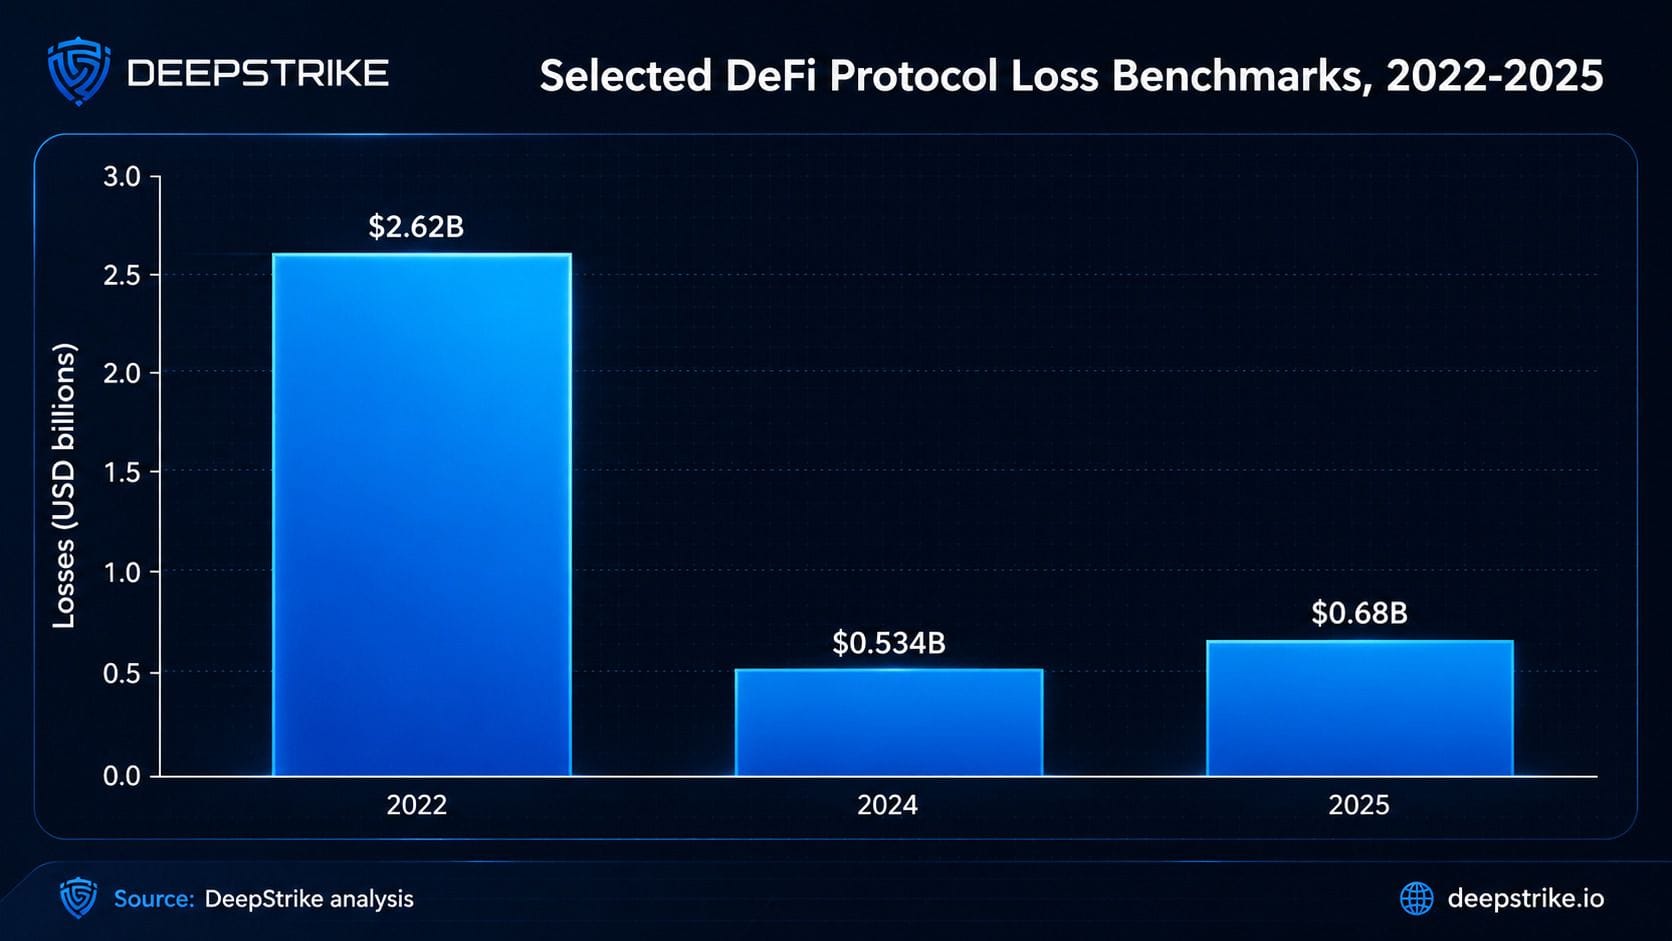
DeFi protocol losses by year, selected benchmark years from Immunefi
The 2022-to-2025 decline is approximately 74%. The source reports a larger 80% decline when the comparison ends in 2024, which was the low point in the selected period.
The median loss per incident fell from $6 million in 2022 to $1.5 million in 2025, a 75% decline. Median is the correct measure here: it describes the typical incident without allowing one or two mega-exploits to dominate the result.
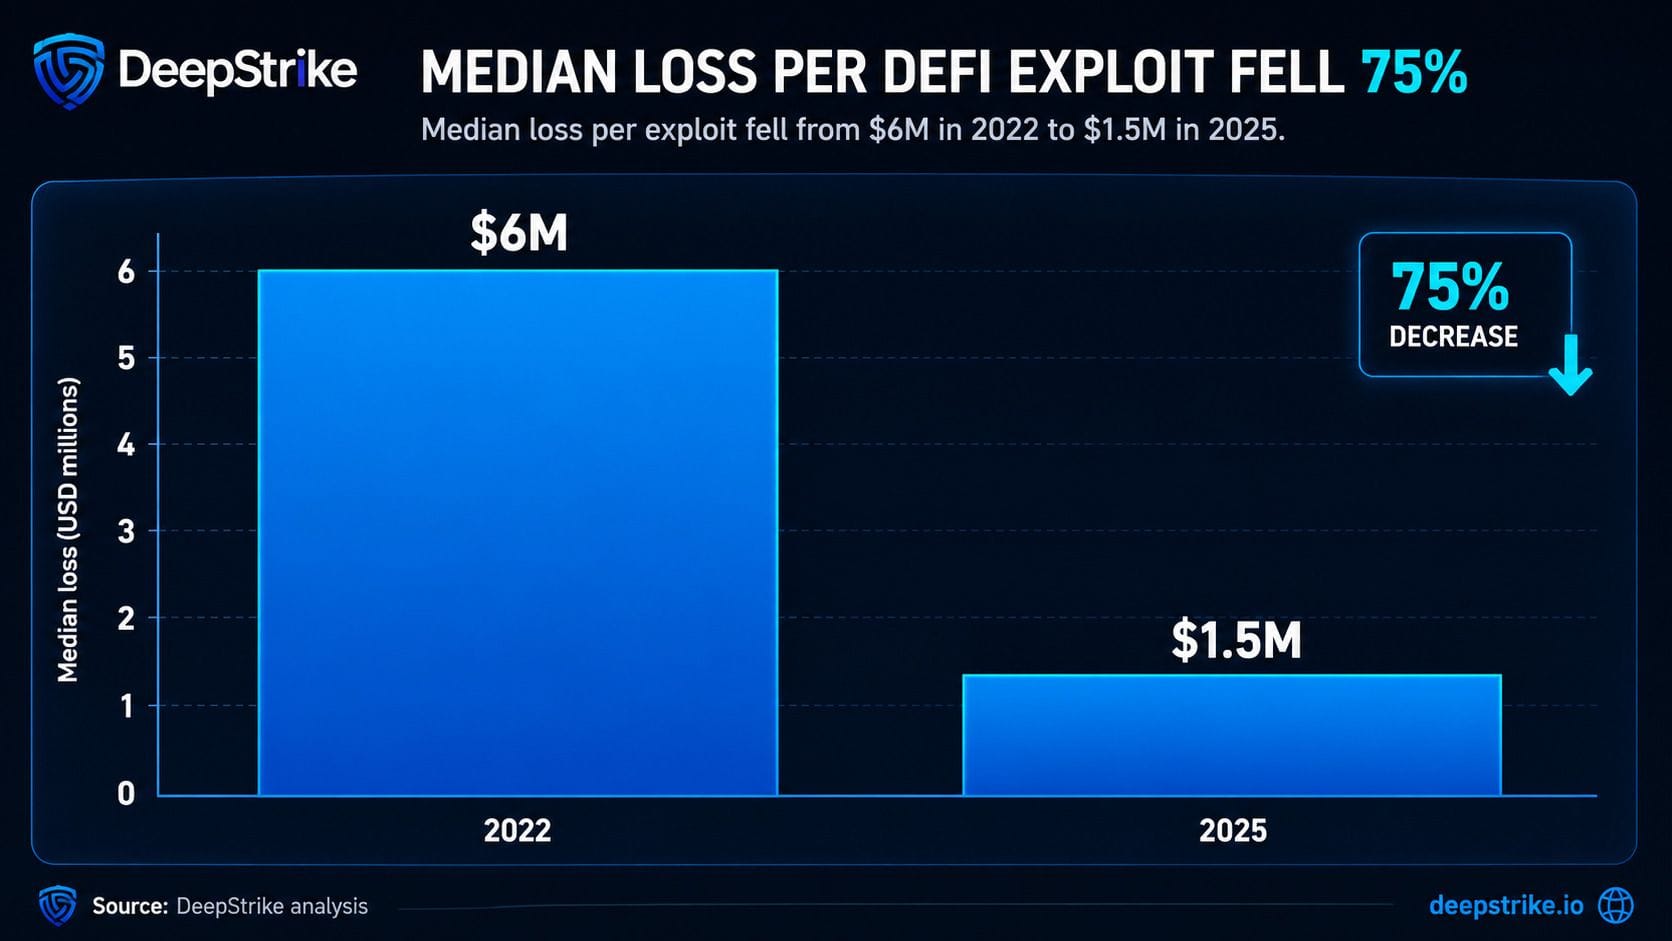
Median loss per DeFi incident, 2022 versus 2025, from Immunefi
The correct story is not that DeFi losses moved from contracts to keys. Inside DeFi protocols, infrastructure and private-key losses declined. What increasingly remains is application-specific protocol logic: unique flaws that cannot be fixed by one generic control.
| Category | Earlier share | 2025 share |
|---|---|---|
| Bridge incidents | 73% of losses in 2022 | 3% in 2025 |
| Ecosystem-class attacks | Approximately 19% in 2022 | Under 1% in 2025 |
| Flash-loan attacks | 54% in 2020 | Under 1% in 2025 |
These rows represent different analytical cuts. Bridge incidents describe an architecture or target class; ecosystem-class attacks describe repeatable composability patterns; flash-loan attacks describe a technique. They should not be added together as parts of one pie chart.
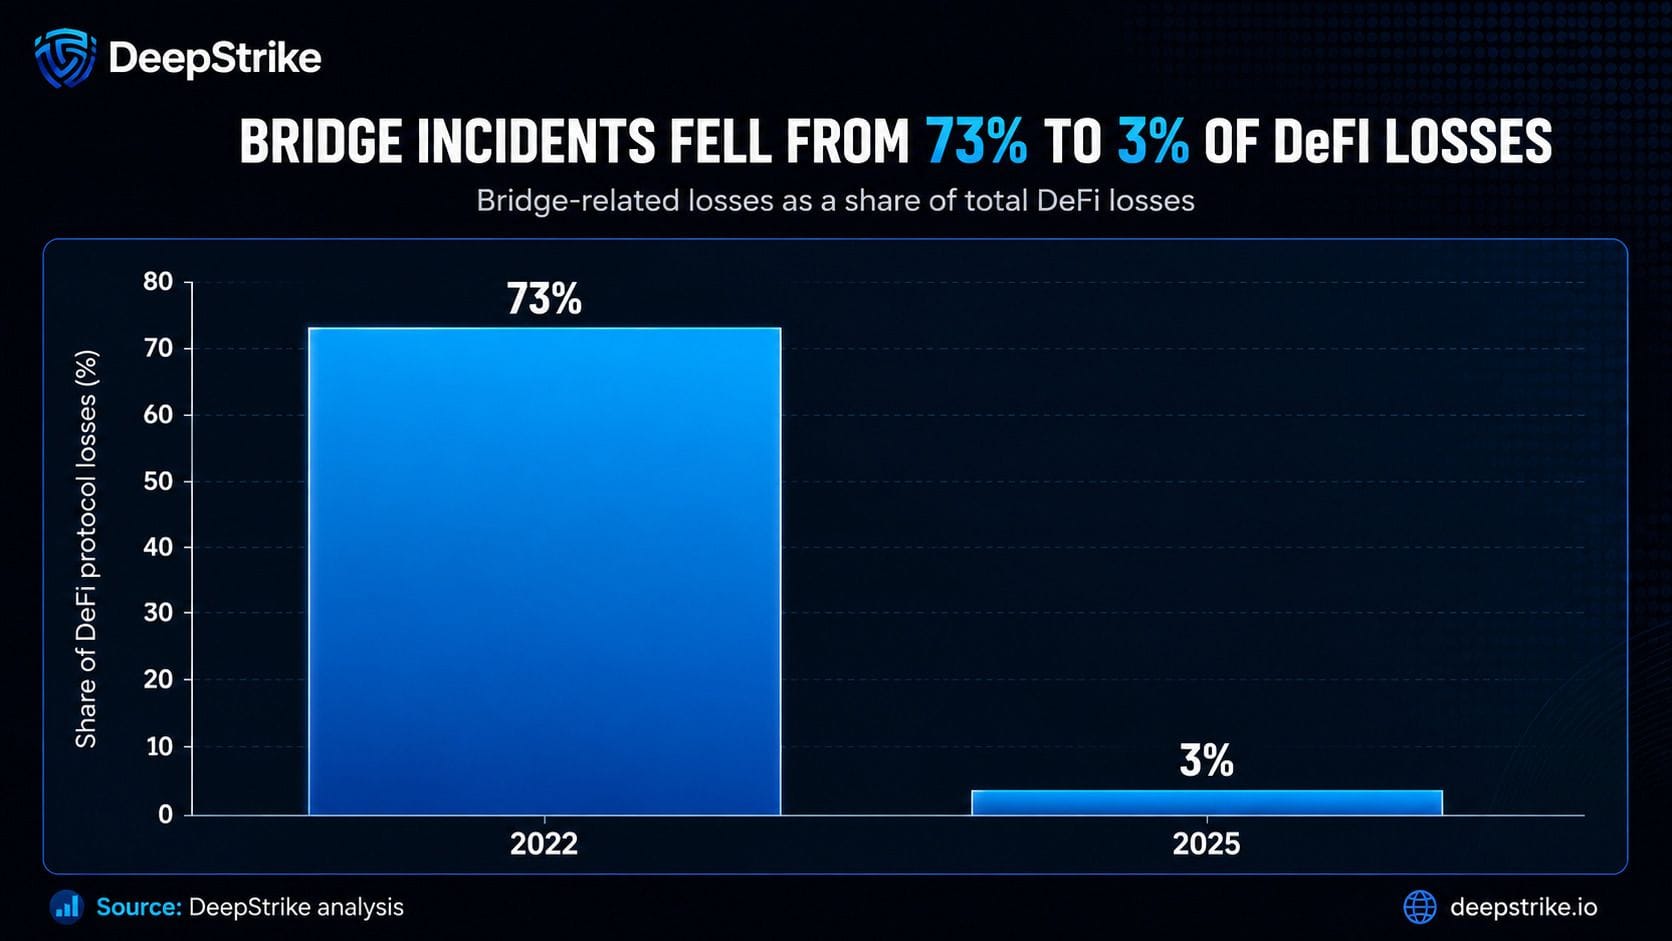
Bridge share of DeFi protocol losses, from Immunefi
| Failure layer | 2022 | 2025 |
|---|---|---|
| Infrastructure failures | 30.7% | 10.3% |
| Private-key compromise | 28.7% | 8.1% |
| Protocol-logic exploits | Not presented as the 2022 headline share | 89% |
Private-key compromise is a subset of the broader infrastructure-failure category, so those two rows must not be summed. In 2025, protocol-logic flaws dominated DeFi protocol losses.
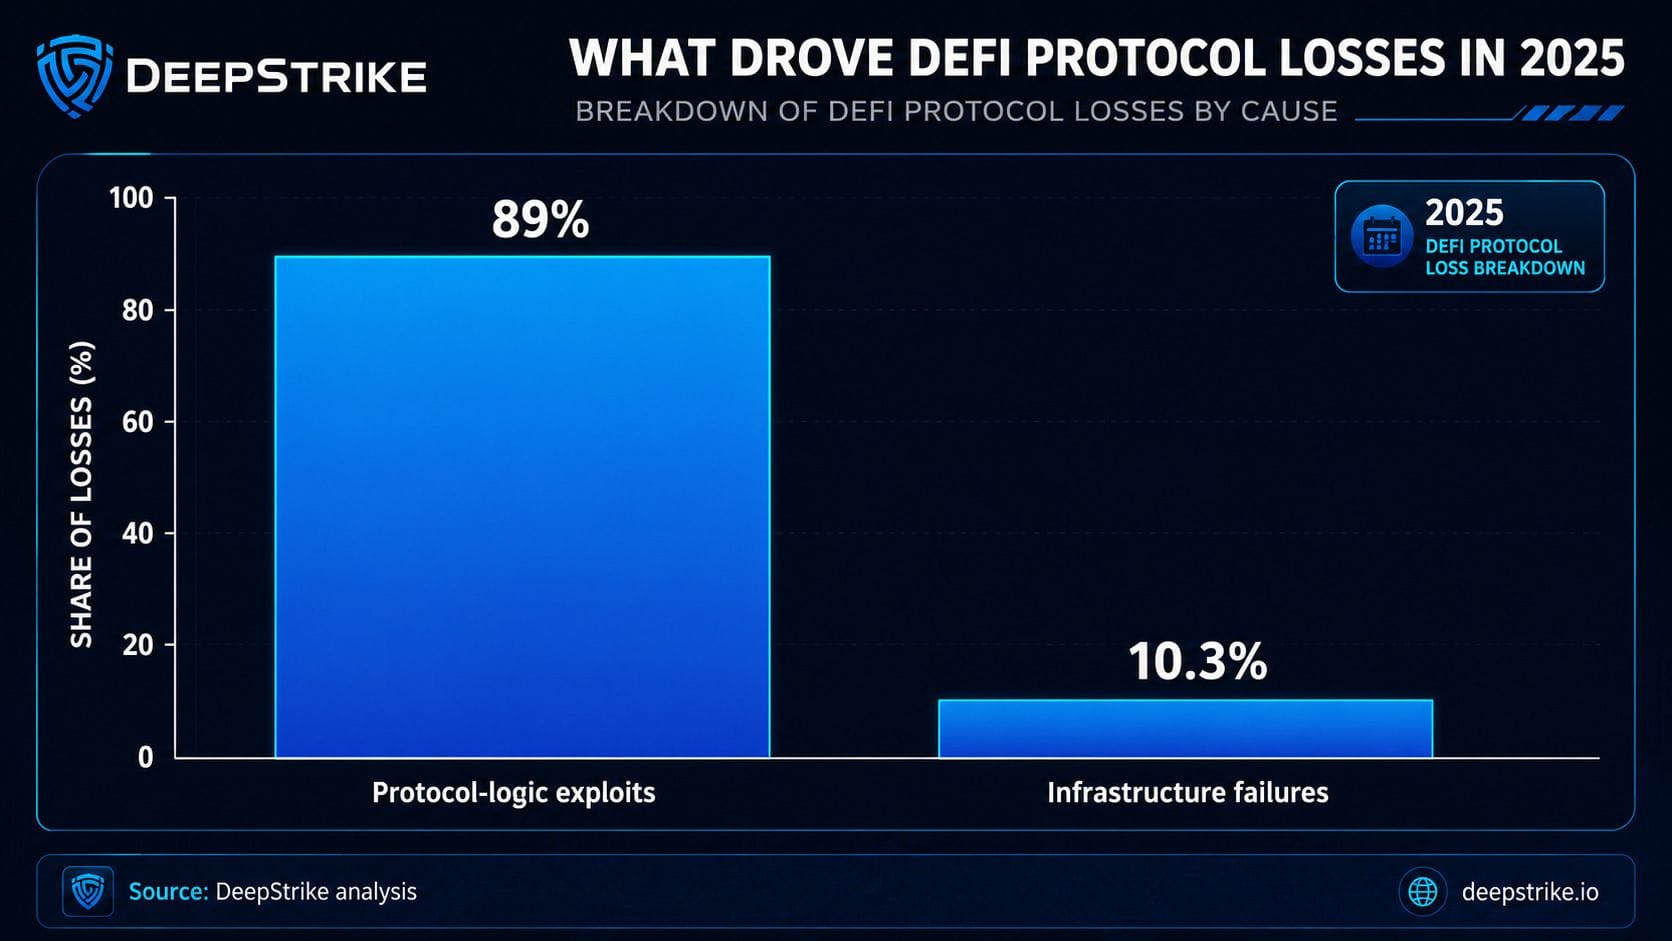
2025 DeFi protocol loss shares from Immunefi. Private-key compromise was 8.1%, within the infrastructure category.
Classic bridge incidents fell from 73% of DeFi protocol losses in 2022 to 3% in 2025. That is genuine progress, but cross-chain trust risk did not disappear. It moved toward messaging layers, verifier configurations, shared dependencies, and multi-chain deployments.
Immunefi uses the April 2026 KelpDAO incident to illustrate the new form: a LayerZero-powered bridge relied on a single verifier behind a high-value cross-chain path. The lesson is not that bridge security is solved, but that teams must now assess the trust assumptions underneath modern cross-chain messaging.
The historical record is dominated by bridges because pooled assets and shared validation made one failure capable of releasing hundreds of millions of dollars. Gross theft and permanent loss are different: several incidents below involved major returns, freezes, or balance-sheet replacement.
| Protocol | Date | Gross value | Failure mode | Outcome |
|---|---|---|---|---|
| Ronin Network | March 2022 | ~$624M | Validator-key compromise | Attributed to North Korea; partial seizure and recovery |
| Poly Network | August 2021 | ~$600M | Cross-chain contract flaw | Nearly all funds returned |
| BSC Token Hub | October 2022 | ~$570M | Bridge proof-validation flaw | Large share frozen or contained |
| Wormhole | February 2022 | ~$326M | Signature-validation flaw | Funds replaced by Jump Crypto |
| Euler Finance | March 2023 | ~$196M | Donation/flash-loan attack | Nearly all funds returned |
| Nomad Bridge | August 2022 | ~$190M | Initialization flaw | Partial recovery after mass exploitation |
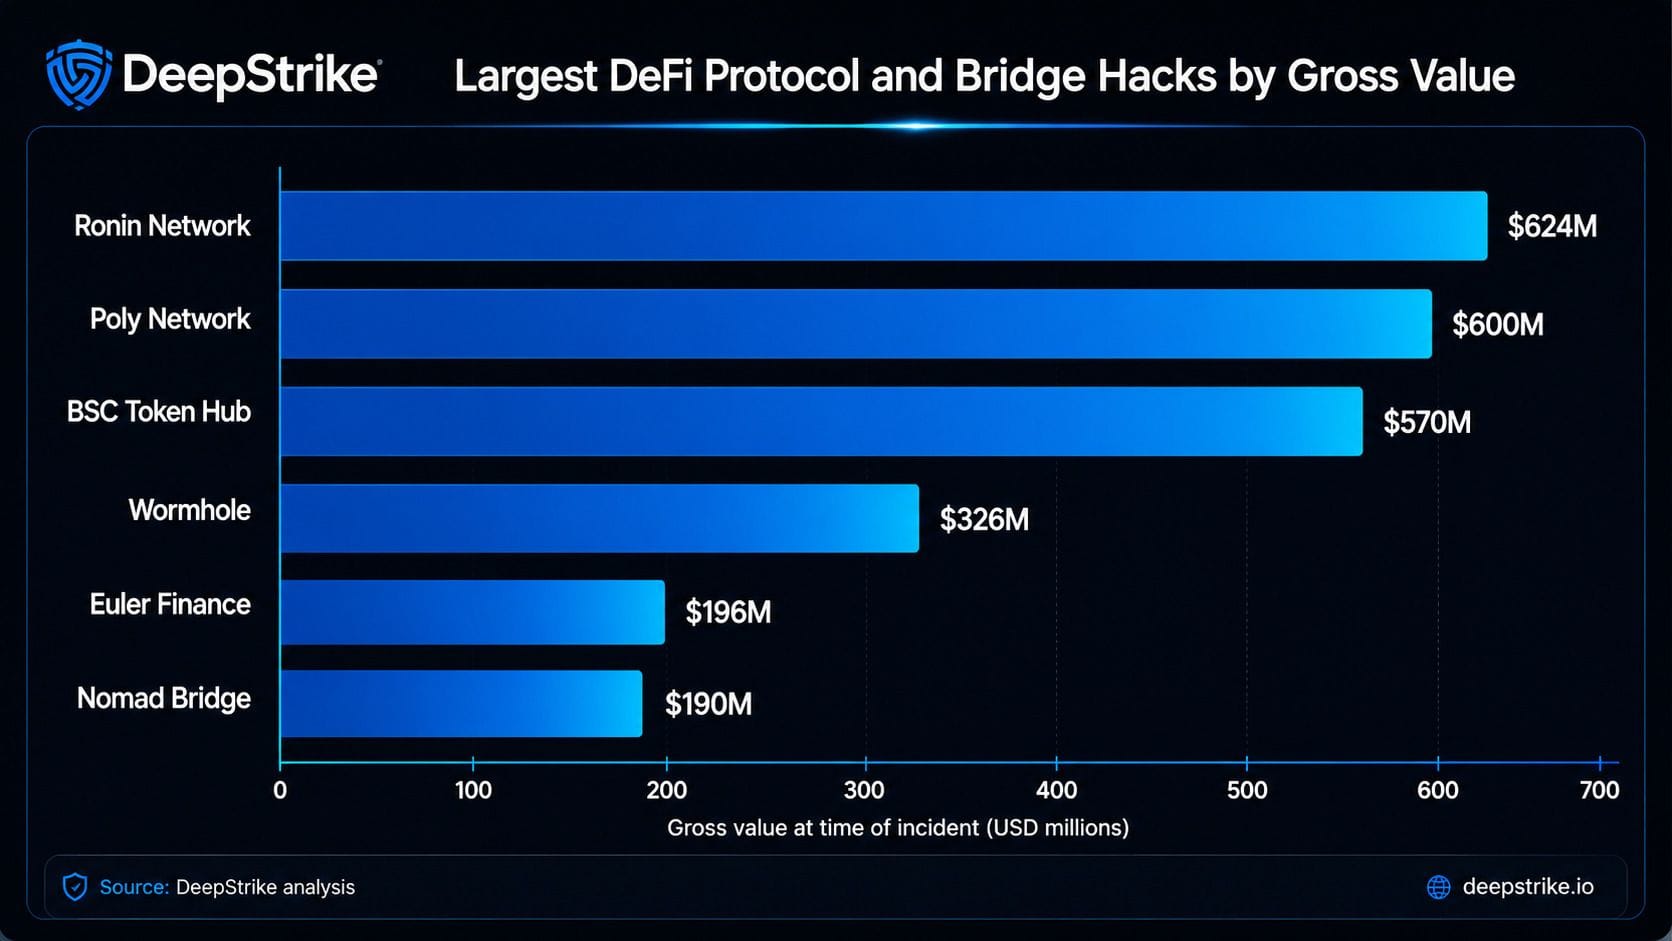
Largest DeFi protocol and bridge hacks by gross value
Gross values compiled from Halborn's Top 100 DeFi Hacks and incident reporting. Outcomes are summarized separately because recovered or replaced funds do not erase the security event.
The decrease in DeFi protocol losses should not be generalized into an industry-wide reduction in operational security risk. Immunefi separates exchange failures from protocol-level losses so that an exchange key-management failure is not mislabeled as a blockchain or DeFi protocol vulnerability.
Inside DeFi protocols, private-key compromise fell to 8.1% of losses in 2025. Across the broader crypto industry, Chainalysis reported that private-key compromise accounted for 43.8% of stolen value in 2024, while centralized services became the leading target in the second and third quarters.
Immunefi reported more than $1.6 billion in exchange infrastructure-class losses in 2025, led by Bybit, compared with $680 million in DeFi protocol losses. These figures describe different scopes, but the comparison shows where catastrophic value concentrated.
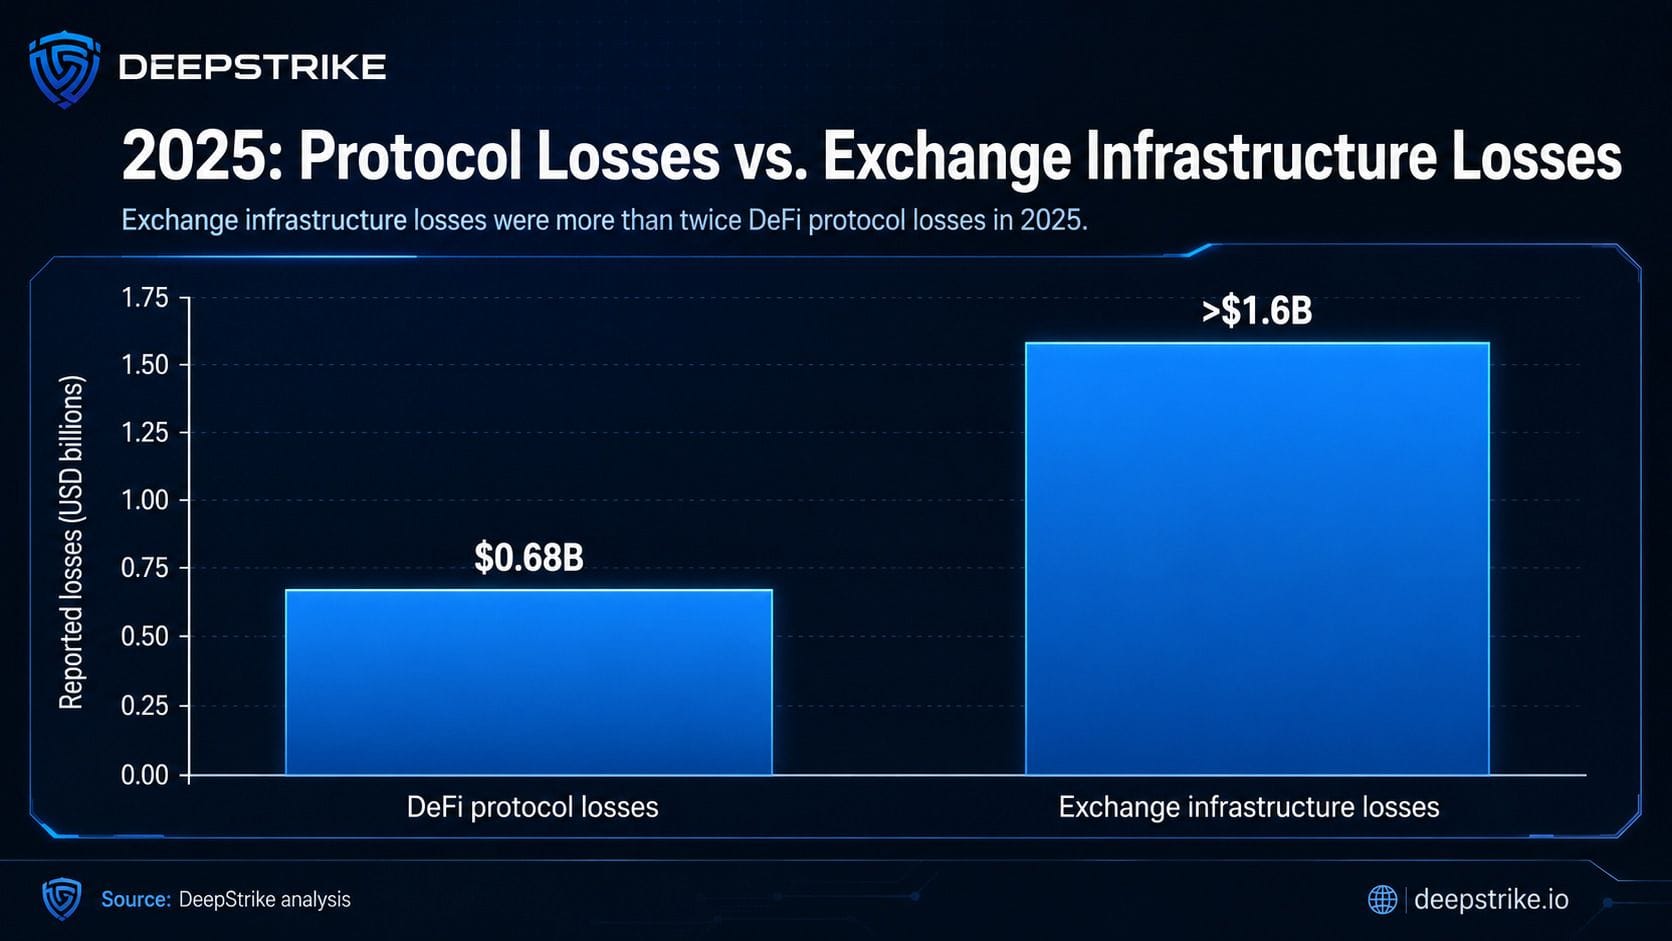
2025 DeFi protocol losses versus exchange infrastructure losses. The exchange figure is a lower bound.
The operational failures behind those exchange losses are not unique to crypto. Stolen credentials and compromised endpoints drive breach cost across every sector, a pattern visible in our remote work cybersecurity statistics. The asset differs; the access path rarely does.
Raw loss totals should be read against total value locked. Immunefi reports that DeFi TVL expanded while median incident severity and losses relative to secured value declined. The ratios are directional because TVL varies throughout the year and multi-chain incidents can be attributed across each affected ecosystem.
The conclusion is evidence of aggregate improvement, not proof that every protocol or ecosystem is safer. Individual loss-to-TVL ratios can still be distorted by one large incident.
The 2026 figures below come from an all-crypto hacks-and-exploits dataset, not a DeFi-only loss series. They are included because they show the split between incident frequency and catastrophic financial impact.
| H1 2026 metric | Figure | Scope |
|---|---|---|
| Total hacks and exploits | 207 incidents; $972M stolen | All crypto hacks |
| Smart-contract exploits | 125 of 207 incidents | All crypto hacks; many DeFi-related |
| Infrastructure and operational compromise | ~15% of incidents; ~76% of losses | All crypto hacks |
| North Korea-linked losses | $643M; ~66% of H1 total | All crypto hacks |
| Drift + KelpDAO | ~$577M combined | TRM attribution to North Korea-linked operations |
TRM Labs attributed approximately $577 million in combined losses from Drift Protocol and KelpDAO to North Korea-linked operations. TRM recorded $285 million for Drift and $292 million for KelpDAO.
The current-year pattern reinforces the need to defend both layers: smart-contract exploits drive incident volume, while a small number of infrastructure, signer, and operational compromises can dominate financial loss. Outside crypto the same operational failures surface as identity abuse, which our medical identity theft statistics track in a sector where stolen credentials cause lasting personal harm.
No single tracker measures every form of crypto loss. The dataset name and scope must travel with the number.
| Dataset | Includes | Excludes | Best used for |
|---|---|---|---|
| Immunefi DeFi protocol dataset | Exploit-driven DeFi protocol losses; ecosystem and TVL analysis | Centralized exchanges; most fraud and rug pulls | DeFi protocol security trends |
| Chainalysis stolen-funds data | DeFi, centralized services, wallets, and other crypto services | Broader illicit activity not classified as theft | Industry-wide theft and actor trends |
| TRM H1 2026 hack data | Hacks and exploits across crypto | Scams and broader illicit revenue | Current attack vector and actor trends |
| Halborn Top 100 | Large historical DeFi and Web3 incidents | Not a complete annual loss tracker | Largest-hack rankings and case studies |
Only the first four categories are specific to onchain systems. Credential and access-control failures are the common thread across industries, which is why the same root cause dominates our retail data breach statistics.
The decline is consistent with wider adoption of audits, bug bounties, hardened bridge designs, stronger oracle architecture, reentrancy protections, and standardized security patterns. However, the loss dataset does not isolate the causal contribution of each control.
Immunefi reported $107.3 million paid for confirmed critical vulnerabilities alone as of April 2026. It also found that 93.9% of programs active for at least five years had surfaced a confirmed, paid critical vulnerability.
The practical lesson is continuous assurance: an audit is a point-in-time review, while live protocols change, integrate with new dependencies, and accumulate new attack surface.
When explicitly scoped for smart-contract-adjacent infrastructure, signing systems, APIs, cloud environments, and privileged access, a penetration test can complement contract auditing by testing the systems around the code.
Immunefi reported approximately $680 million in exploit-driven DeFi protocol losses in 2025. That was a partial rebound from $534 million in 2024 but remained about 74% below the 2022 peak of $2.62 billion.
Total protocol losses and median incident severity remain substantially below the 2022 peak. However, incident counts can rise even when total loss falls, and a handful of large incidents can reverse an annual trend. The accurate conclusion is aggregate improvement with persistent tail risk.
No. The $1.5 million figure is the median loss per incident in 2025. Median describes the typical event and is less distorted by mega-exploits than an arithmetic average.
Protocol-logic exploits caused 89% of DeFi protocol losses. These are often application-specific flaws in an individual protocol rather than reusable attack templates.
No. Immunefi reported 54% for 2020. For a 2022-to-2025 comparison, ecosystem-class attacks, including flash-loan oracle manipulation and reentrancy, fell from roughly 19% to under 1%.
The Ronin Network bridge hack of March 2022, at approximately $624 million, remains the largest widely cited DeFi protocol or bridge exploit. Bybit was larger, but it was a centralized exchange custody and signing failure rather than a DeFi protocol exploit.
No. Classic bridge incidents fell sharply as a share of losses, but cross-chain trust shifted toward messaging layers, verifier configurations, shared RPC dependencies, and replicated multi-chain logic.
Because the datasets cover different layers. DeFi protocol security improved, while centralized exchanges, custody systems, private keys, and signing infrastructure absorbed a disproportionate share of catastrophic industry-wide losses.
Audits reduce risk and are consistent with the decline in repeatable attack patterns, but they do not guarantee security. Novel protocol logic, operational systems, keys, signing interfaces, governance, and post-audit changes require separate and continuous controls.
The data supports a two-layer security model: protect protocol logic against increasingly application-specific exploits, and protect the infrastructure, keys, signers, and cross-chain dependencies capable of producing catastrophic loss outside the contract.
DeepStrike assesses the surrounding application and infrastructure paths that code review alone does not cover. Explore penetration testing services, review the smart contract auditor roadmap, or compare the wider market in our crypto hacking incident statistics and crypto crime report.
Editorial scope note: DeFi-specific figures in this article refer to exploit-driven protocol losses unless another scope label is shown. All-crypto and centralized-service figures are included only for explicit comparison.
Abdalla is an offensive security engineer at DeepStrike, where he runs penetration tests across web applications, cloud infrastructure, and internal networks. He breaks into systems so defenders can fix them first and writes about the attack paths he sees most often in real engagements.

Stay secure with DeepStrike penetration testing services. Reach out for a quote or customized technical proposal today
Contact Us
