May 15, 2025
Updated: May 6, 2026
A data-driven analysis of ransomware activity (2025–2026) worldwide, highlighting incident trends, payment patterns, recovery costs, and strategic risk implications.
Mohammed Khalil
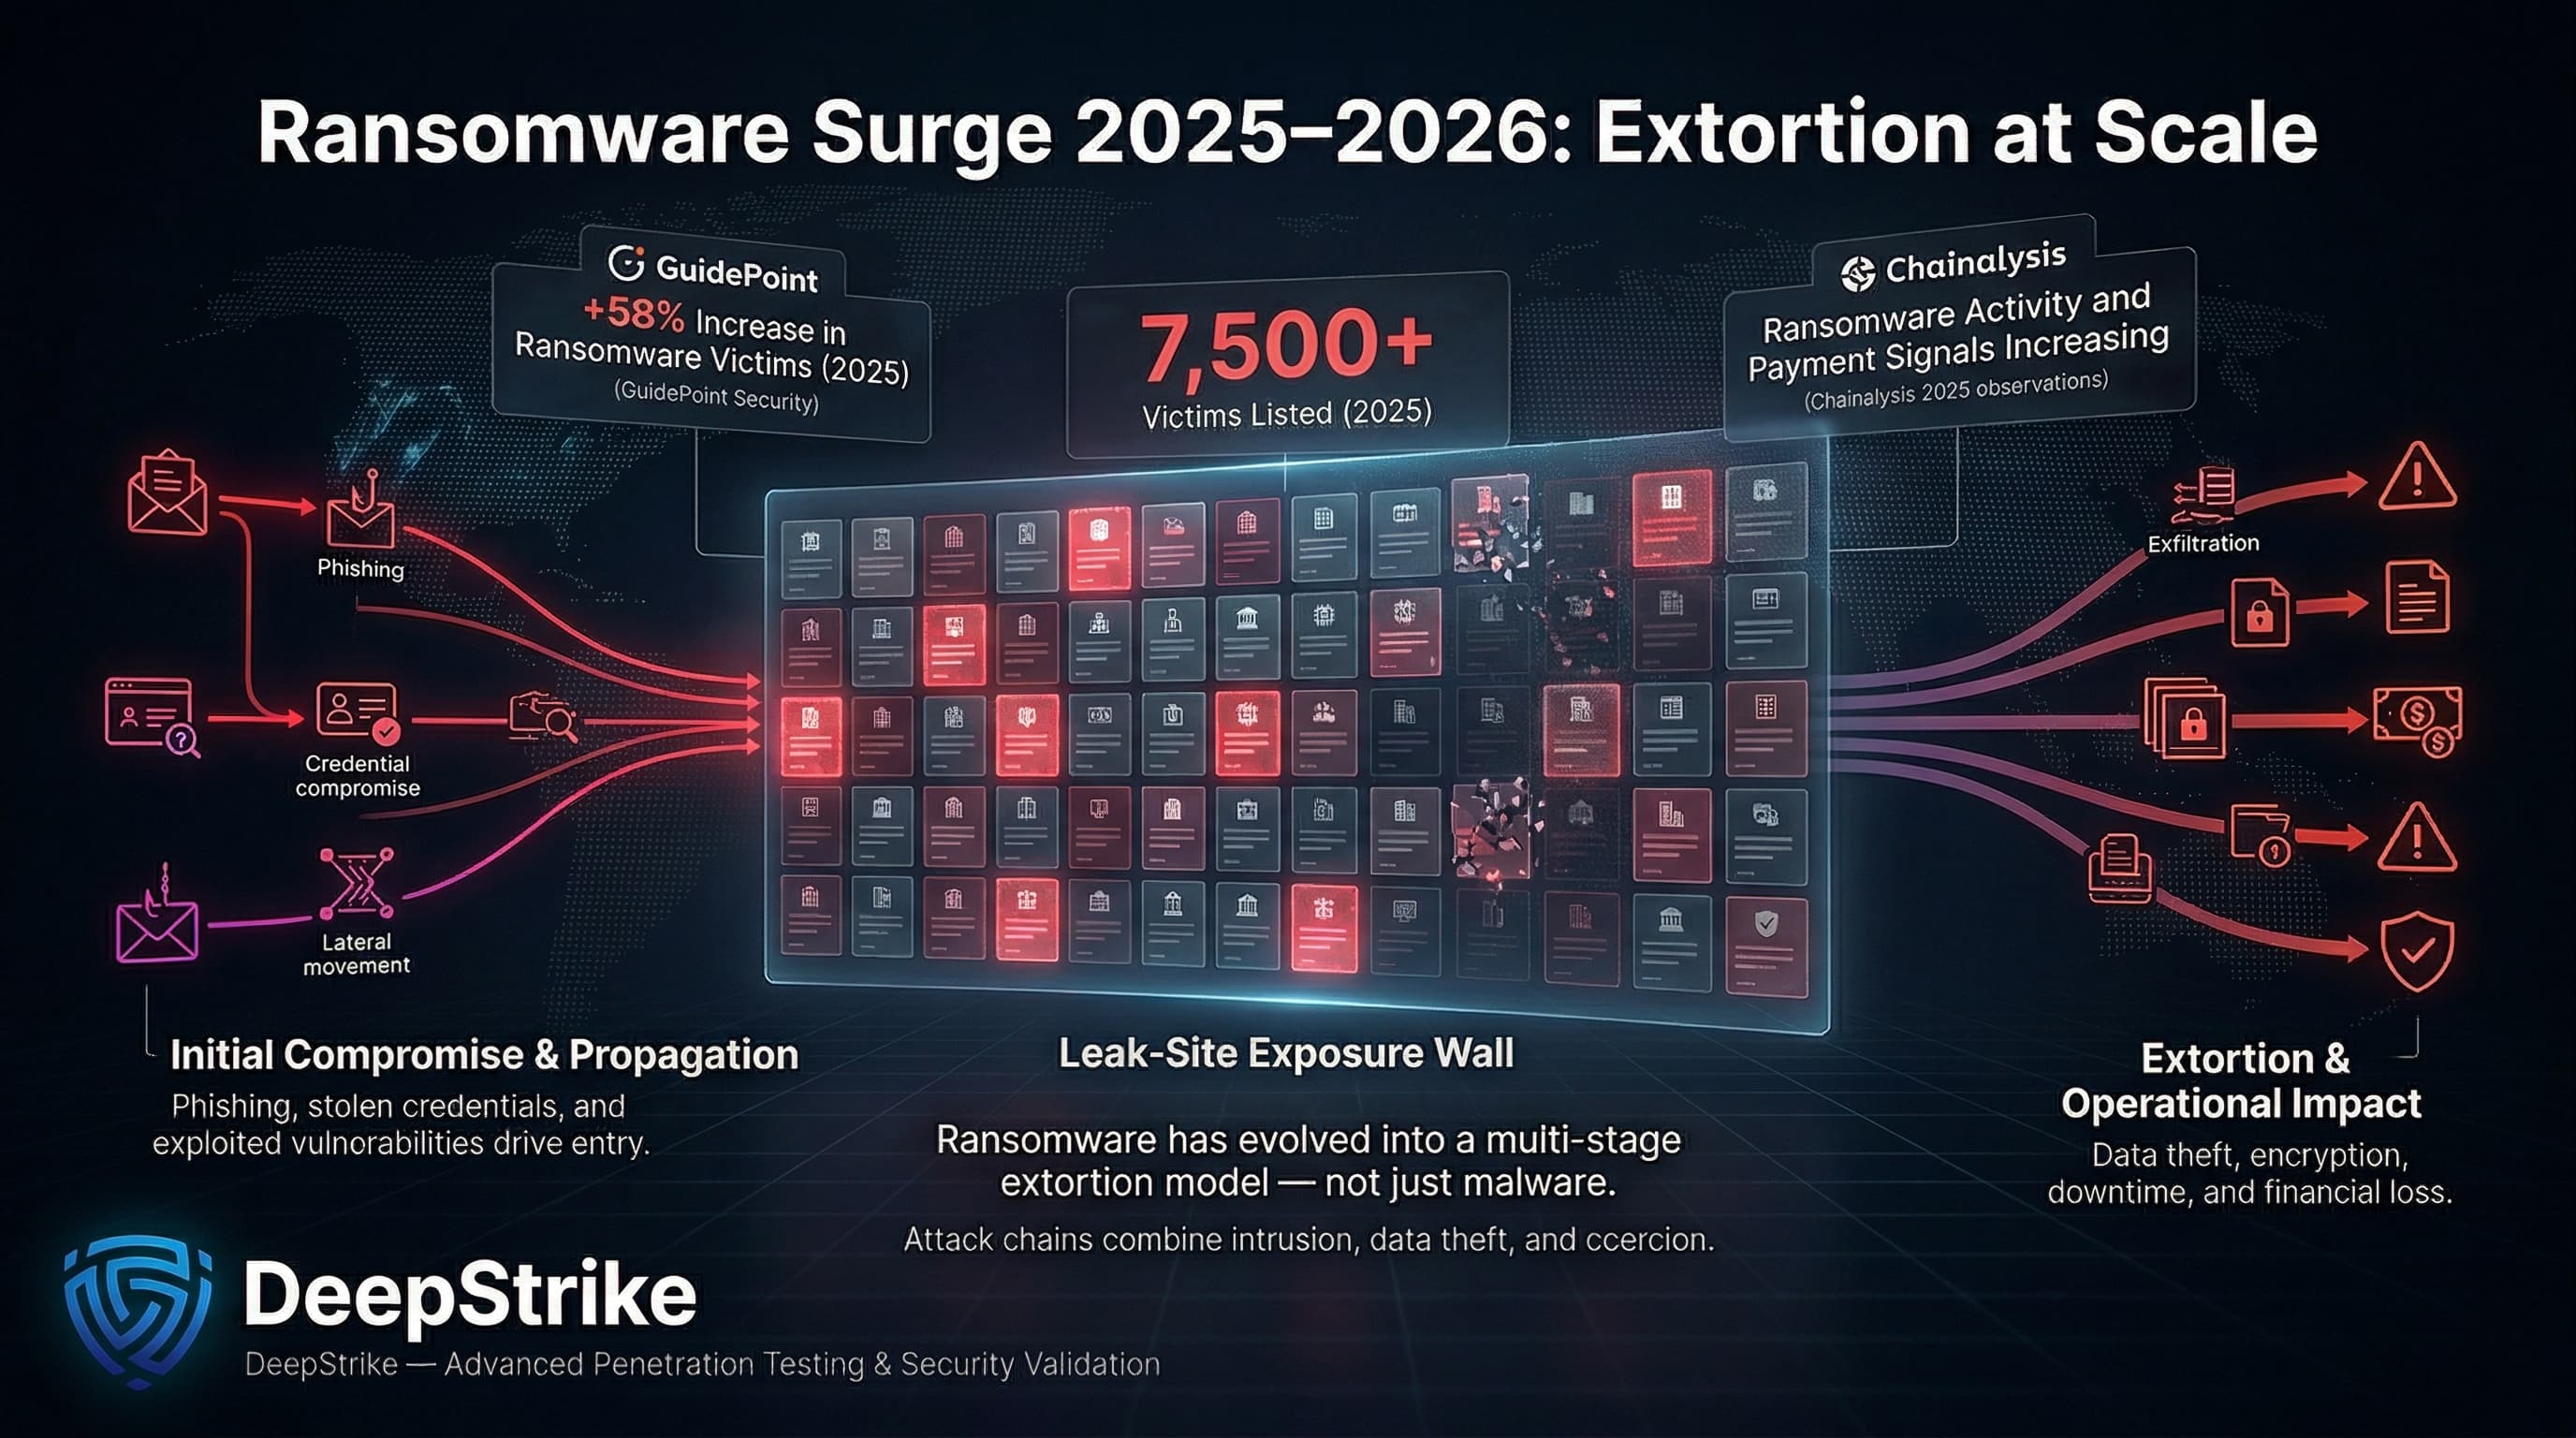
Ransomware statistics for 2025–2026 show a landscape of surging extortion campaigns with escalating impact. According to GuidePoint Security, claimed ransomware victims jumped ~58% in 2025, with over 7,500 organizations listed on leak sites. Chainalysis also reported continued growth in ransomware activity and payment-linked extortion indicators in 2025. These figures underscore why ransomware remains a material enterprise risk: it is not only a technical malware event but a multi-stage extortion scheme that disrupts operations, steals data, and imposes hefty financial losses.
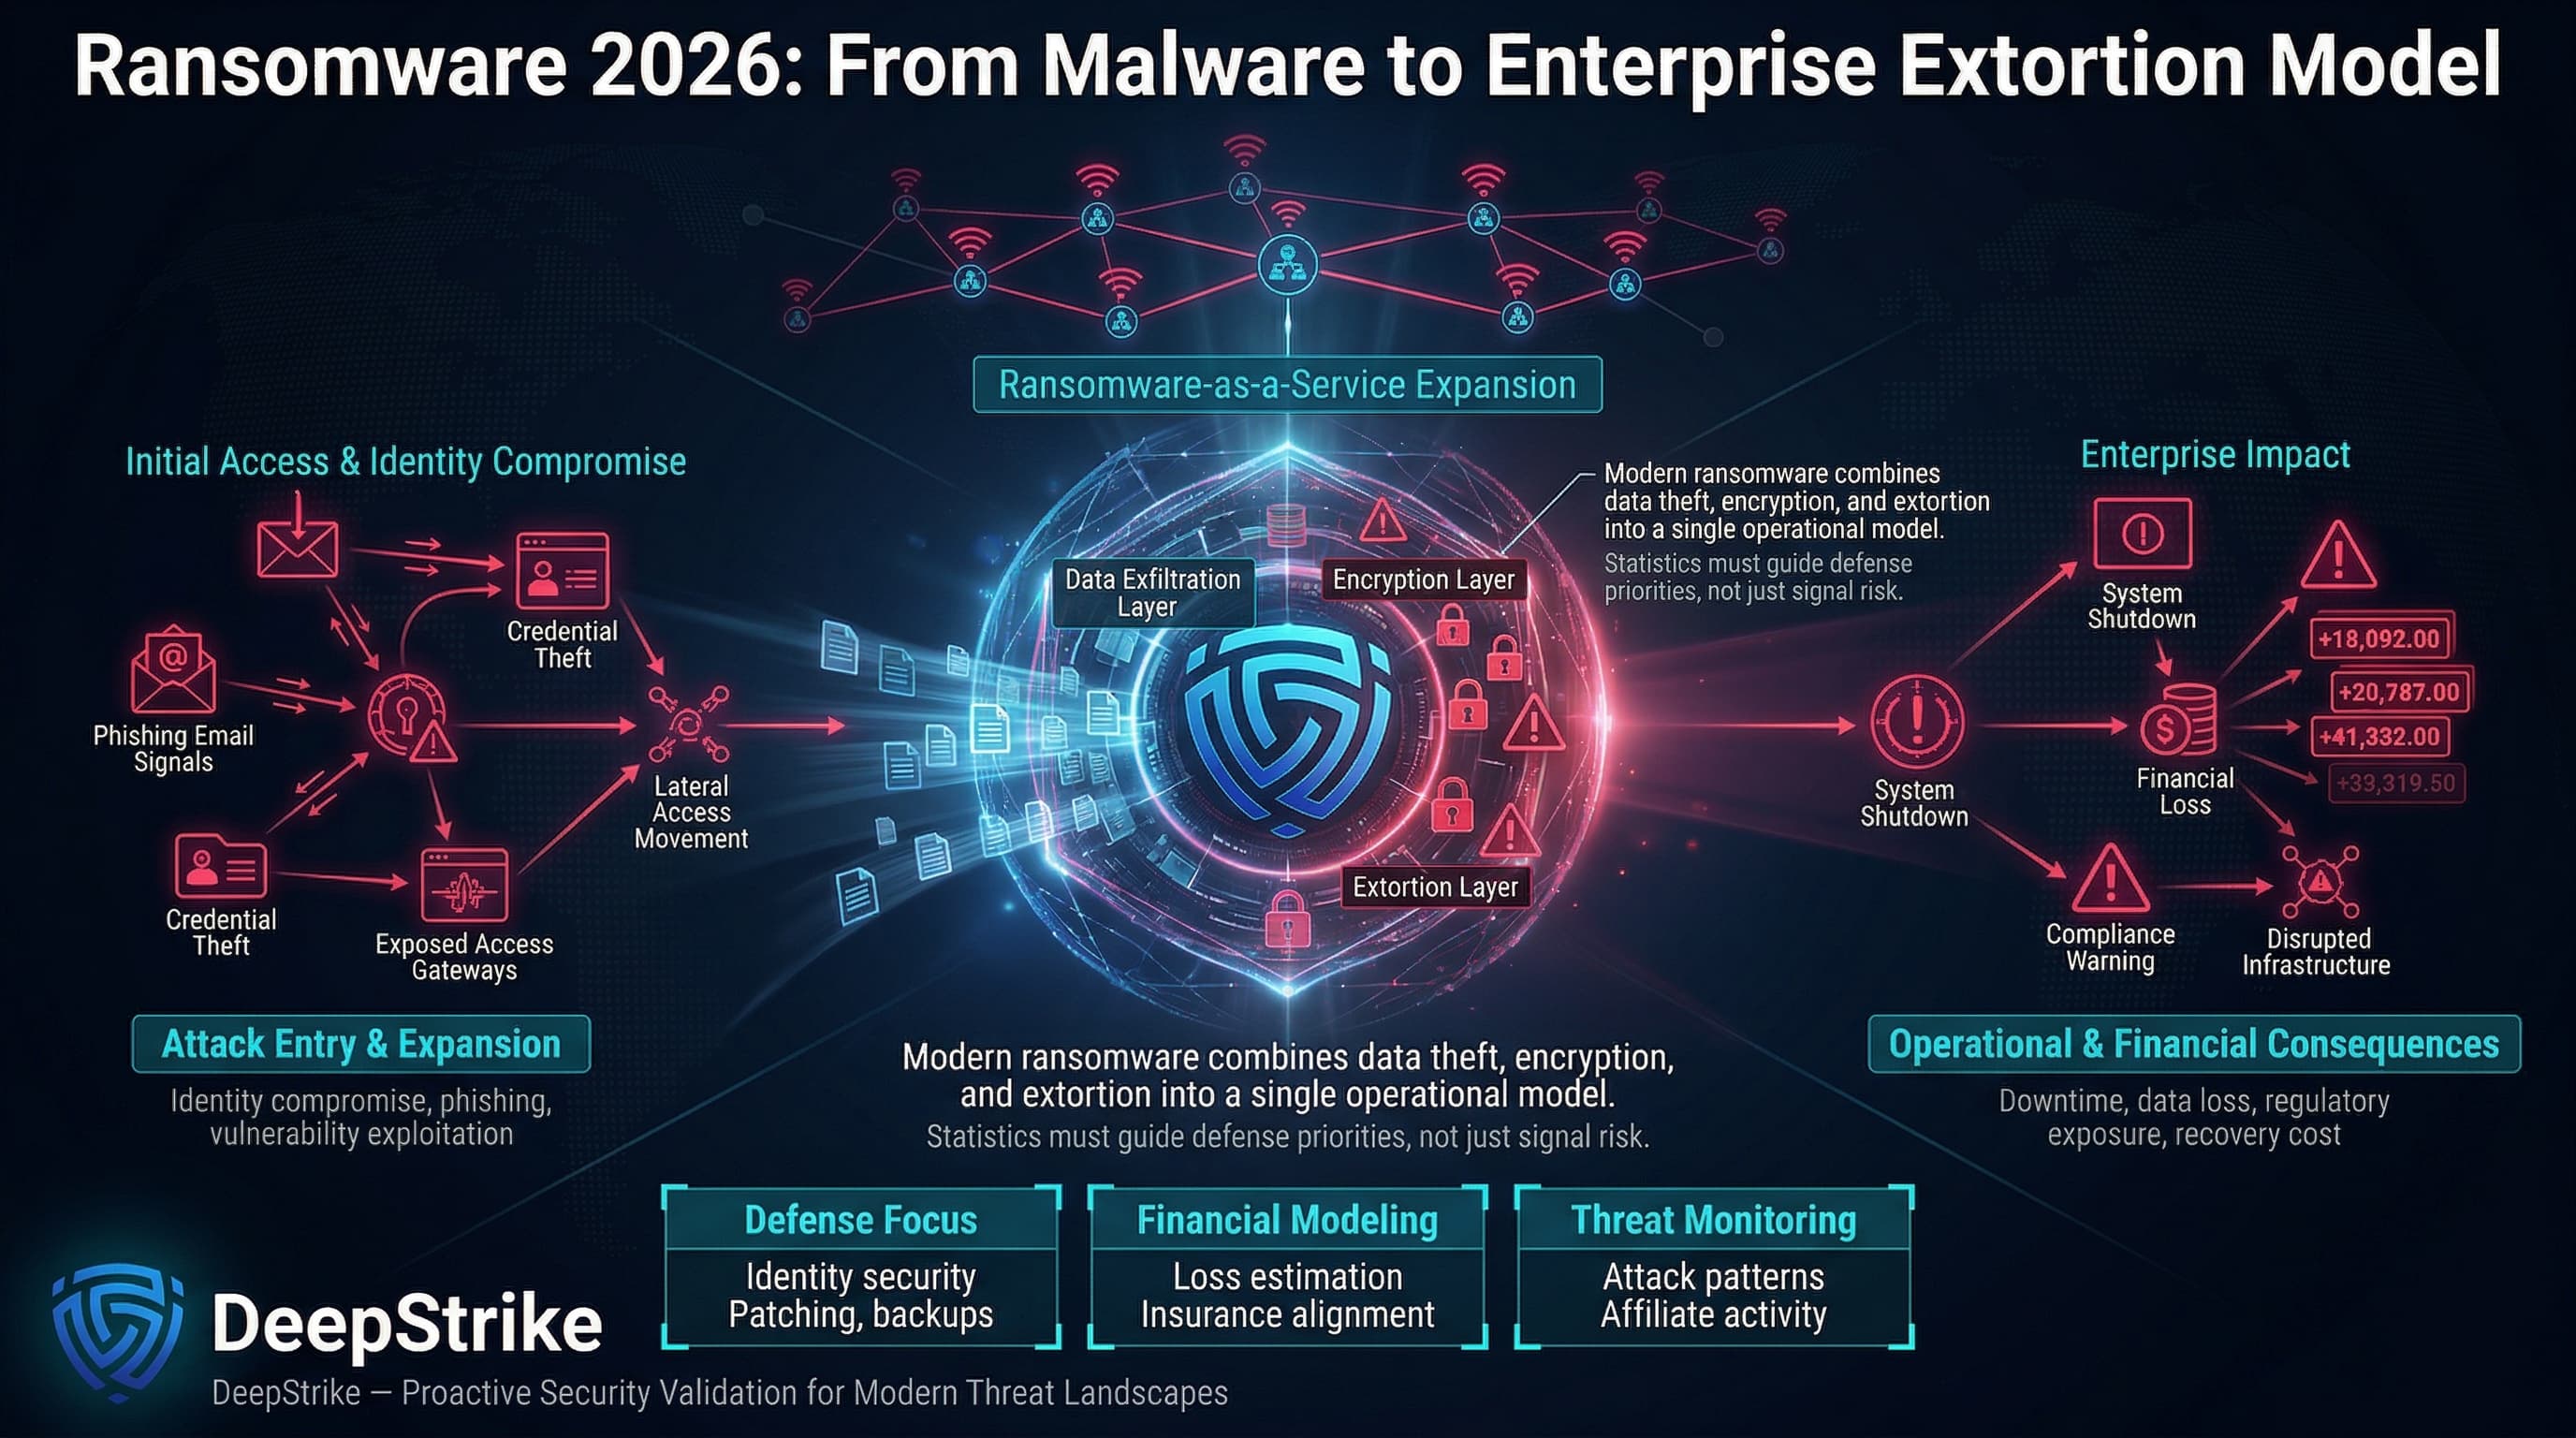
Enterprises face ransomware as an operational disruption (system encryption and downtime), a data exfiltration/extortion event, and a financial-loss driver. The typical attack chain starts with initial access via phishing or exploited credentials, followed by malware delivery or payload deployment. Attackers then escalate privileges and move laterally, eventually stealing sensitive data and launching encryption. They lock or exfiltrate files, then demand a ransom for the decryption key and/or data deletion. This process hits organizations on several fronts: credentials and systems are compromised; critical data and services are encrypted or threatened; management teams face extortion pressure; business processes halt (downtime and recovery); and recovery costs balloon through incident response, legal/regulatory fallout, and lost revenue. Ransomware statistics connect all these aspects: attack frequency, payment amounts, recovery expenses, downtime durations, and more. By translating these raw numbers into context, security architects and CISOs can make evidence-based decisions on identity controls (to block phishing and credential abuse), patch and exposure management (to close exploited vulnerabilities), network segmentation, backup strategies, and executive risk communication. In the sections below, we unpack what “ransomware statistics” actually measure, present global/regional data trends, analyze industry impact, and draw out the key operational and strategic implications for enterprise security.
Ransomware Statistics refer to quantified data about ransomware activity, including attack frequency, victim impact, payment behavior, recovery costs, downtime, initial access methods, industry targeting, regional variation, and broader trends in digital extortion operations.
Ransomware statistics capture various dimensions of extortion-based attacks: from how often attacks occur to their consequences. Key measures include the number of reported incidents or victims (e.g. organizations named on leak sites), the prevalence of victimization across enterprises (often from surveys), ransom demands and payments (total and average amounts), recovery costs (expenses for restoring systems), and downtime impact (days or weeks offline). They also cover data theft metrics (percentage of attacks involving exfiltration), initial access vectors (percent of attacks entering via phishing, stolen credentials, vulnerabilities, etc.), and industry/regional distribution.
Crucially, not all metrics are directly comparable. For instance, a report might count “incidents” from publicly disclosed breaches, while another tracks “victims” from extortion sites. A payment statistic may come from blockchain tracing (on-chain analysis) versus victim surveys. Recovery costs often come from structured incident-response analyses or IT audits.
Consider an illustrative example: A mid-size company is attacked. The adversary demands a $1 million ransom for a decryption key. The company negotiates and ultimately pays $600,000. However, remediation (IT forensics, downtime, IT labor, lost revenue) costs the company $2.5 million overall. In raw statistics: ransom demand = $1M; ransom paid = $600K; incident cost = $2.5M. If only one new attack was reported, some sources might list the incident once, with those figures, while a survey might classify this respondent as “hit by ransomware” and report the payment percentage and average cost.
In practice, data comes from multiple sources: public leak sites yield counts of exposed victims (e.g. 7,515 in 2025), blockchain tracing (Chainalysis) yields on-chain payment totals and medians, incident response reports (Sophos, Coveware) yield medians/averages of demands and costs, and surveys capture subjective impact and sector breakdowns (Sophos healthcare survey, for example). These capture overlapping but distinct slices of the ransomware picture. Understanding the context of each (survey vs. disclosed incident vs. payment analysis) is key to correctly interpreting “ransomware statistics.”
| Metric | 2024 (Year-1) | 2025 (Latest) | Trend | Notes |
|---|---|---|---|---|
| Extortion-site victims | ~4,750 (est.) | 7,515 | +58% | 2025 total listed victims, up 58% year over year. |
| On-chain payments | $813M | $820M (tracked) | flat (+1%) | Chainalysis: $813.5M (2024) vs ~$820M (2025). |
| Victim payment rate | ~35–40% (Coveware)* | 28% | ↓ | Payment rate hit record low (28% in 2025). |
| Median ransom paid | $12.7K | $59.6K | +~5× | Median soared ~4.7× in 2025. |
| Active ransomware groups | ~85 (est.) | 124 | +46% | 124 distinct groups in 2025, a record high. |
*Note: Coveware data suggests ~37% victim payment in 2024 Q4 (declining to ~23% by Q3 2025).
Interpretation: Extortion-site victim counts and group counts spiked sharply in 2025, indicating more attackers (and affiliates) were active. However, total blockchain payments were roughly flat implying that more attacks yielded roughly the same aggregate revenue. The victim payment rate dropped to a new low (28%), meaning a smaller share of victims actually paid their ransoms. Coupled with a 5× jump in median payment size, this suggests a polarization: many new, possibly smaller victims might refuse to pay, while a few incidents involve very large payments.
These trends likely reflect several factors: greater pressure on companies not to pay (improved backups, policy prohibitions, insurance reluctance), law enforcement discouraging payments, and the fracturing of RaaS affiliates. Still, the overall impact is intensifying because lower payment rates do not eliminate business loss. Even when ransom payments fall, organizations may still absorb substantial recovery costs, prolonged downtime, customer remediation expenses, and regulatory exposure. The sharp rise in active group count (+46%) likely comes from the collapse of a few major RaaS brands in 2024, splintering into many smaller affiliates.
Ransomware costs extend far beyond the ransom itself. They include incident response, system restoration, legal/compliance fees, customer remediation, and especially operational downtime. A useful comparison is the total breach cost versus the ransom component. For example, IBM’s Cost of Data Breach 2023 report found the average ransomware breach cost around $5.0–$5.1 million (with law enforcement involvement). This dwarfs typical ransom demands or payments (often in the low six figures or less).
Costs and financial impacts:
Table Cost and Impact Indicators:
| Indicator | Value (Latest) | Change (YoY) | Notes |
|---|---|---|---|
| Avg. ransomware breach cost | ~$5.0M (IBM 2023) | +5%↑ (2022→2023) | IBM CoDB reports roughly ~$5.11M on average, with lower average cost when law enforcement is involved. |
| Median ransom paid | ~$60K (2025) | +375% (↑) | Median rose from $12.7K (2024) to $59.6K (2025). |
| Downtime (typical range) | Days to weeks | – | Materially varies by sector, containment speed, and recovery maturity. |
| % attacks extorting data | 77% (2025) | +20pts | Data exfiltration in ~77% of cases (vs 57% in 2024). |
| Victims with law enforcement | 63% (2023) | – | 63% of victims involved police (IBM). |
In summary, enterprises should view ransomware as a major business continuity and financial risk. Even if the ransom payment is modest, the aggregate cost (downtime, recovery, reputational damage) can reach into the millions per event. Security teams must therefore factor not just technical containment, but crisis management and financial planning into their response strategies.
Traditional ransomware encrypts files and systems to halt business operations. This model remains critically important: encrypting systems causes immediate downtime, often halting manufacturing lines or disrupting critical services. Victims must either restore from backups or negotiate decryption keys. While some firms restore with backups, many still face prolonged outage costs or partial data loss. High-profile examples like the JBS meatpacker attack (2021, outside our range) or multiple hospital shutdowns illustrate this. In encryption-centric attacks, the key defender focus is preventing encryption and ensuring quick recovery.
Double extortion involves encrypting systems and stealing data to add pressure. This has become the dominant model in recent years. In 2025, Mandiant/Google Cloud found confirmed data theft in 77% of ransomware intrusions, up from 57% in 2024. In practice, attackers exfiltrate sensitive databases or intellectual property before locking systems. They then threaten to publish or sell the data if ransom is not paid. This shift dramatically raises stakes: organizations face not just disruption but also data breach/litigation risk. For example, adversaries often publish exfiltrated data on “leak sites” if payments fail, intensifying legal/regulatory consequences. Double extortion thus changes the calculus: it forces companies to account for both recovery of systems and managing a potential data breach.
An emerging model is pure data extortion, where attackers skip encryption entirely. They steal data and threaten public release without deploying any ransomware payload. This can happen when encrypting targets is impractical or when extortion is purely financial. Groups like CLOP have reportedly moved to such a model on their leak sites. Google Cloud’s analysis notes that some newly acquired data-leak sites primarily facilitate data-theft extortion without encryption. For victims, this means backups offer no protection; the loss is purely data and reputational. Enterprises must detect and prevent data exfiltration early, not just rely on backups. This category underscores that “ransomware” today is fundamentally an extortion business, not just a malware problem. The attacker’s chosen mechanism encryption or data-only coercion varies based on what creates the most leverage.
RaaS platforms have industrialized extortion. In a RaaS model, a core developer “brands” a ransomware, and affiliates purchase or lease it to carry out attacks. This specialization has two effects: (1) scale many affiliates can launch simultaneous campaigns, increasing overall incident count; and (2) specialization affiliates can focus on targeting and negotiation, while developers handle payload updates. Statistics reflect this model’s proliferation: Chainalysis notes the affiliate ecosystem generated ~$14M for initial access brokers in 2025 (hackers who sell network access to affiliates), a steady figure. Meanwhile, law enforcement takedowns of big RaaS groups (LockBit, ALPHV) in 2024 have caused the RaaS market to splinter. GuidePoint counted 124 active ransomware groups in 2025 (up 46%). Many are smaller or rebranded affiliates. For defenders, RaaS means constantly shifting threats new groups emerge quickly, each with their own TTPs. The focus must be on common controls (e.g., securing initial access and backups) rather than chasing a particular “brand.”
In summary, understanding these categories is vital: encryption-centric attacks necessitate robust backup and restoration processes; double-extortion mandates strong data security and incident response (even if backups work); data-only extortion requires data leakage prevention; and the RaaS model means scaling defenses (phishing, identity, patches) to address a growing adversary base.
| Vector / Method | Incidence/Share | Avg Impact/Cost | Notes |
|---|---|---|---|
| Phishing (email) | ~30–40% | Low attacker cost / High reach | Leading initial vector: ~35% of victims cite phishing. Often delivers loaders or credentials. |
| Stolen credentials | ~21% (2024 data) | High | Commonly exploited for lateral movement. Botnets/stealers fuel this vector. |
| Vulnerability exploit | ~21% (2024 data) | High | External-facing patches missed: 21% of cases (Mandiant). Critical vulnerabilities (e.g. VPNs, Exchange) are prime targets. |
| Brute-force / RDP | ~26% (2024 data) | Moderate | Open RDP/SSH: 26% of cases (Mandiant). Allows broad access if weak passwords. |
| Third-party / Supply chain | ~10% (2024 data) | High | Compromise through a partner or MSP (10%). High downstream impact when trusted supplier or partner access is abused. |
| Other (Insider, Misconfig, etc.) | Remainder | Varies | Includes insider collusion (emerging), cloud misconfig, credential stuffing, etc. For example, insider bribes have appeared. |
Ransomware campaigns typically chain multiple methods. An attacker might start with phishing to drop a malware loader (often relying on known vulnerabilities or stolen creds afterwards), or directly use exploited vulnerabilities (e.g. in a VPN) to gain access. Mandiant’s IR data confirms brute-force (RDP) as the #1 vector (26% of identified ransomware cases), highlighting the risk of exposed remote access. Phishing Statistics is also vital: one survey found 35% of ransomware victims trace their breach to phishing. Once inside, attackers abuse stolen credentials to spread laterally (21% share). They may also exploit third-party trust, using compromised suppliers, MSPs, or shared administrative relationships to extend access into downstream environments.
These vectors map to MITRE ATT&CK: Phishing (T1566), Valid Accounts (T1078), Exploit Public-Facing (T1190), Brute Force (T1110), Supply Chain Compromise (T1195). Defense implications: rigorous email filtering and phishing-resistant MFA, vulnerability patching, hardened configurations (disable unnecessary RDP), and strong third-party risk management are all critical. The table above summarizes typical share and impact. For example, even though any vulnerability could be exploited, high-impact exploits (e.g. permanent remote compromise) demand urgent patching, since they lead directly to larger-business impact.
| Industry | Relative Exposure | Typical Impact Pattern | Key Notes |
|---|---|---|---|
| Healthcare | High | Data encryption + stolen patient records; risk to life and compliance | Ransomware hit 67% of healthcare orgs in 2024 (Sophos). Recovery costs high ($2.57M on average). Backup compromises were frequent (66% succeeded). Strict regs (HIPAA/GDPR) and patient safety raise stakes. |
| Finance | Moderate | Data theft, service interruption, regulatory fines | Financial services see fewer incidents thanks to strong defenses, but breaches cost dearly. IBM reports finance firms now average ~$6.08M per breach. Downtime interrupts transactions, but robust controls (2FA, monitoring) help. High compliance scrutiny (GDPR, SOX) amplifies impact. |
| Technology/Software | Moderate | IP/data theft, supply-chain risk | Tech firms hold valuable IP and large networks. Attacks can leak source code or customer data. Cloud services can propagate impact widely. Some tech breaches provide infrastructure for further attacks (e.g. compromised cloud environments). Resilience often better, but breach can cause trust erosion in products. |
| Manufacturing & Industrial | High | OT downtime, loss of control systems | Manufacturing frequently appears among the most affected sectors in ransomware tracking because operational downtime, OT dependencies, and legacy environments raise attacker leverage. Unplanned shutdowns of production lines and OT disruptions cause enormous losses. Many plants run legacy systems with weak segmentation. The industry’s heavy reliance on continuous operations means even short downtime is costly. |
| Retail / Wholesale | High | Sales/operations disruption, customer data leaks | Retailers face outages in online ordering, fulfillment, and inventory operations, alongside customer-data exposure risks. Because revenue depends heavily on service continuity, even short-lived disruptions can translate into significant commercial damage. |
| Government / Public Sector | Moderate | Public-service downtime, citizen data exposure | Municipalities and agencies often have limited budgets and many legacy systems, making them attractive targets. Incidents (e.g. local government IT outages) disrupt citizen services. Regulatory compliance (FOIA, privacy regs) also adds complexity. National security aspects exist too (some groups quote ideological motives). |
Industries differ based on data sensitivity, tolerance for downtime, and regulatory environment. Healthcare organizations cannot afford outages due to patient care hence the high mean recovery cost and reliance on backups (73% of victims restored from backups). Manufacturing and critical infrastructure industries (energy, utilities, transportation) are attractive to extortionists because downtime is extremely costly, and they often run vulnerable OT systems. The financial sector invests heavily in security, which has kept incident volumes lower, but when breaches occur they tend to be sophisticated and costly. Retailers and tech firms suffer both operational and data loss impacts: e-commerce outages hit revenue directly, and consumer data theft can trigger massive breach notifications and lawsuits. Public sector targets (like city services, hospitals, schools) present extortionists with broad social leverage, even if the immediate ransom amounts are smaller.
Overall, organizations should assess ransomware exposure by industry profile: for critical-infrastructure sectors, focus on operational continuity and OT defenses; for data-centric sectors like healthcare and finance, emphasize data security and regulatory readiness; for retail/tech, prioritize customer data protection and supply-chain resilience. This sector-level understanding should shape security controls and board-level risk discussions.
| Region | Key Trend | Cost/Impact Signal | Notes |
|---|---|---|---|
| North America (USA/Canada) | Highest volume of attacks | >50% of global incidents | Large attack surfaces, high-value targets, and broad digital dependence keep North America at the center of reported ransomware activity and recovery costs. |
| Europe (incl. UK) | Significant targeting, regulatory action | 22% of incidents (Q3 2024) | UK, Germany, Italy heavily affected. GDPR fines and regulations shape breach costs. Public-sector and energy/transport sectors often singled out (e.g. ransomware advisories by ENISA). EU agencies and interconnectivity increase risk-sharing. |
| Asia-Pacific | Growing risk in expanding digital economies | Emerging ransomware markets | Largely underreported data. Rapid industrial growth (e.g. Taiwan/China manufacturing) increases risk. APAC saw some high-profile incidents (e.g. Singapore health systems). Rising cyber insurance uptake, but regional data gaps persist. |
| Latin America | Emerging ransomware hub | Notable surge (e.g. governments) | Several high-profile municipal and health-sector attacks. Often used as safe havens or targets by certain gangs. Cybercriminal infrastructure (bulletproof hosts) exists regionally. |
| Middle East & Africa | Targeting of critical infrastructure | Spotty data, but strategic attacks | Energy infrastructure attacks and e-commerce breaches reported. Some state-linked actors may engage in extortion. African organizations often under-resourced; relatively lower reported volumes but potential for growth. |
Regional interpretation: North America’s large share of activity is fueled by its large economy, ubiquitous internet connectivity, extensive IoT/OT networks, and the need for US penetration testing services that validate ransomware exposure across identity, cloud, and remote-access paths. This region also sees many big-league victims (e.g. multinational corporations). Europe’s ~20–25% share comes with stringent breach reporting laws (GDPR) and a focus on sanctions and law enforcement collaboration. APAC’s share is rising as digital adoption grows; however, many incidents in Asia-Pacific may go unreported or unmentioned in Western media. Latin America has become a notable battlefield, both as a target and sometimes as a base for cybercrime infrastructure. In all regions, the interplay of regulatory environment, cyber insurance prevalence, and law enforcement actions influences the visible statistics. For example, increasing mandatory disclosure rules can make incidents “spike” in stats even if actual attack rates stay level.
Based on recent data and expert reports, several trends are shaping the ransomware landscape:
In summary, ransomware operations are evolving: extortion is diversifying, defenses are raising barriers, and criminals are innovating around those barriers. For security strategy, this means vigilance on new fronts (insider threat programs, threat intelligence on new RaaS offerings, and cross-sector collaboration with law enforcement). Each trend above points to a different mitigation emphasis from stricter data monitoring (to catch exfiltration) to rigorous vendor audits (to cut off ransom supply chains).
| Attribute | Ransomware Operations | Malware Activity | Broader Intrusion Activity |
|---|---|---|---|
| Primary Objective | Financial extortion (encrypt/delete data for ransom) | Varies (espionage, data theft, credential theft, cyber-espionage) | Strategic goals (espionage, sabotage, reconnaissance, political aims) |
| Typical Entry / Use | Targeted delivery (phishing links, exploit kits) | Mass infection or targeted implant (e.g. trojan, worm) | Any (supply chain, zero-day, stolen creds) |
| Business Impact | Major downtime, data loss, potential compliance fines | Could be covert (data siphoning) or disruptive (rootkit) | Often stealthy (theft of IP or surveillance); can be major (APT sabotage) |
| Detection Pattern | Often discovered by external notification (attacker contacts victim ~50% of cases) | May go unnoticed for long (malware often stealthy) | Usually internal detection or external tip; can remain hidden for years |
| Recovery Complexity | Restoring systems & data (re-imaging, decryption) + negotiation | Malware removal (antivirus/EDR remediation, credential resets) | Complex investigation (attribution, clearing persistent implants) |
| Executive Relevance | High visible impact, financial demands on board agenda | Medium depends on data stolen (could be PR & compliance issue) | High may involve national security or long-term losses |
Explanation: Ransomware is one specialized form of broader intrusions, though often the outcome of a larger attack chain. Its primary objective is monetary extortion, contrasting with other malware that may aim for surveillance, fraud, or other exploitation. Entry methods overlap (phishing, exploits), but ransomware attacks culminate in visible lockouts and extortion demands, whereas other malware might silently spy or propagate. Importantly, ransomware incidents are typically reported by the attacker (victims get “hacked by us” messages), so they become overt crises. In contrast, a broader intrusion might be discovered belatedly by security tools.
From an impact perspective, ransomware demands immediate business attention: factories stand idle, customers complain, and executives must negotiate. Traditional malware (like a banking trojan) may only become news months later. Recovery from ransomware generally means wiping systems and rebuilding from backups (or dealing with encryption keys), whereas non-ransomware malware could require forensic cleanup and credential resets. Still, the two intersect: many ransomware cases begin as general intrusions (an attacker gains persistent access for espionage, then deploys ransomware as a final step). As such, good cyber hygiene (patching, least privilege) defends against both categories. Overall, ransomware is often the “loud end” of an intrusion, a clear-cut emergency but it should be viewed as part of the continuum of cyberattacks.
Translating numbers into strategy, ransomware statistics point to clear action items:
In essence, these statistics are not merely descriptive metrics; they quantify where attackers succeed and fail, and therefore which controls are likely to produce the greatest risk reduction.
Based on the trends above, organizations should adopt a multi-layered defense:
Each control contributes to reducing either the probability of an attack (e.g. blocking phishing, patching vulnerabilities) or the impact if one succeeds (e.g. backups, segmentation). The layered approach is key: an effective anti-ransomware program does not rely on a single solution but on overlapping defenses informed by these statistics.
A useful way to quantify ransomware risk is via expected loss: Probability of attack × Impact per attack = Expected annual loss. Ransomware statistics directly feed both components.
Illustrative example (purely hypothetical): Consider a mid-size healthcare organization that models a 60% annual ransomware probability based on sector exposure, then adjusts that estimate for its own control maturity, geography, and business profile. If the organization estimates a $5M average impact per material ransomware event, the expected annual loss would be about $3M before additional control adjustments. If planned investments reduce either the likelihood or the expected impact, the model gives leadership a concrete way to compare security spending against measurable loss reduction.
For boards and risk managers, such a model clarifies investment decisions: e.g., should we invest $X in an email security upgrade, which studies show could cut phishing success by Y%? Stats like “phishing caused 35% of incidents” directly inform the likelihood component. Similarly, “average recovery cost $5M” anchors the impact. Clear labeling (surveys vs actual costs vs estimates) ensures this remains a decision-making tool, not just a raw statistic.
“Ransomware statistics” are measurements of ransomware activity and its effects. This includes how many attacks occur, how often organizations are impacted, how much ransoms are demanded and paid, and how much downtime and cost results. They cover things like incident counts, payment rates, recovery costs, sectors hit, and trends in attacker tactics. In essence, they quantify the behavior and impact of ransomware campaigns over time and across industries.
Common and materially persistent across sectors, though exact prevalence depends on whether the source measures public victims, incident-response caseloads, or survey responses. Reported ransomware incidents have been rising; one analysis found ransomware victims grew ~58% in 2025. Another source noted claims of attacks rose ~50%. It’s estimated that a large portion of organizations (some surveys say over half in certain industries like healthcare) will experience at least one ransomware attack within a few years. However, not all attacks are disclosed, so true prevalence may be higher.
Costs vary, but they can be very high. On average, a ransomware breach (including downtime, remediation, fines, etc.) costs several million dollars. For example, IBM reported an average ransomware breach cost ~$5.1M. The ransom payment itself is often much smaller (median ~$60K), but indirect costs (lost revenue, legal, recovery) dominate. Large incidents can create losses far beyond the ransom through downtime, revenue interruption, legal exposure, customer remediation, and long-tail recovery work.
Increasingly, many refuse to pay full ransoms. In 2025, only about 28% of ransomware victims paid, a record low. When they do pay, it’s often less than the initial demand: for example, 53% of healthcare victims paid less than asked. Companies are investing in recovery and backing off ransom, partly due to better backup strategies and legal advice. Still, some do pay (Coveware and Chainalysis report payment rates). Payment decisions also depend on the cost of downtime vs the ransom size.
Critical sectors see heavy targeting. Manufacturing and other uptime-sensitive sectors frequently appear near the top of ransomware reporting because disruption creates strong extortion leverage. Healthcare and public health entities are also heavily hit (Sophos found 67% of healthcare orgs were attacked in 2024). Other high-impact sectors include finance (wealth of data), energy/utilities, and large retail. This is because these industries either have critical operations or valuable data. Industries with weaker security (education, local government) see proportionally higher breach rates too.
Common initial access vectors include phishing emails (malicious links/attachments), stolen or brute-forced credentials, and exploiting internet-facing software. Surveys indicate phishing is the leading cause (roughly 30–40% of breaches cite email phishing). Security reports show around 26% of ransomware cases came from brute-forcing services (like RDP) and about 21% from stolen passwords or exploited vulnerabilities. Attackers often chain these together (e.g. phishing to plant an infostealer that grabs credentials, then pivot via stolen creds).
Ransomware is a specific extortion use of malware: attackers encrypt or steal data and demand payment. Other malware (viruses, worms, trojans) may aim to steal information, create botnets, or just exploit systems quietly. The key difference is that ransomware is overt (the attacker reveals themselves and demands ransom), while typical malware might remain hidden to avoid detection. Ransomware often is the end-stage of an intrusion: an attacker’s goal is financial, whereas other malware might aim for espionage or disruption without immediate extortion.
Best practices include: implementing phishing-resistant MFA to stop stolen passwords; patching all critical systems promptly; segmenting networks and limiting admin access; deploying advanced email/malware filtering; maintaining secure, offline backups and testing restores; using EDR solutions to detect malicious behavior early; and conducting regular ransomware incident response drills. Essentially, reduce the chance of an intrusion and ensure rapid recovery if one occurs. These steps make ransomware attacks much less likely to succeed or cause serious damage.
Ransomware is not just a technical malware incident; it is a broader extortion and operational disruption model. The latest statistics for 2025–2026 show attackers are continuing to innovate: they are doubling down on data theft (often combining it with encryption or even using it alone), they have proliferated new affiliate networks, and payment behaviors are shifting. The net effect for enterprises is clear: the threat is multifaceted and costly. Organizations should use these statistics not as raw scare metrics, but as decision-making tools. They highlight where defenses must focus (e.g. identity security, patching, backups), how to quantify potential losses (for insurance and budgeting), and what patterns to watch in threat intelligence feeds.
Boards and leadership should understand that ransomware risk spans technology, finance, and governance; investment in resilience, detection, and response is warranted. In short, treat ransomware data as actionable intelligence: it quantifies where the adversary is focusing, which in turn tells defenders where to fortify, how to prioritize recovery planning, and what information to report to executives. In an era of rampant digital extortion, robust identity controls, patch management practices, backup strategy, and active defense are the strategic levers that turn these statistics into security.
Mohammed Khalil is a Cybersecurity Architect at DeepStrike, specializing in advanced penetration testing and offensive security operations. With certifications including CISSP, OSCP, and OSWE, he has led numerous red team engagements for Fortune 500 companies, focusing on cloud security, application vulnerabilities, and adversary emulation. His work involves dissecting complex attack chains and developing resilient defense strategies for clients in the finance, healthcare, and technology sectors.

Stay secure with DeepStrike penetration testing services. Reach out for a quote or customized technical proposal today
Contact Us