May 14, 2025
Updated: June 1, 2026
Key data on pentest adoption, vulnerabilities, remediation gaps, and the shift to continuous testing.
Mohammed Khalil

Penetration testing statistics represent hard data on how organizations are finding and fixing security gaps before breaches occur. In essence, these numbers tell the story of proactive security in action how often companies test their defenses, what types of vulnerabilities are most prevalent, how quickly issues get resolved, and the overall return on investment of ethical hacking exercises. With cyberattacks at all time highs, such metrics have shifted from obscure audit figures to board level KPIs.
Why do these stats matter now? Because 2024 2025 has seen a perfect storm in cybersecurity: a 38% jump in cyberattacks in early 2023, an explosion of new vulnerabilities disclosed, and threat actors weaponizing everything from cloud APIs to AI chatbots. Traditional defenses alone are failing to stem the tide 67% of U.S. enterprises reported experiencing a security breach in the past two years. In this climate, penetration testing simulated attacks by good hackers has evolved into a strategic necessity. It’s no longer just about compliance checkboxes, it’s about validating that your dozens of security tools actually work against real world threats.
A couple of headline findings set the stage. First, companies are investing heavily in pentesting: the global market is growing ~15% annually and more than 85% of organizations increased their pentest budgets this year. Second, despite this, security gaps remain over 48% of vulnerabilities found are never remediated and 60% of breaches stem from known unpatched flaws. The data tells a nuanced story of progress and pain points in offensive security, which we’ll unpack across global trends, vulnerability patterns, remediation outcomes, and industry specifics.
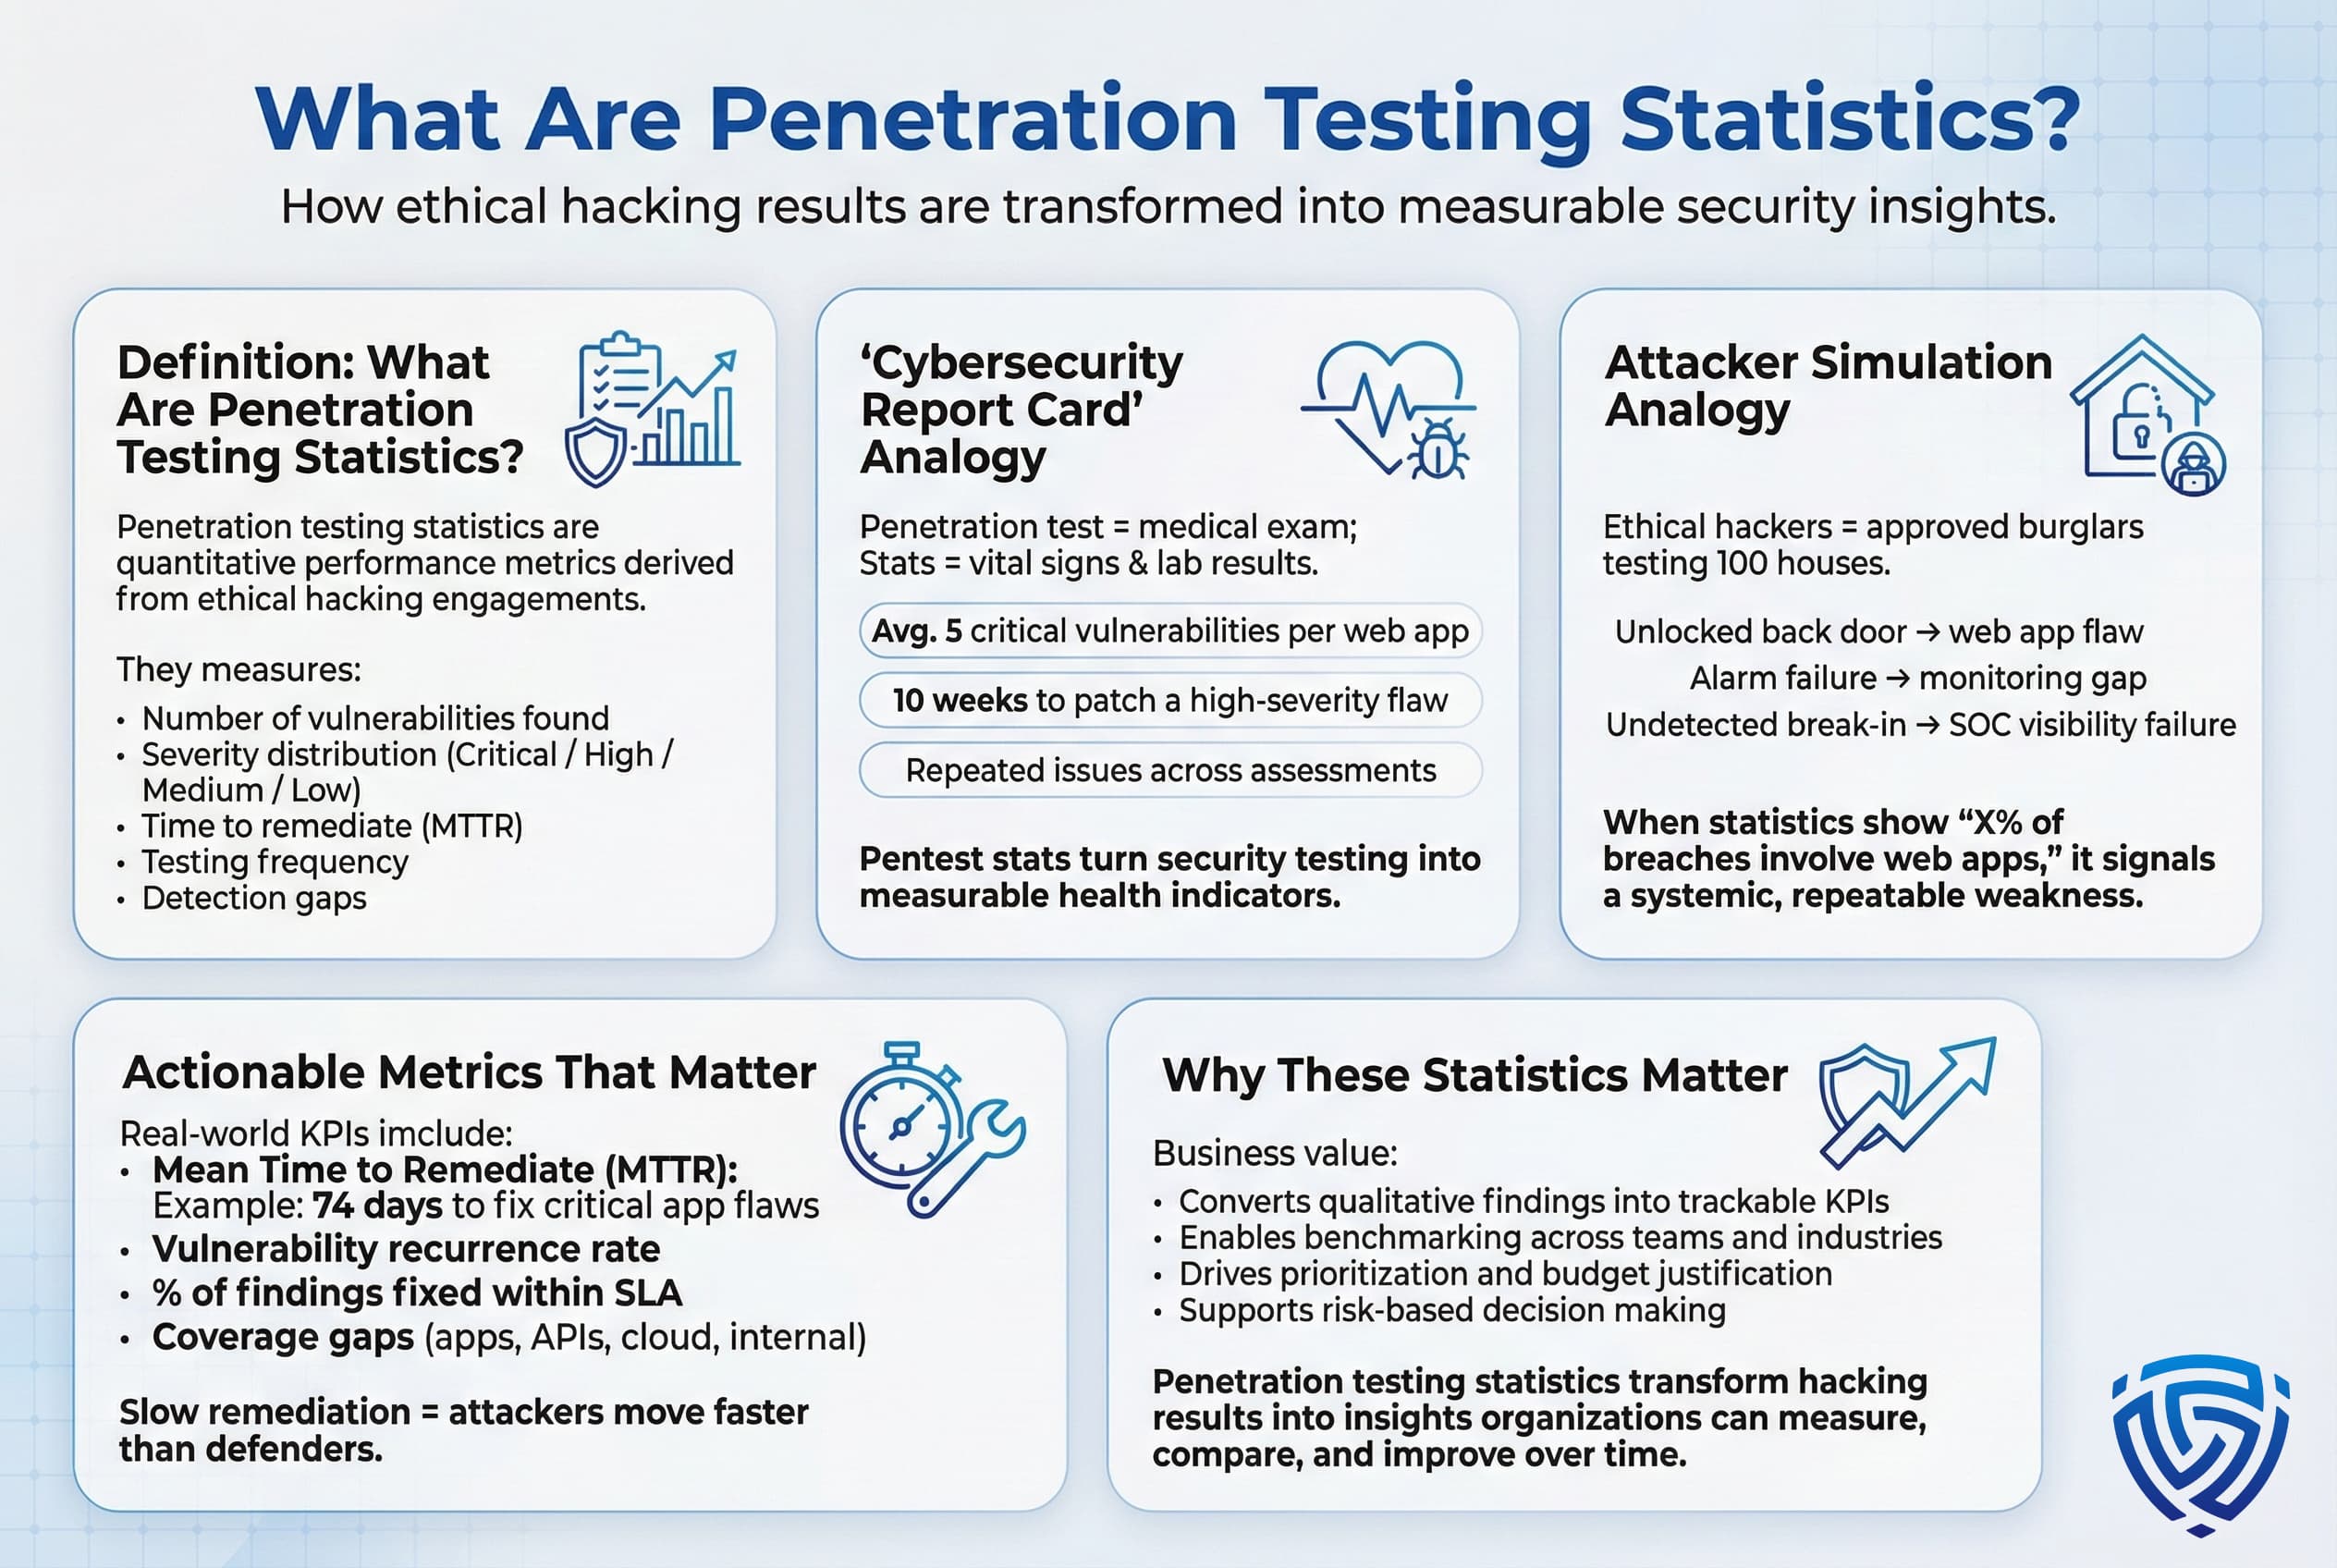
Penetration testing statistics are essentially the performance metrics of cybersecurity assessments. They quantify aspects of simulated attacks how many vulnerabilities are found, of what severity, how fast they’re fixed, how often tests are done, etc. Think of it as a cybersecurity report card produced by ethical hackers. Just as a medical exam yields vital signs and lab results about your health, a penetration test yields data about an organization’s security posture. For example, a pentest might reveal that a company’s web apps have on average 5 critical vulnerabilities, or that it takes the firm 10 weeks to patch a high severity hole. Aggregated across many organizations, these stats highlight common weaknesses and best practices.
An analogy: Imagine burglars trying to break into 100 houses with permission penetration testing stats are the tally of how many houses had the back door unlocked, how many alarms failed, and how many break ins went undetected by homeowners. In real terms, a stat like X% of breaches involving web application flaws indicates how often attackers are finding an unlocked digital door in companies’ web systems. A practical example is the metric mean time to remediate MTTR if stats show an average of 74 days to fix critical app vulnerabilities, that signals a remediation process that’s much slower than the pace of attacks. In summary, penetration testing statistics convert the qualitative outcomes of security assessments into quantitative insights that organizations can track and improve.
To understand the landscape, let’s look at the big picture numbers for penetration testing in 2024 2025. The industry has grown rapidly worldwide, with especially strong uptake in the United States.
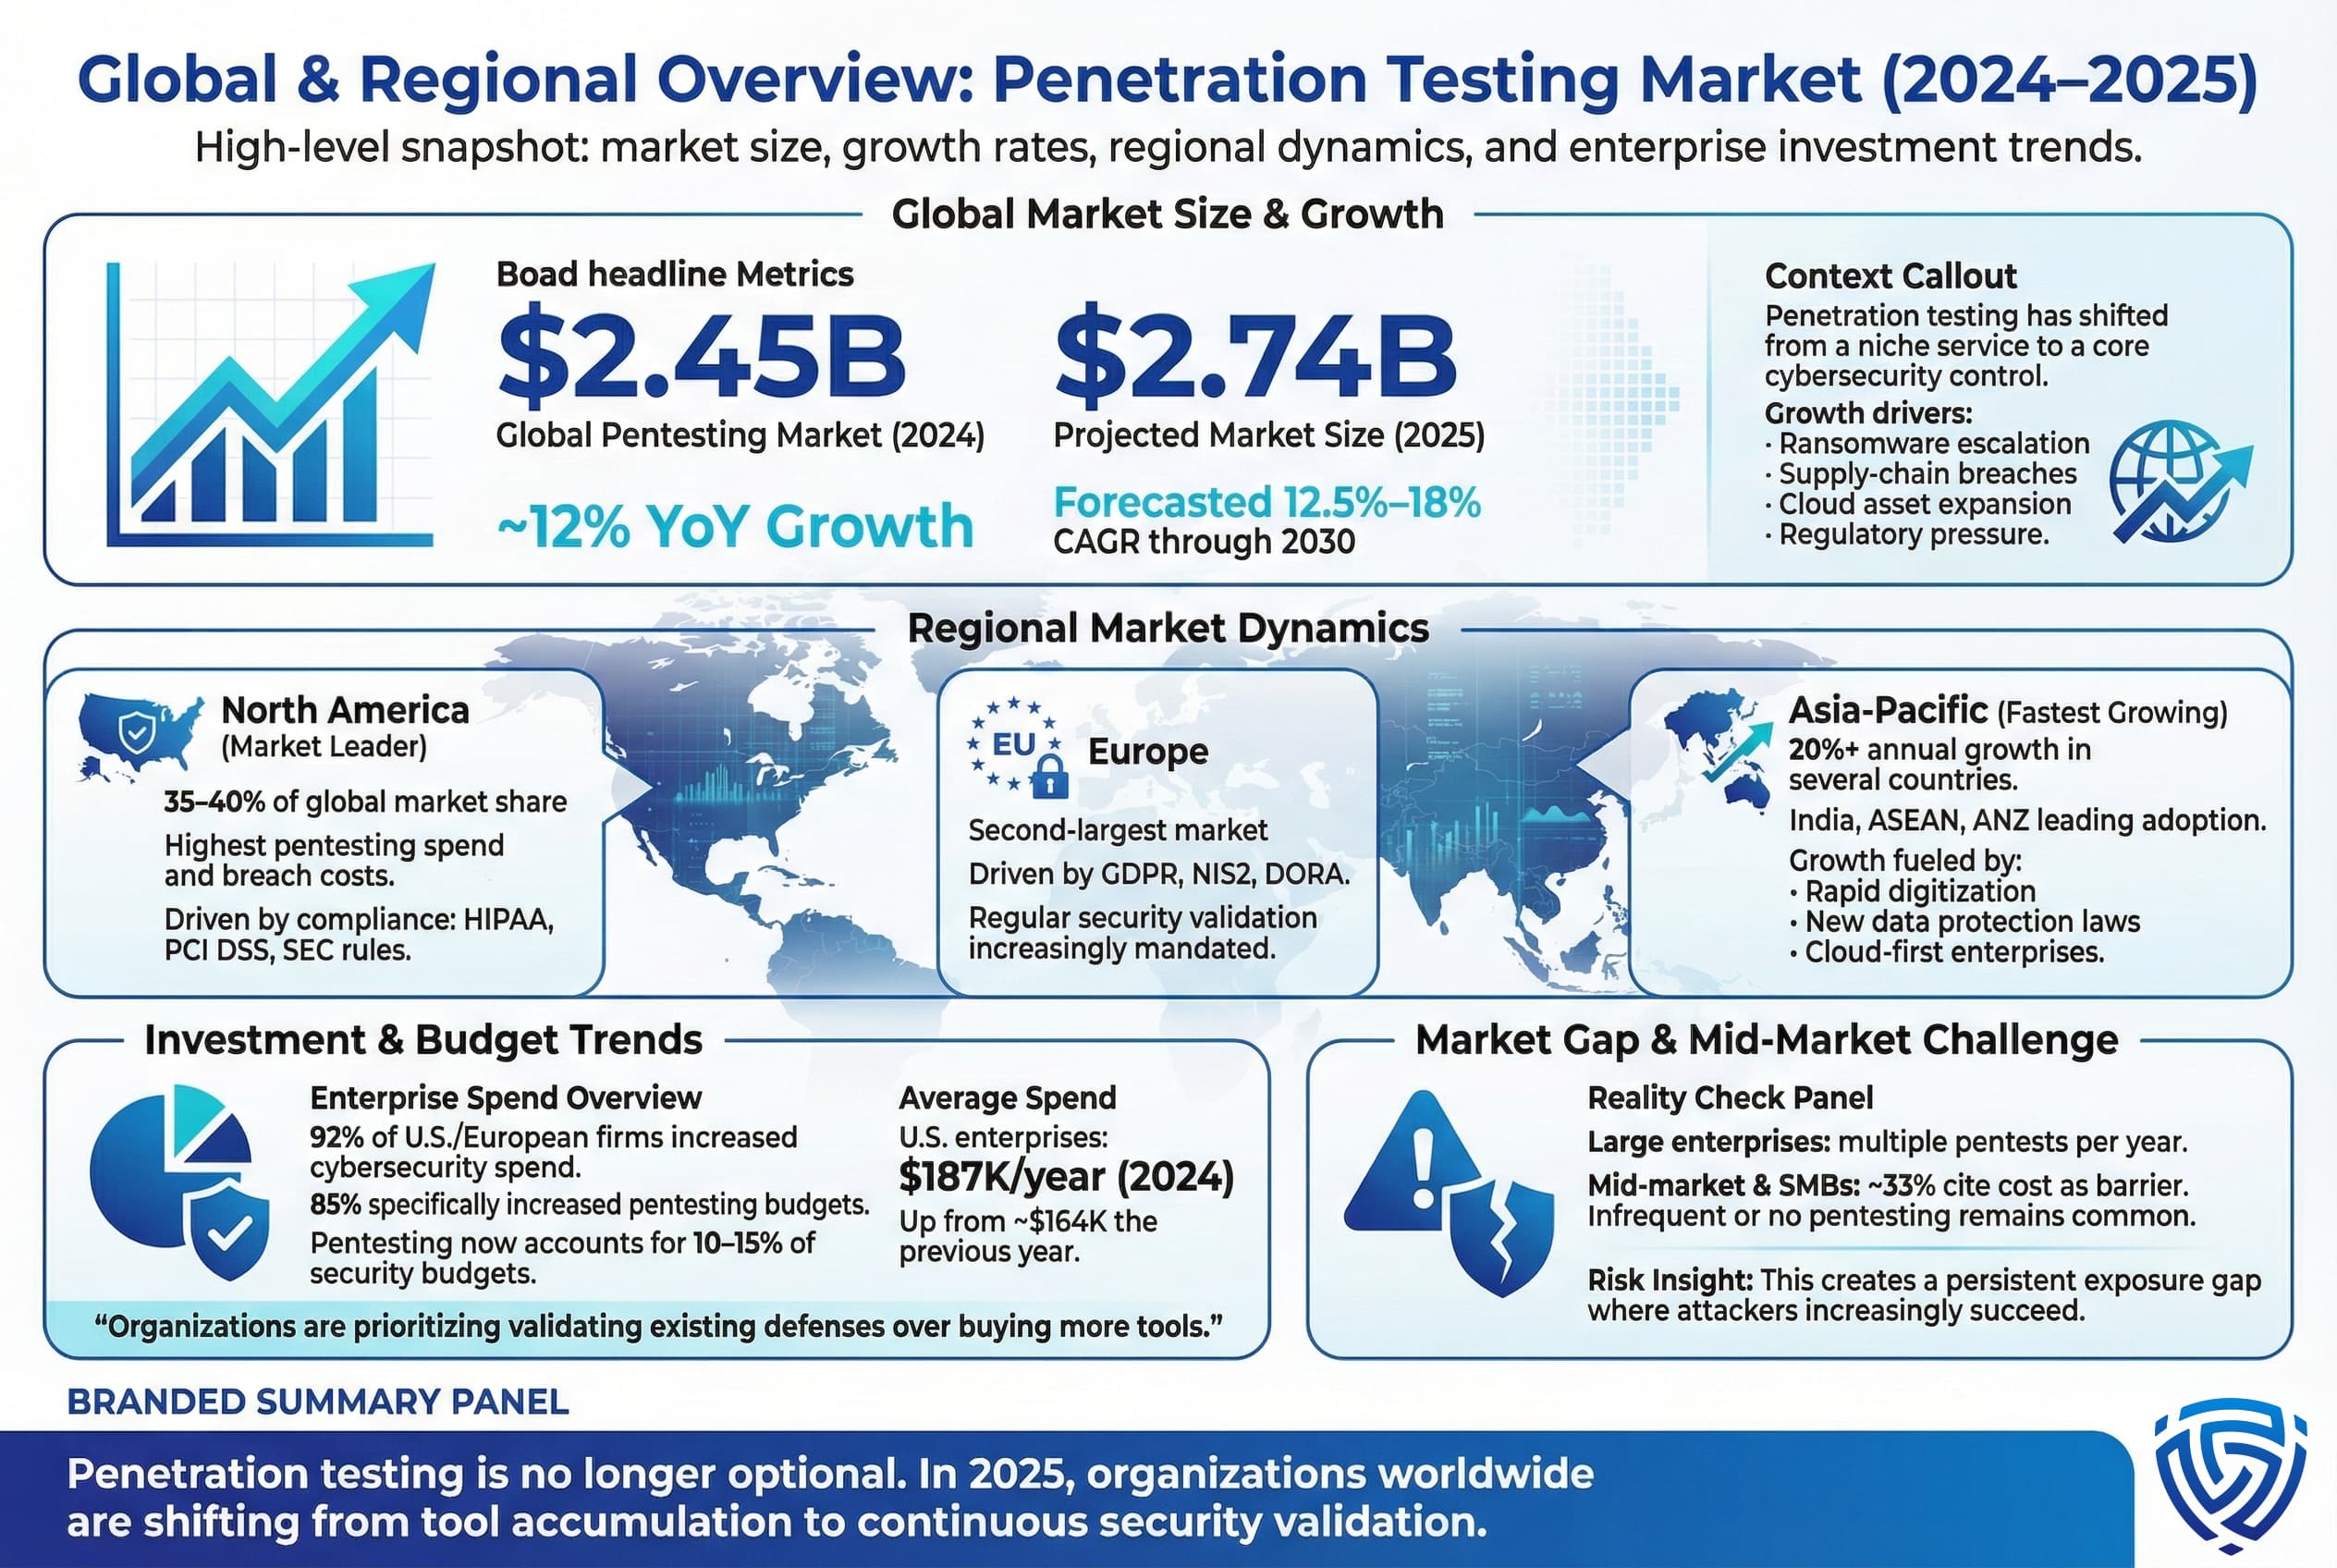
Global Market Size & Growth: The worldwide penetration testing market was $2.45 billion in 2024, and is projected around $2.74 billion in 2025. This indicates robust annual growth around 12% year over year. Analysts forecast continued expansion at double digit CAGR through 2030, with estimates ranging from 12.5% up to ~18% depending on adoption of new tech and regulatory drivers. In practical terms, pentesting has gone from a niche service a decade ago to a core cybersecurity investment today. The surge is driven by rising ransomware and supply chain attacks, stricter compliance mandates, and the sheer increase in cloud assets that need testing.
Regional Dynamics: North America remains the largest market for pentesting. The U.S. in particular leads in both spending and breach costs holding roughly 35–40% of global pentesting market share. This is fueled by a mature security ecosystem and laws like HIPAA and PCI DSS that effectively require testing. Europe is the second biggest region, propelled by GDPR and new EU directives NIS2, DORA pushing organizations toward regular security validation. The Asia Pacific region, however, is the fastest growing. APAC pentesting spend is climbing over 20% annually in some countries. Rapid digitization in India, ASEAN, etc., plus emerging data protection laws, are prompting companies there to invest in pentest services at an unprecedented rate.
Investment and Budget Trends: A majority of organizations are boosting their security testing budgets despite economic uncertainties. Last year, 92% of U.S./European firms increased overall cybersecurity spending, and 85% specifically raised their penetration testing budget. Pentesting now commands about 10-15% of enterprise security budgets on average. In the U.S., companies spent about $187,000 per year on pentesting in 2024, up from roughly $164k the year prior. This reflects recognition that adding the 76th defensive tool is less useful than rigorously testing the effectiveness of the 75 you already have. That said, spending is uneven while large enterprises treat pentests as must have, often conducting multiple engagements yearly, many mid-sized and small businesses still struggle. About one third of companies cite cost constraints as a reason for infrequent or no pentesting, highlighting a continued gap in the mid market.
| Metric | 2024 | 2025 | Trend |
|---|---|---|---|
| Global Pentesting Market Size | ~$2.45 B | ~$2.74 B | ↑ growth |
| U.S. Average Pentest Budget | ~$164k | ~$187k | ↑ +14% |
| Firms Using PTaaS Platforms | ~70% adopted | ~84% including planned | ↑ more continuous testing |
North America’s lead in pentesting is also driven by breach economics: the average cost of a data breach in the U.S. hit $10.2 million, the highest in the world. This creates a strong financial incentive for U.S. firms investing in preventative measures like pentesting. Meanwhile, in Asia Pacific, governments and financial institutions are starting to require pentests. For instance, India’s central bank mandated regular security testing for banks, contributing to ~19% CAGR in the Indian pentest services market as noted in industry reports.
For UK organizations, regulatory compliance is a key driver of regular security validation. GDPR fines and the new Digital Operational Resilience Act DORA mean that organizations need to not only secure data but also prove resilience through testing. The UK, Germany, and France make up a large portion of Europe’s ~$700M pentesting market, with the UK alone seeing ~10% annual growth aided by government cyber resilience investments.
In summary, the penetration testing practice is expanding across all regions, but its character varies: in the US it’s about preventing huge breach costs and insurance demands, in Europe it’s about meeting strict legal requirements, and in APAC it’s about keeping up with rapid digital expansion often leapfrogging to cloud first architectures. All regions, however, share a common theme: a shift from one off tests to ongoing validation as the new standard.
When penetration testers go to work, what do they actually find? This section breaks down the types of vulnerabilities most commonly discovered, and how severe they are.
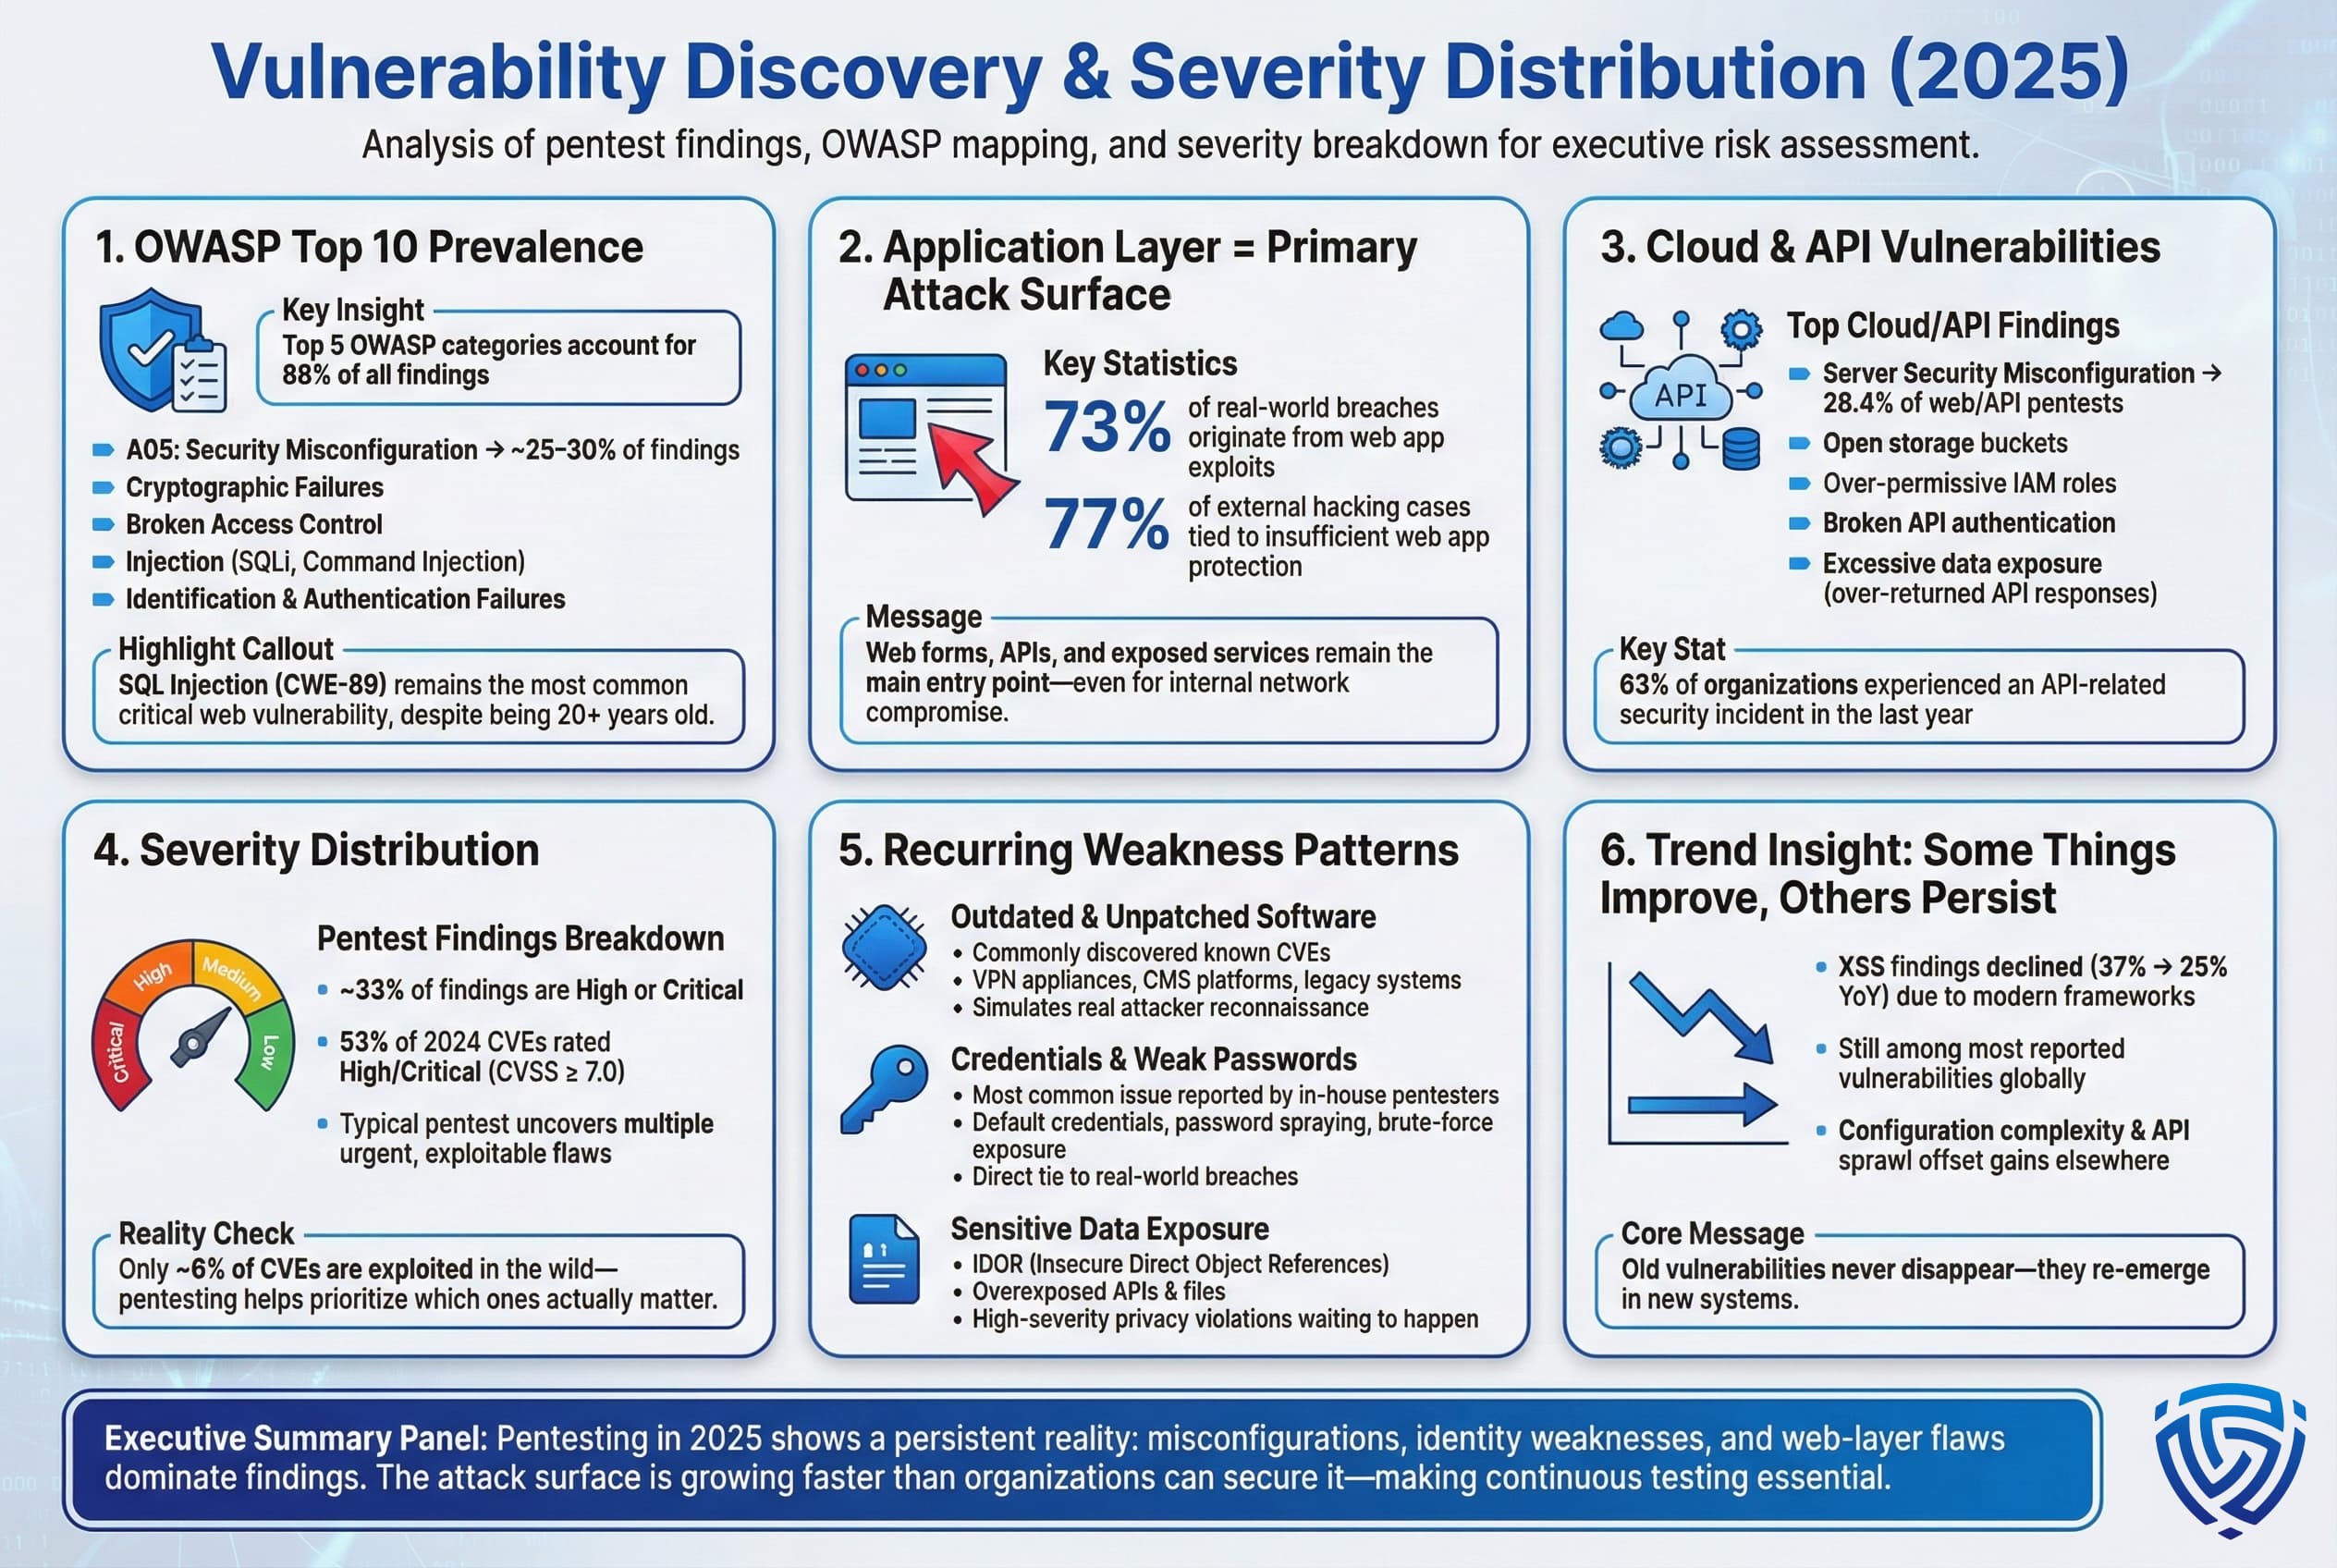
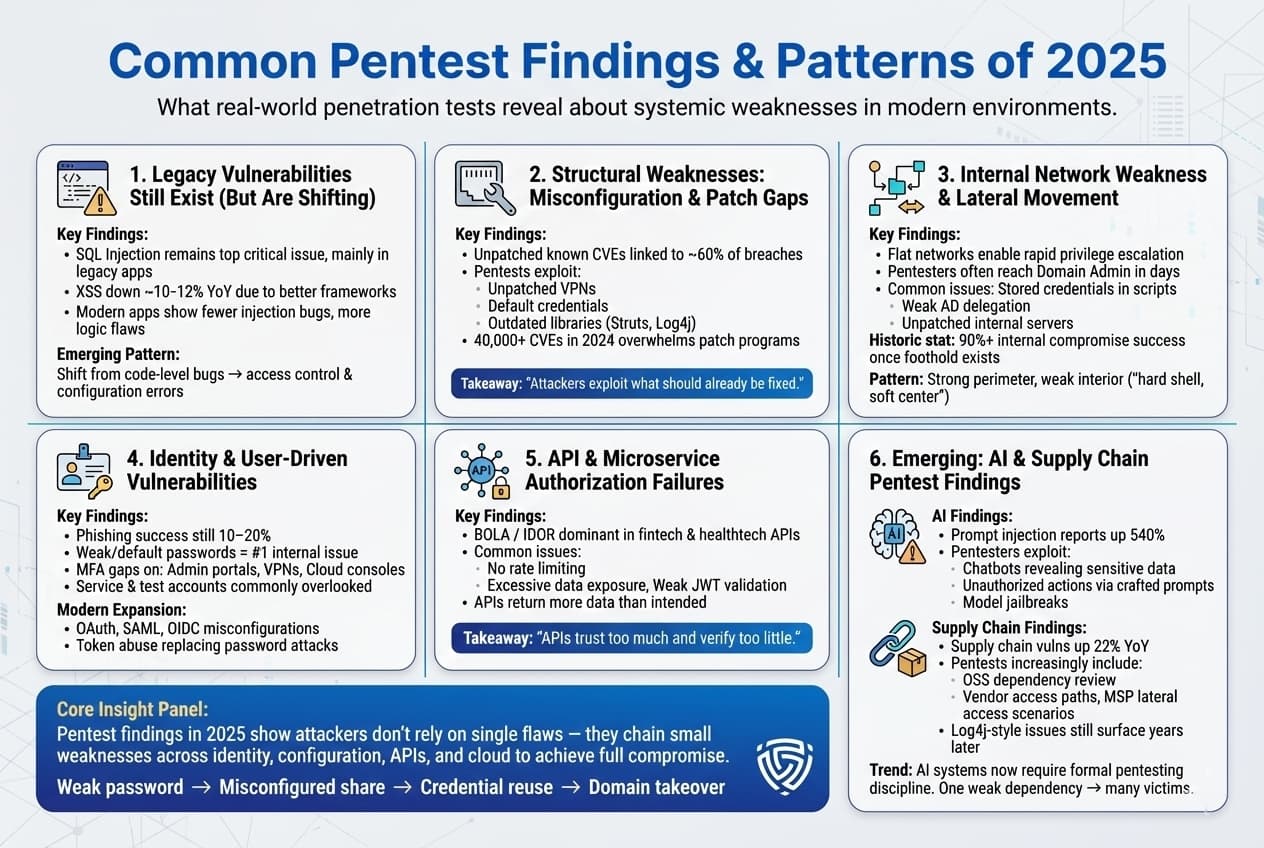
OWASP Top 10 Prevalence: Not surprisingly, the issues uncovered in pentests closely mirror the well known OWASP Top 10 web app risks. In a large 2024 analysis, the Top 5 vulnerability categories OWASP 2021 made up 88% of all findings. The single most frequently identified category was Security Misconfiguration OWASP A05 everything from improper cloud storage permissions to default credentials left unchanged. Misconfigs are essentially low hanging fruit, and they appear in a huge portion of assessments, often ~25–30% of all issues. Following that, Cryptographic Failures, weak encryption or data exposure and Broken Access Control were next, each very common. Classic Injection flaws like SQL injection and command injection remain a critical subset, although they are fewer in number than misconfigurations. It’s telling that even in 2024, SQL Injection CWE 89 was the most common critical vulnerability found in web apps, a vulnerability type dating back 20+ years. This indicates that as fast as developers patch old SQLi bugs, new web apps and APIs are introducing new ones, keeping this issue persistently at the top.
Real world breach data reinforces this focus on web/app vulnerabilities: 73% of successful breaches are traced back to web application exploits e.g. an attacker exploiting a web form or API. In other words, the application layer is the primary battleground. Even when targeting internal networks, attackers often start by abusing a web facing system to get in. A Kaspersky analysis found that 77% of external corporate hacking cases in 2020 21 involved insufficient web app protection, lack of input validation, etc. and that trend continued through 2024.
Cloud and API Findings: As businesses migrate to cloud infrastructure and expose more APIs, pentesters are finding a new crop of errors. One industry study noted that Server Security Misconfiguration was the #1 finding in 28.4% of web/API pentests more than a quarter of tests reflecting how easy it is to accidentally leave cloud storage buckets open, or misconfigure an S3 bucket’s access policy. Additionally, broken authentication in APIs e.g. weak tokens or missing access checks and excessive data exposure APIs returning more data than they should are rampant issues. For instance, testers commonly exploit APIs that lack proper access control to pull entire user lists or transaction records that should have been restricted. Given that 63% of organizations had an API related incident in the last year, these findings have immediate impact, they often represent direct pathways to data leakage if not fixed.
Severity Distribution: Not all vulnerabilities are equal. Penetration test reports typically categorize findings by severity Critical, High, Medium, Low based on exploitability and impact. What do the stats show about the severity mix? Data from full stack security assessments in 2024 indicates that roughly 33% of discovered vulnerabilities are High or Critical severity. This aligns with public vulnerability feeds: across all CVEs reported in 2024, about 53% were rated High/Critical CVSS 7.0 and above. In other words, over half of the bugs found are serious enough to potentially cause significant damage if exploited. This is a worrying proportion, it's not just informational or low risk issues being uncovered. For organizations, it means a typical pentest will surface multiple critical flaws that require urgent attention e.g. an unauthenticated remote code execution, or admin login bypass.
However, it’s also important to note that only a small fraction of all vulnerabilities tend to get exploited in the wild. As mentioned, around 6% of all published CVEs have known exploits observed. Pentesters help sort out which of the many findings are actually likely to be used by attackers. Often the focus is on those few criticals with active exploit kits or that align with tactics seen in recent breaches.
Recurring Weaknesses: Some patterns appear again and again. Aside from the aforementioned misconfigs and injections, testers commonly report:
In summary, pentesting continues to reveal that old vulnerabilities rarely die, they persist in new forms. We still see injection and XSS, albeit maybe less than before. We see a lot of configuration mistakes in complex cloud/hybrid environments. And we see human factors like weak passwords undermining security. The statistics paint a picture that while tools are improving e.g. fewer XSS due to frameworks, the overall attack surface is growing faster. Thousands of new apps, APIs, and devices are coming online with misconfigurations and known weaknesses, replacing those that were fixed. It’s a perpetual game of whack a mole, which is exactly why continuous testing, not one and done, is becoming essential.
Finding vulnerabilities is only half the battle. What happens after the pentest report is delivered? Remediation effectiveness metrics tell us how well organizations are patching or mitigating the issues that are found.
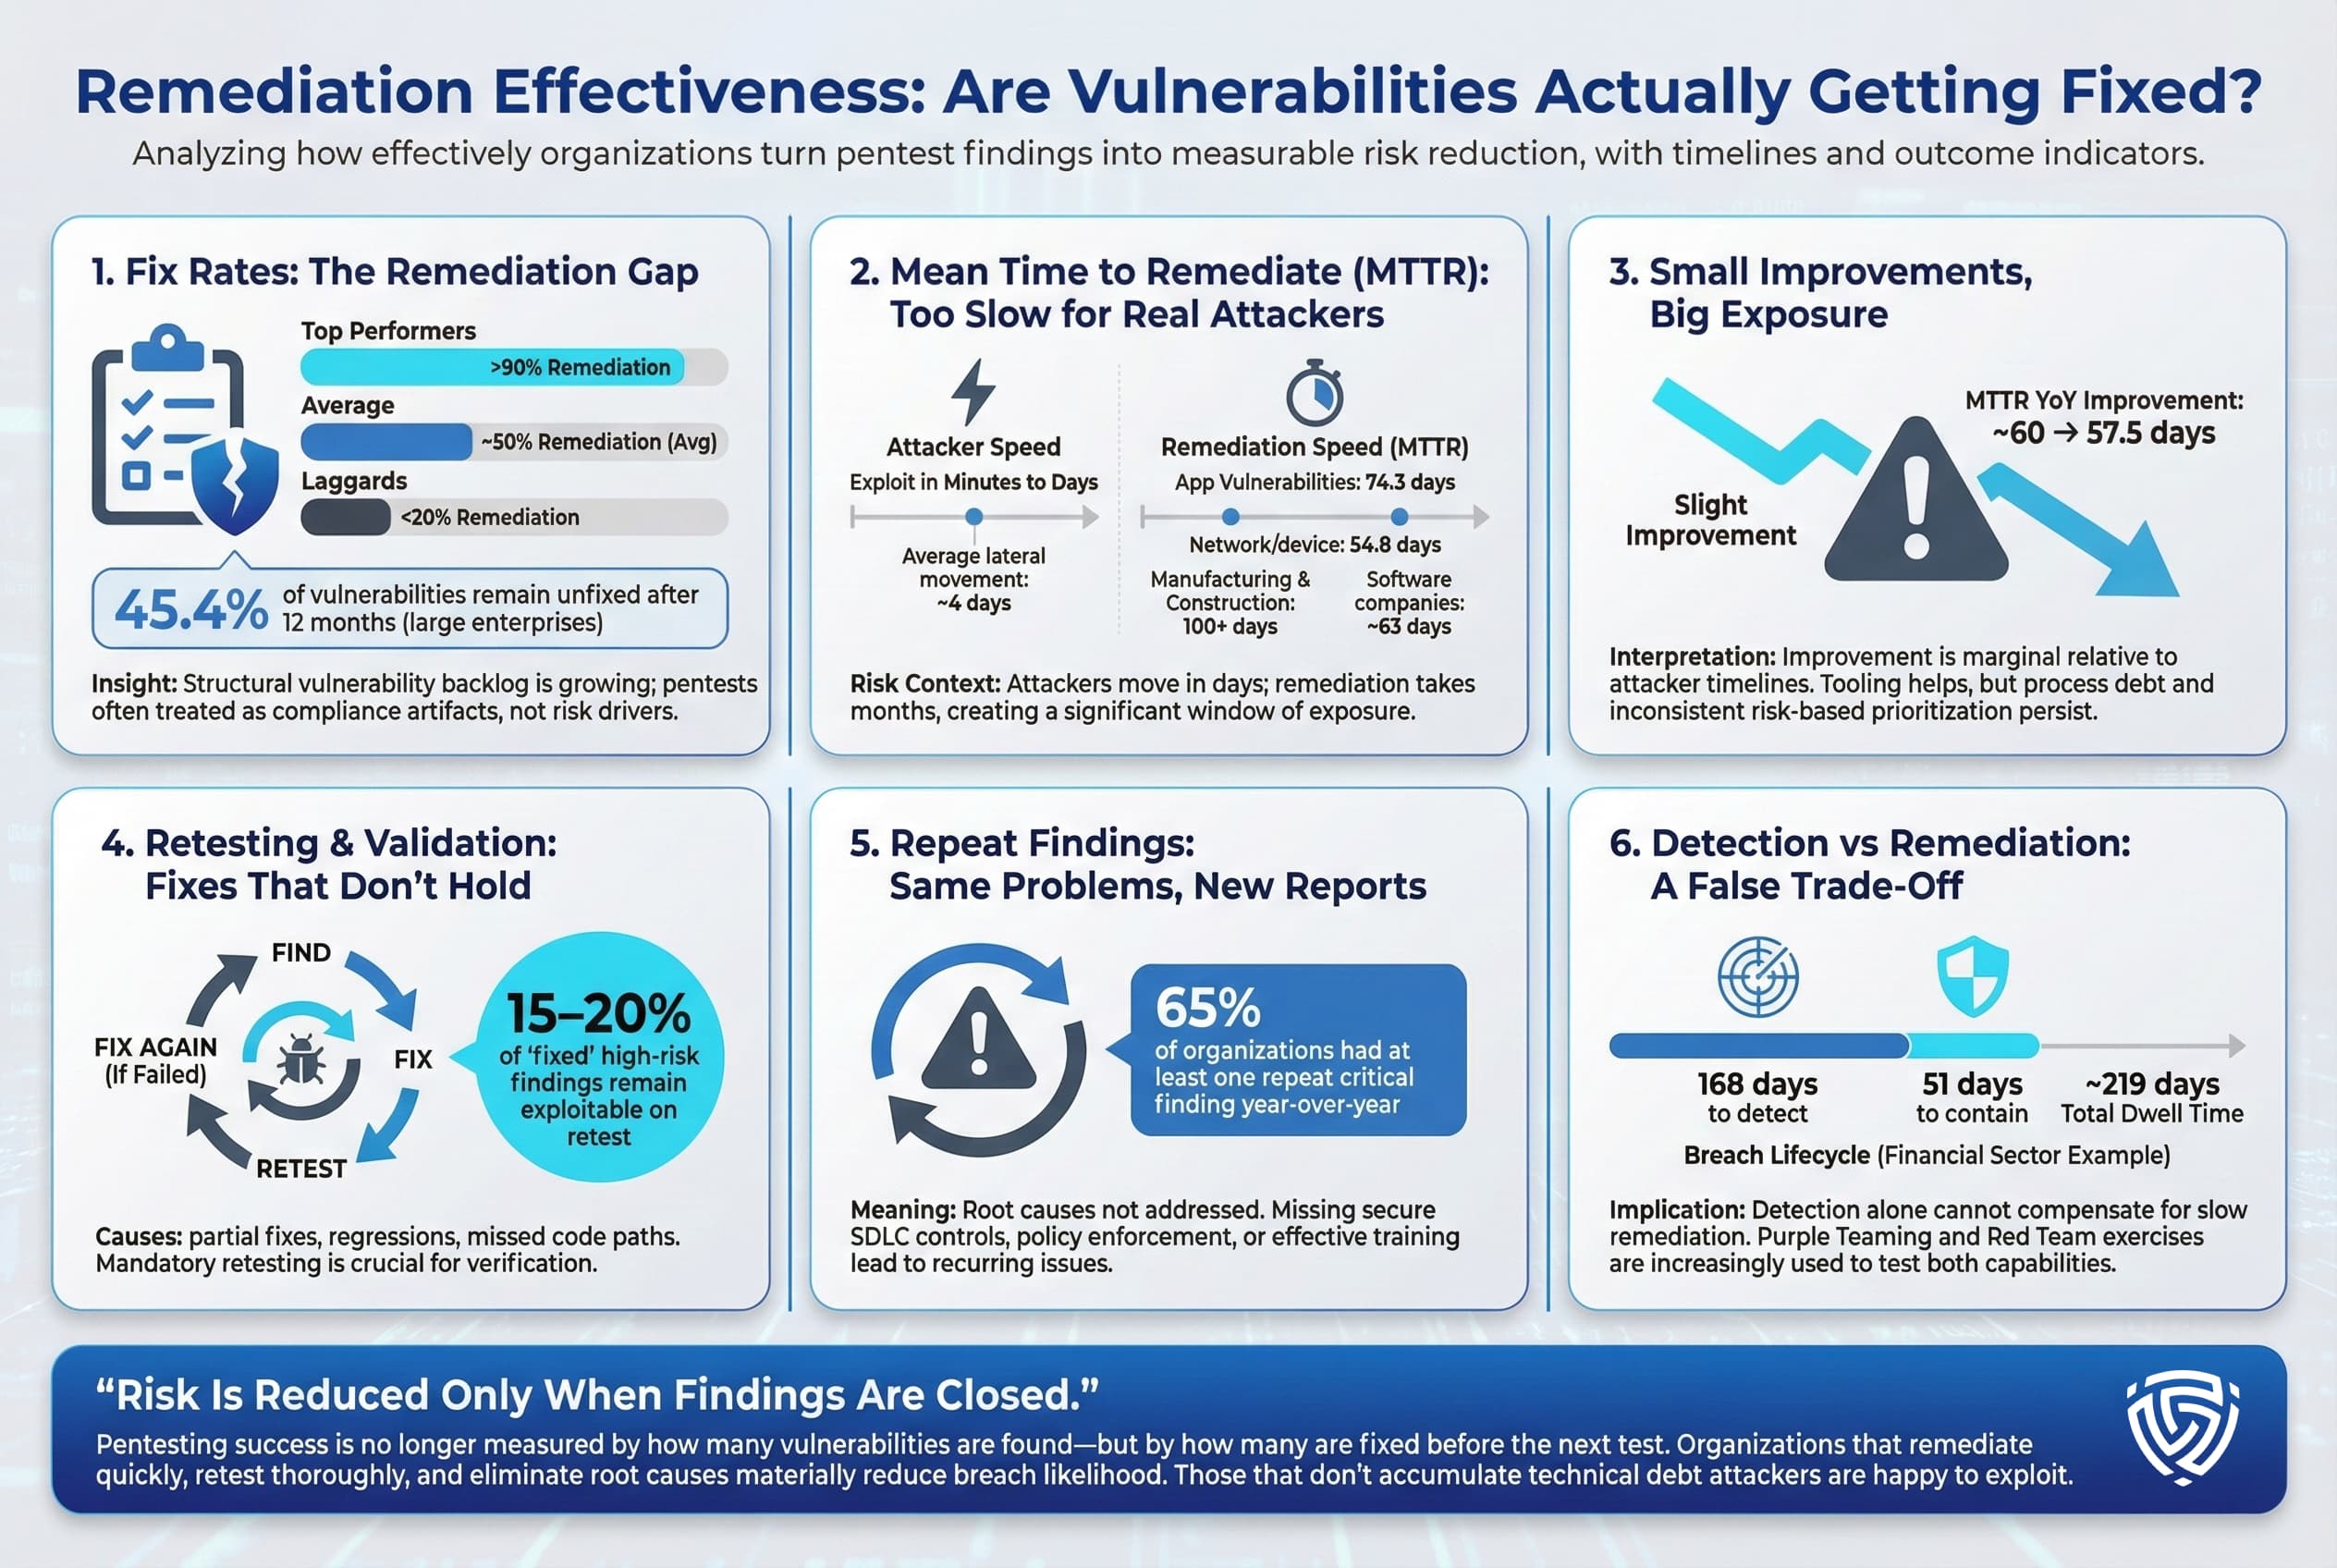
Fix Rates: One stark statistic: organizations, on average, only remediate about 50% of the vulnerabilities discovered in a penetration test. In fact, a leading full stack security report found that large enterprises failed to resolve 45.4% of discovered issues within 12 months of discovery. So nearly half of the identified holes remained open a year later. This indicates a significant remediation gap. Some vulnerabilities may be low risk or require major system upgrades hence they languish on the backlog, but the net result is an accumulation of known but unfixed weaknesses. The concept of a structural vulnerability backlog has emerged meaning that each year, organizations accumulate more debt in unpatched issues than they are able to fix, unless they radically improve processes.
Encouragingly, not all companies are the same: there’s a wide variance in remediation rates. Top performing organizations manage to remediate >90% of serious findings, whereas laggards fix under 20%. This suggests that with strong internal processes, high fix rates are achievable. Many high maturity teams have security champions embedded in development who jump on pentest findings and drive them to closure quickly, often patching critical issues within days. On the other hand, less mature orgs might treat the pentest report as a compliance formality they address a few criticals and leave the rest, resulting in repeat findings next test.
Mean Time to Remediate MTTR: Speed is another crucial metric. How long does it take on average to fix a vulnerability once it’s reported? The data is not flattering. According to Edgescan’s 2025 report, the average MTTR for critical/high application vulnerabilities was 74.3 days and 54.8 days for network/device vulns In other words, it takes about 2–3 months to fully remediate a high severity app issue. Some industry breakdowns show even slower response in certain sectors: e.g. construction and manufacturing companies averaged over 100 days MTTR, whereas software firms averaged around 63 days. This implies that organizations with agile, DevOps cultures like software tech companies tend to patch faster, likely due to better integration of security into development pipelines. Conversely, industries with lots of legacy systems or uptime constraints think industrial systems that can’t be easily taken down for patching struggle to remediate quickly.
The danger with a 74 day fix window is evident when compared to attacker timelines. Reports from pen testers and Red Team exercises show that the average time for an attacker to penetrate a local network is ~4 days after initial access and sometimes just minutes to exploit a vulnerable system. If a company leaves a critical vulnerability unpatched for 10+ weeks, the probability that an attacker will find and exploit that hole in the meantime is high. This is how many breaches occur, the window of exposure far exceeds the time needed for attackers to strike.
There is some positive trend: Edgescan noted a slight improvement in MTTR globally from ~60 days down to 57.5 days year over year. This could indicate that companies are slowly getting faster at patching, perhaps due to better orchestration tools, pressure from management, or the adoption of risk based vulnerability management focusing on the most dangerous issues first. Yet, the improvement is marginal relative to the scale of the problem.
Retesting and Validation: Another aspect of remediation effectiveness is whether organizations verify fixes and perform retests. Best practice is to always retest vulnerabilities after they are supposedly fixed, to ensure the patch/hardening was effective. Pentest providers often include one retest cycle. However, not all firms take advantage of it. Some statistics indicate that a non-trivial percentage of findings marked resolved actually remain exploitable due to incomplete fixes or regression for example, a dev might fix one occurrence of a bug but not realize it exists elsewhere in the code. Thus, thorough retesting is part of effective remediation. It’s not captured in broad stats, but anecdotal evidence from consulting teams suggests that 15-20% of initial high risk findings may still be exploitable on first retest, requiring additional rounds of fixes.
Repeat Findings: A frustrating metric for testers is the recurrence of the same vulnerability in subsequent tests for a client. This often happens when systemic issues aren’t addressed e.g. we found default passwords in Q1, and again in Q3 because the organization has no policy to prevent new systems from having defaults. Some pentest stats show high rates of repeat findings year over year. One survey noted that 65% of organizations had at least one repeat critical finding in consecutive annual pentests suggesting the issue was never properly fixed or kept re introducing. This speaks to process problems pentesting should feed into long term security improvements, not be a Band Aid. If the same vulnerability shows up again, it implies that root causes training, policy, and secure SDLC controls weren’t implemented after the first test.
Dwell Time vs. Detection: It’s worth linking remediation to detection capabilities. Some companies argue they might not fix everything quickly, but they can detect attacks and respond. However, stats on Mean Time to Detect MTTD breaches are not very reassuring either e.g. in the financial sector it took an average 168 days to identify a breach and 51 days to contain it 219 days total in recent data, which is actually better than global average but still about 6 months of attacker dwell time. Penetration testing, especially in the form of Red Team exercises, can help test detection/response too by measuring whether the Blue Team catches the simulated attack. Many organizations are now using purple team approaches and collaborative attacker defender exercises to train their SOC and reduce MTTD. While not a direct statistic from pentests, this is a qualitative outcome that some advanced programs track: did our security monitoring detect the pentester’s activities? If not, that’s a gap to fix in the SOC.
In summary, remediation metrics show that identifying vulnerabilities is outpacing the ability to fix them for many organizations. The backlog of known issues grows, and attackers capitalize on the lag. Leading companies are trying to close this gap by prioritizing better using risk scoring like EPSS, CISA KEV lists to patch what’s most likely to be hit first and by automating patch pipelines where possible. Yet for many, the time to fix remains measured in months, not days. Pentesting stats thus increasingly focus not just on discovery counts, but on how many findings were remediated by the next test because the ultimate goal is risk reduction, not just risk identification.
Different industries face different threat landscapes and regulatory pressures, which is reflected in their penetration testing practices and statistics. Let’s examine a few key sectors Finance, Healthcare, Retail, and the SME segment to see how they compare.
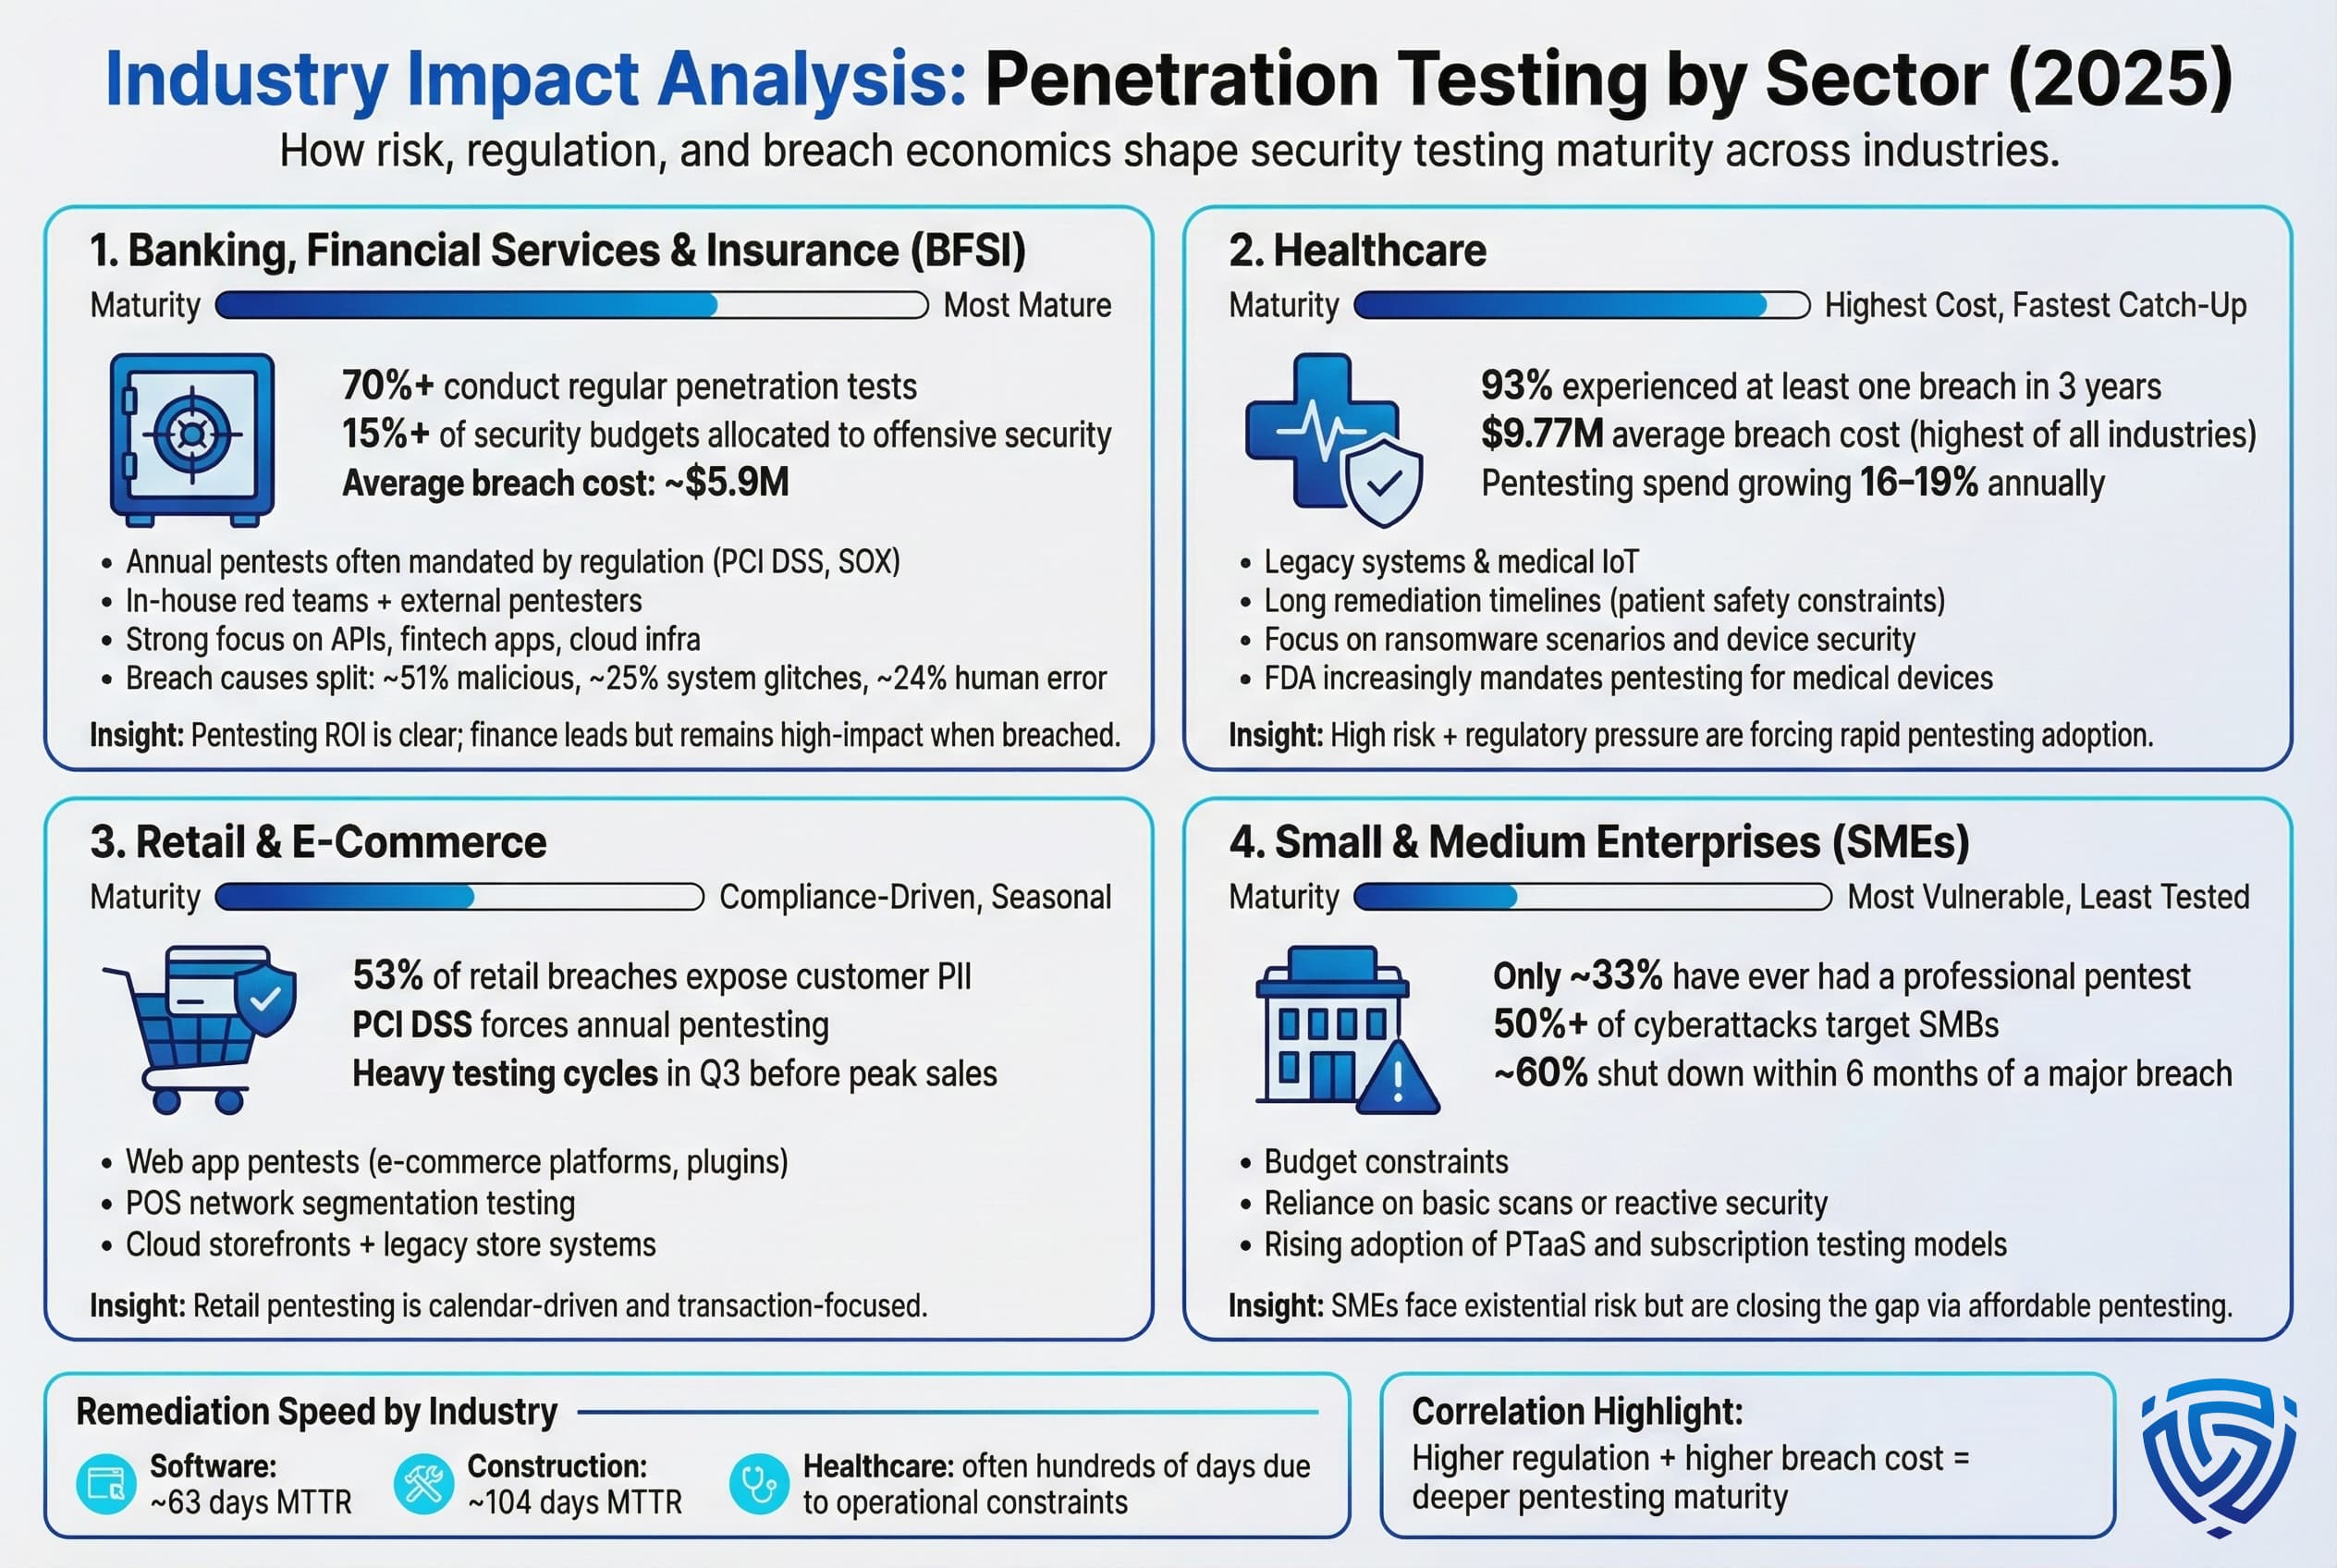
Banking, Financial Services & Insurance BFSI: The financial sector is generally ahead of the curve in penetration testing. Banks and insurers handle highly sensitive data and operate under strict regulations: PCI DSS for payment systems, SOX for financial reporting controls, etc., so they were early adopters of rigorous security testing. According to industry surveys, financial services organizations lead in pentesting adoption, with over 70% conducting tests regularly, often mandated at least annually by compliance. Many large banks have in-house red teams and also bring in external firms for annual assessments and adversary simulations. One metric shows BFSI companies on average allocate 15% or more of their IT security budget to offensive security pentest and red team activities, which is higher than most other industries.
The ROI for pentesting in finance is clear when looking at breach costs: the average cost of a data breach in the financial industry was around $5.9M in recent studies versus ~$4.5M global average. Financial institutions also suffer indirect losses from customer churn and reputational damage when breaches happen, so they are highly motivated to prevent incidents. Even so, breaches occur. IBM noted the finance sector had the second highest average breach cost of all industries in 2024. Interestingly, the breakdown of breach causes in finance shows that not all are external hacks, about 25% of breaches were attributed to system glitches or IT failures, and 24% to human error, in one analysis with the remaining ~51% malicious attacks. This underscores that pentesting in finance must cover not just external hackers but also scenarios like misconfigurations and insider mistakes. Many financial firms have expanded testing to include cloud infrastructure and fintech APIs, as these are now prime targets e.g. vulnerabilities in banking mobile apps or open banking APIs.
Healthcare: Healthcare has quickly become a hotspot for cybersecurity and thus penetration testing. For 13 years running, healthcare has had the highest data breach costs of any industry, an average breach cost of $9.77 million in 2024. This is due to the high value of medical data, ransomware impacts on hospital operations, and regulatory penalties under laws like HIPAA. A staggering 93% of healthcare organizations reported at least one breach in the past 3 years, a statistic that highlights how pervasive attacks on health providers have been ransomware on hospitals, clinic data theft, etc.. These realities are driving healthcare entities to ramp up pentesting at one of the fastest rates. Reports project 16-19% annual growth in healthcare pentesting spend as hospitals, pharma companies, and insurers try to plug security holes.
However, healthcare faces unique challenges. Many medical systems are legacy or cannot be easily taken offline for patching due to patient care needs that can’t reboot the MRI machine problem. Pentests often find critical vulnerabilities in these environments that then take extra long to remediate or require compensating controls. Statistics show healthcare organizations have widely varying MTTR, some patient record systems remain unpatched for hundreds of days because updating them risks downtime in care. Pentesters also focus on IoT and medical device security in this sector, which is a newer area e.g. testing an insulin pump’s wireless protocol for exploits. A positive sign: regulators like the U.S. FDA for medical devices have started insisting on pentesting and vulnerability disclosure programs as part of certifications, which should improve security of new healthcare tech over time.
Retail and E Commerce: Retailers and e-commerce companies are frequent pentest clients because they are prime targets for credit card theft, personal data breaches, and fraud. Payment systems and e-commerce web applications are the crown jewels here. PCI DSS compliance essentially forces any large retailer to conduct regular penetration tests PCI Requirement 11.3. Thus, penetration testing in retail often follows an annual cycle timed before peak shopping seasons to ensure any issues are fixed before Black Friday, for instance. Common stats: A large portion of retail breaches involve personal data and cardholder data. One report said 53% of data leaks in retail included customers’ PII addresses, phone numbers, etc.. This emphasizes why web app pentesting for things like SQLi or XSS that could expose customer info is crucial.
Retail often has a mix of modern cloud services for online stores and legacy point of sale networks in physical shops. Pentesters in retail therefore check for things like default credentials on POS systems, segmentation between store networks and corporate, and vulnerabilities in e-commerce platforms Magento, Shopify plugins, etc.. A noted trend is seasonal testing. Many retailers do a big pentest push in Q3 to fortify systems before holiday shopping, and then a code freeze. The statistics might show that 80% of major U.S. retailers undergo external pentests in Q3 each year as a standard practice now.
Small and Medium Enterprises SMEs: While not an industry per se, it’s worth discussing SMEs as a group. SMEs have lagged in penetration testing adoption due to resource constraints. According to compiled statistics, only about one third of small businesses have ever had a professional penetration test conducted. Most SMEs rely on simpler vulnerability scans or just reactive security. Yet ironically, SMEs are extremely vulnerable, over 50% of cyberattacks target small/mid businesses, and the impacts can be devastating. It’s often cited and supported by analyses that roughly 60% of small companies shut down within 6 months of a serious cyber breach. The lack of contingency funds and brand damage is too much for them to recover.
Given this, there’s a big awareness push to get SMEs to invest in security testing. The rise of more affordable PTaaS platforms has been a boon here. Instead of paying $50k for a one time consult, a small business might pay a few hundred a month for ongoing testing services. The stats show some improvement: in recent years, adoption of cloud based pentesting solutions by SMBs has grown, and more managed service providers are packaging pentests for their smaller clients. Still, the gap is large. Where a Fortune 500 might run tens of pentests a year, a 100 employee company might run zero or one. This is an area where industry groups and government initiatives like free security assessments or tax incentives for cybersecurity are trying to make a difference.
Other Sectors Briefly: Government agencies typically engage in pentesting due to mandates every U.S. federal agency, for example, is required to have independent penetration tests under FISMA/NIST guidelines. Tech companies, software, cloud providers often have the most advanced programs: constant pentesting, bug bounty programs, etc., and they also measure things like security debt carefully. Meanwhile, critical infrastructure energy utilities are starting to do more red teaming given geopolitical cyber threats, but stats show their remediation times can be slow because of operational technology constraints.
To illustrate the variance in remediation by industry, recall the Edgescan stat: software sector MTTR ~63 days vs. construction sector 104 days. Also, IBM’s Cost of Breach data consistently shows healthcare at the top cost, followed by finance, then pharma, technology, energy in varying order, and public sector and education often with lower costs but possibly due to smaller breach sizes. These costs influence how much each industry invests in prevention like pentesting.
In essence, every industry now recognizes the need for penetration testing, but the depth and frequency are guided by the specific risks and regulations they face. Finance and tech tend to be ahead, healthcare and critical infra are in a rapid catch up mode, and small enterprises are still trying to find cost effective ways to participate. The statistics clearly correlate higher risk/higher regulation with more robust pentesting efforts.
Zooming out by geography, penetration testing trends also show differences by region in 2024 2025:
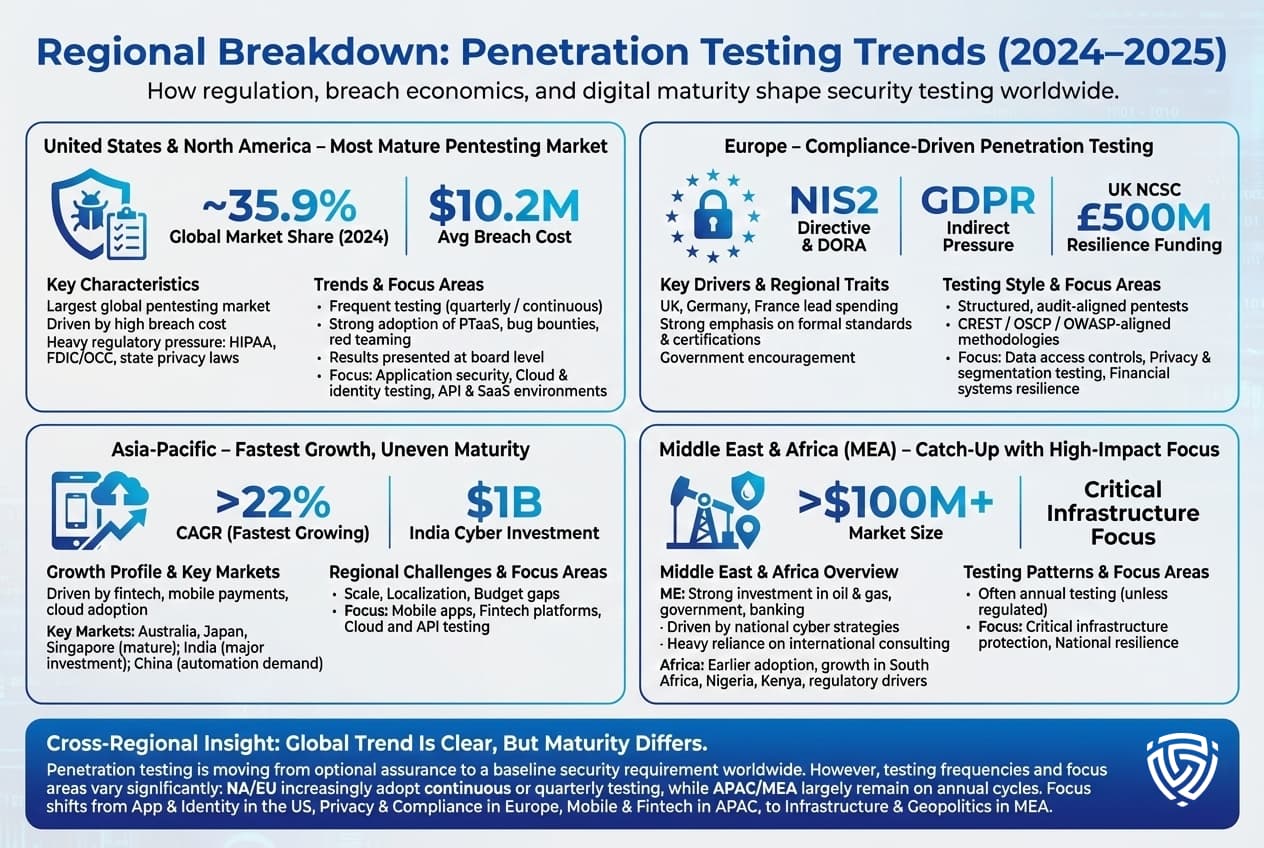
United States North America: The U.S. is the largest and most mature market for penetration testing services. One reason is the high cost of breaches at $10.2M average per incident in 2024, U.S. breaches cost double the global average, motivating heavy investment in prevention. U.S. companies also operate under a patchwork of regulations, state privacy laws, federal sector specific rules that often imply or explicitly require pentesting. For example, healthcare entities under HIPAA are pushed to do periodic technical evaluations, and financial firms under FDIC/OCC guidance are expected to conduct regular security testing.
Accordingly, North American organizations allocate significant budgets and have helped fuel innovations like PTaaS. It’s reported North America held about 35.9% of the pentesting market share in 2024. U.S. firms are also early adopters of bug bounty programs and crowdsourced security testing alongside traditional pentests. A cultural factor: U.S. corporate boards have become more educated on cybersecurity due in part to high profile breaches, so they are asking management for validation that we’ve been tested against real threats penetration testing stats and reports often make it into board presentations now.
Europe: Europe is similarly advanced, but driven more by compliance. The EU’s General Data Protection Regulation GDPR doesn’t explicitly mandate pentests, but its hefty fines for data breaches have indirectly caused companies to adopt more rigorous testing as a preventive measure. More directly, the new NIS2 Directive for critical infrastructure and the Digital Operational Resilience Act DORA for financial institutions do require regular security assessments, including pentesting, for a wide range of organizations in the EU. Thus, European financial entities, utilities, healthcare providers, etc., are ramping up testing to meet these legal obligations.
Europe’s pentesting market was roughly the second largest after NA, with the UK, Germany, and France leading spending. The Brussels effect means even companies outside the EU that do business there have to adhere to high standards. One interesting regional stat: The UK’s National Cyber Security Centre NCSC invested £500M in 2024 towards improving resilience, including funding more frequent red team exercises for critical sectors indicating government led encouragement of pentesting. European firms also tend to emphasize certifications that require that pentesters hold CREST, OSCP, or similar credentials and that tests follow standards like OWASP or ISSAF, to satisfy auditors.
Asia Pacific: APAC is the fastest expanding region for pentesting, albeit from a smaller base. Key drivers: massive digitization, fintech boom, and a series of high profile cyber incidents that have spurred government action. For example, in 2023 2024, breaches in Australia like Optus, Medibank led the government to push for stricter testing norms. India launched a Digital India initiative and committed $1B to cybersecurity, with penetration testing services specifically cited as a priority area to protect digital payments. Asian financial hubs Singapore, Hong Kong have very cybersecurity aware regulators who issue guidelines advocating regular pentests and even simulated cyber drills for banks.
Statistically, some forecasts put APAC pentesting market growth at >22% CAGR, outpacing other regions. However, maturity varies widely. Countries like Japan and Australia have many companies with established testing programs, whereas in some developing markets, awareness is still growing and the budget is lower. A peculiar challenge in APAC is scale e.g., a single Chinese tech company might have thousands of applications, so they are looking at more automated pentest solutions to cover breadth. Also, language and localization can be an issue. Some global pentest providers partner with local firms in Japan, Korea, etc., to navigate language and local compliance.
Middle East & Africa MEA: This region is catching up in cybersecurity testing. In the Middle East, critical sectors like oil & gas, government, and banking have been investing significantly in pentesting, often driven by national cybersecurity strategies e.g. Gulf countries establish cyber authorities that mandate testing in government and finance. Israel is a special case as a cyber tech hub, many Israeli companies themselves build pentest tools and have rigorous internal red teams. On the other hand, Africa as a whole is earlier in the adoption curve, however, South Africa, Nigeria, and Kenya have seen increased demand for pentesting with the growth of their financial and telecom sectors and introduction of data protection laws like POPIA in South Africa.
Regional stat examples: The Middle East pentesting market size crossed $100M annually and is growing at double digits, partly due to major events e.g. securing infrastructure for world expos, sports events, etc.. Many MEA organizations rely on international consulting firms for pentests due to a shortage of local experts, as a result, there’s a push to train more cybersecurity professionals regionally.
One difference lies in frequency of testing North America and Europe are more likely to have quarterly or continuous testing programs in large enterprises, whereas in some APAC and MEA organizations, annual testing is still the norm unless regulation requires more. For example, a survey found only ~13% of smaller organizations in APAC did quarterly tests, similar to global small org stats. Another difference is focus areas in the U.S., a lot of testing effort goes into application security, cloud, and identity systems because that’s where breaches happen and compliance focuses on personal data, in Europe, privacy and GDPR add emphasis on testing data access controls, in APAC, there’s huge interest in testing mobile applications and fintech platforms given the leapfrogging to mobile payments, in MEA, critical infrastructure protection is a big theme due to geopolitical threats.
Despite these differences, the overall trajectory is that penetration testing is becoming a standard practice globally. Even regions that were slow starters are recognizing that you can’t secure what you don’t test. Multinational companies are also enforcing the same level of testing across all their regional branches, a U.S. headquartered company will run pentests on its Latin America or Asian subsidiaries to ensure uniform security. This is raising the bar worldwide.
In conclusion, regional stats underscore that no one is immune to cyber threats whether the driver is a compliance fine in the EU, a massive consumer breach in the US, a government mandate in APAC, or the high stakes of protecting oil infrastructure in the Middle East, every region has compelling reasons to ramp up pentesting. The maturity levels differ, but the gap is closing as knowledge and services spread.
Each year brings new wrinkles in what penetration testers encounter. Here we highlight the notable vulnerability patterns and systemic weaknesses coming out of 2025’s pentesting efforts:
In essence, 2025’s common findings span both the old and the new: we still see poor passwords and injections, but we also see a lot of cloud/API mistakes and even AI system flaws. The overarching pattern is complexity: modern environments have many interconnected pieces on prem, cloud, third party APIs, AI tools and misconfiguring any one of them can open a hole. Penetration testers are expanding their playbook to cover all these areas, which is why the trend is toward continuous and comprehensive testing rather than a narrow scoped point in time test. The stats and findings support that a holistic approach is needed: attackers will chain together multiple small weaknesses: a leaked credential here, a misconfig there, plus a missed patch to achieve a major breach. Therefore, pentest findings increasingly highlight chained vulnerabilities not just isolated issues but how one can lead to another. For example: an internal test might report, We exploited a weak password to get a user account, then found a misconfigured file share to get an admin hash, then used Pass the Hash to take over the domain. No single stat in the report covers that whole chain, but it’s the combination that was lethal.
Pentesters often convey such scenarios as lessons: if any link in the chain had been fixed, strong password policy, or proper share permissions, or disabled NTLM hashing, the attack would have been foiled. Thus, the pattern is moving away from whack a mole on individual CVEs and toward understanding systemic weaknesses which is where we turn data into strategy.
Beyond the specific vulns and metrics, there are broader trends in how penetration testing itself is evolving in 2025:
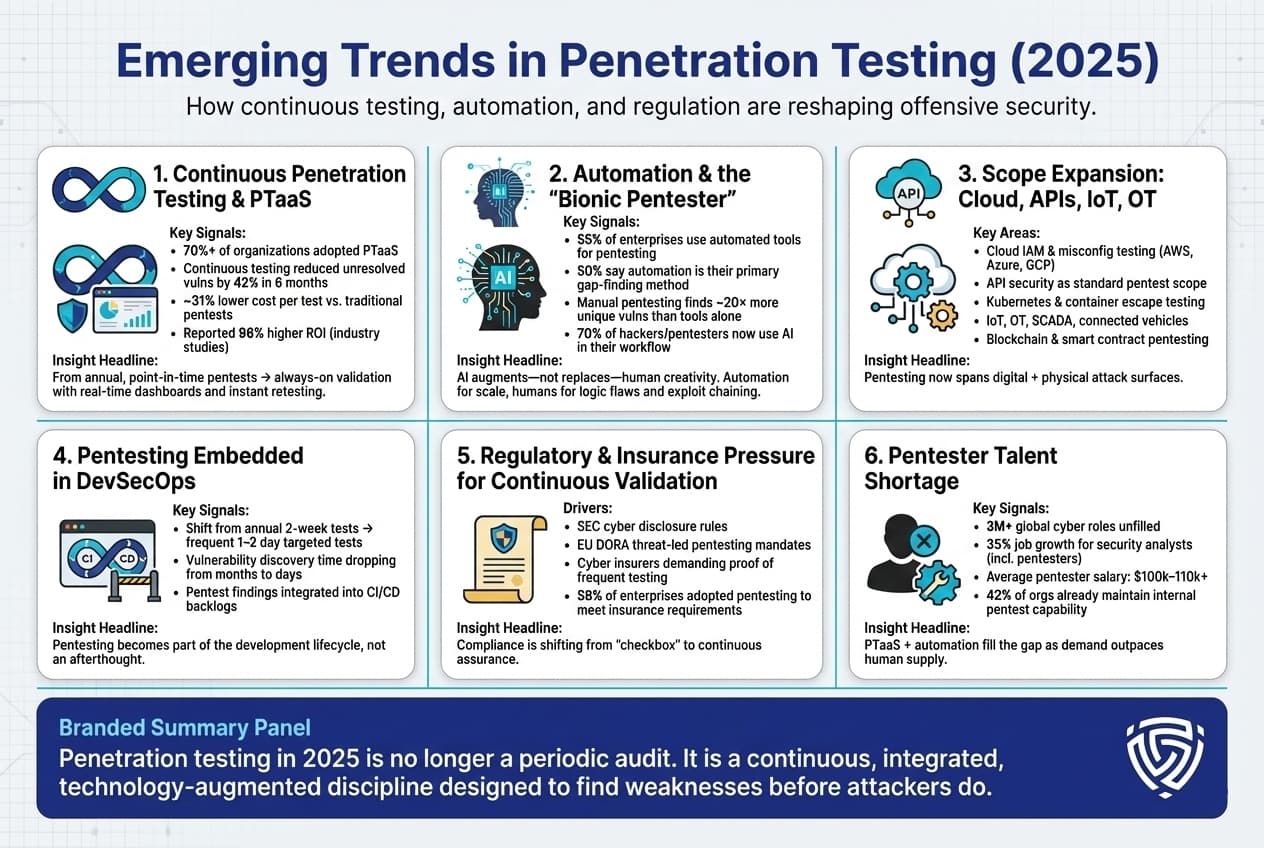
1. Continuous Penetration Testing & PTaaS: Perhaps the biggest shift is the move from one off, point in time pentests to continuous testing models. Penetration Testing as a Service PTaaS platforms are gaining huge traction over 70% of organizations have adopted PTaaS in some form, with another 14% planning to. These platforms combine automation with on demand human testing, allowing companies to run security tests much more frequently, some even daily or integrated with every software release. The statistics show a clear benefit: companies that transitioned from annual tests to quarterly or continuous testing saw major improvements. For example, one midsize healthcare firm that went from annual to quarterly pentests reduced unresolved vulnerabilities by 42% within six months. The rise of PTaaS also ties to ROI studies that found that subscription based continuous testing can cut the cost per test by ~31% and improve remediation time less time wasted on lengthy reports, more real time collaboration.
In practice, continuous pentesting means security teams get vulnerabilities delivered in real time via a dashboard, and can often validate fixes on the fly. The days of waiting for a PDF report weeks later are dwindling. This trend is most pronounced in agile tech companies and fintechs that deploy code weekly/daily, they simply cannot afford to test once a year. However, even larger enterprises are adopting rolling pentests for key assets. PTaaS providers claim a 96% higher ROI compared to traditional engagements, one figure attributed to a Cobalt study and that resonates with CISOs who must justify spending.
2. Automation and the Bionic Pentester: Automation is increasingly woven into pentesting. This includes using vulnerability scanners, scripts, and even AI driven tools to augment human testers. In 2024, 55% of enterprises used software tools to support in-house pentesting efforts, and fully 50% of CISOs said automated or software based testing is their primary method for uncovering security gaps. These might be dynamic scanners, container security tools, cloud config analyzers, etc. Additionally, AI is being leveraged to do tasks like intelligent fuzzing or log analysis to find anomalies. However, automation alone has limits: one stat often cited is that manual pentesting finds ~20x more unique vulnerabilities than automated scanning alone. That 2000% difference is because human testers can discover complex logic flaws and chaining exploits that tools miss.
Thus the concept of the bionic pentester has emerged: human expertise enhanced by AI. For example, a pentester might use an AI assistant to generate exploit code faster or to map attack paths, but then apply their creativity to execute the attack. The HackerOne report’s theme of Rise of the Bionic Hacker highlighted that 70% of researchers now use AI in their workflow. On the defense side, companies are also using AI to triage pentest findings and correlate them with threat intel to prioritize those that matter most. Overall, the trend is not AI replacing pentesters, but making them more efficient scouring wider territory while the humans concentrate on critical thinking.
3. Scope Expansion Cloud, IoT, and Beyond: The scope of what needs to be pentested is expanding. It’s not just web apps and networks anymore. Cloud penetration testing has grown into its own discipline testers are evaluating AWS/Azure configurations, trying to break out of cloud sandboxes, and assessing cloud identity roles. Many organizations realized that while they do code reviews for their apps, they weren’t testing the infrastructure as code that stood up their cloud environment. Now that’s changing. Similarly, API security testing is becoming a standard part of pentest engagements, as noted before. IoT devices and OT Operational Technology are also in focus, though stats on those are less reported publicly. Still, we see things like car manufacturers hiring pentesters to hack connected vehicles, or energy companies testing SCADA systems.
A big emerging area is container and Kubernetes security testing e.g., testers checking if they can escape containers to the host, exploit K8s privileges, etc., since so many deployments use containers now. Another area, though still niche, is blockchain and smart contract pentesting, given the rise of crypto platforms these require specialized skills, but demand is high after many DeFi hacks, so firms offering smart contract audits/pentests have popped up.
4. Integration with DevSecOps: Rather than being an isolated annual event, pentesting is increasingly integrated into the software development lifecycle. Organizations practicing DevSecOps are automating security tests into CI/CD pipelines. For instance, some companies run a battery of automated pentest scripts on every new build in staging e.g., checking OWASP Top 10 issues quickly, and then schedule a human pentester to do a blitz test on major releases. The trend in stats: more frequent, smaller scope tests targeted at new features. Whereas a traditional pentest might be 2 weeks long on the entire app once a year, a modern approach might do a 2 day test on the new microservice immediately when it’s deployed, but do that monthly. This continuous assessment model means the boundaries between pentesting and vulnerability management blur. Tools are being built to track findings from both automated scans and manual pentests in one backlog for developers to fix. The goal is to shorten the feedback loop ideally, find and fix a security issue in the same sprint it was introduced. Metrics to watch in this space are things like time from code commit to vulnerability discovery which in advanced orgs is dropping from months to days.
5. Regulatory Pressure for Continuous Validation: We touched on compliance before, the emerging trend is that regulators themselves are recognizing that annual check the box pentests are insufficient. For example, the U.S. SEC proposed rules in 2023 24 that would require public companies to annually attest to the effectiveness of their controls which implicitly encourages continuous testing. In the EU, financial entities under DORA will have to conduct threat led penetration testing every 3 years at minimum, and more often if major changes occur. That is pushing companies to maintain a ready state hence continuous pentesting because a regulator might demand test results at any time. Similarly, cyber insurance providers now often ask: Do you conduct regular pentests? How many findings did you remediate? and premiums can be lower if the answer is good. In fact, 59% of enterprises said they implemented certain security measures like pentesting to satisfy cyber insurance requirements. We can expect insurance to further drive continuous validation, they might require quarterly attestations or on demand testing after an incident.
6. The Human Talent Shortage: One more trend to note, not a technical one but important: the demand for qualified pentesters is outstripping supply. The cybersecurity workforce shortage is well known over 3 million unfilled roles globally. For penetration testing roles specifically, the U.S. The Bureau of Labor Statistics projects 35% job growth for information security analysts including pentesters from 2021 to 2031, much faster than average. Salaries for skilled pentesters have risen accordingly, the average U.S. pentester makes around $100–110k, with senior exploit developers making well into six figures. This shortage is an underlying factor driving companies to use PTaaS and automation there simply aren’t enough humans to meet all the testing needs manually. It’s also leading some companies to grow their own e.g., cross training developers or network engineers to do security testing in house. We see more security tooling with user friendly interfaces aiming to let generalists perform basic pentest tasks, reserving expert consultants for the really complex stuff. The trend might show up in stats like the percentage of organizations with an internal pentest team 42% according to some data climbing in coming years, as companies invest in building that capability to supplement external testing.
In summary, the practice of pentesting is evolving to be faster, more frequent, more integrated, and augmented by technology. The days of one big annual pentest, followed by a big PDF are numbered. The trajectory is toward continuous security validation, a state where at any given moment, an organization has recently tested its key assets for weaknesses. The emerging mantra is find it before the bad guys do, and given the dynamic threat environment, that means testing is becoming a continuous cycle rather than a periodic project.
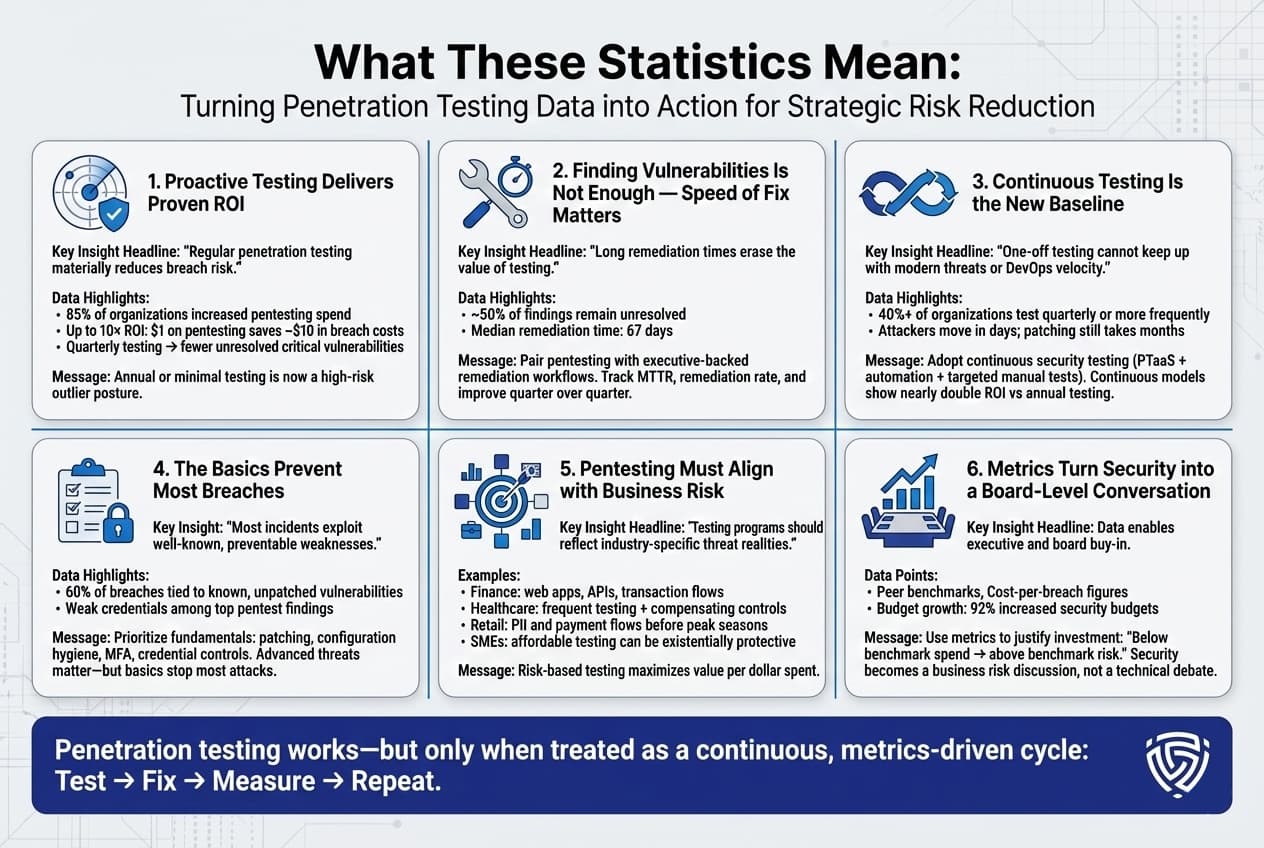
All these penetration testing stats and trends paint a clear picture: organizations need to up their security game in a strategic way. The data is telling us several things:
In short, the statistics we’ve discussed form a roadmap for improving security posture. They highlight weaknesses like long MTTRs and strengths like ROI of testing that organizations can use to calibrate their strategies. The main takeaway is that penetration testing is a proven method to identify and reduce risk, but it must be embraced as an ongoing process tied to swift remediation to truly pay off. Those firms that have done so evident in the data by their lower breach rates and faster recovery set an example that others should follow. Security is no longer a set and forget endeavor, the numbers show it’s a continuous cycle of test fix repeat, which, when executed well, dramatically lowers the chance of a catastrophic breach.
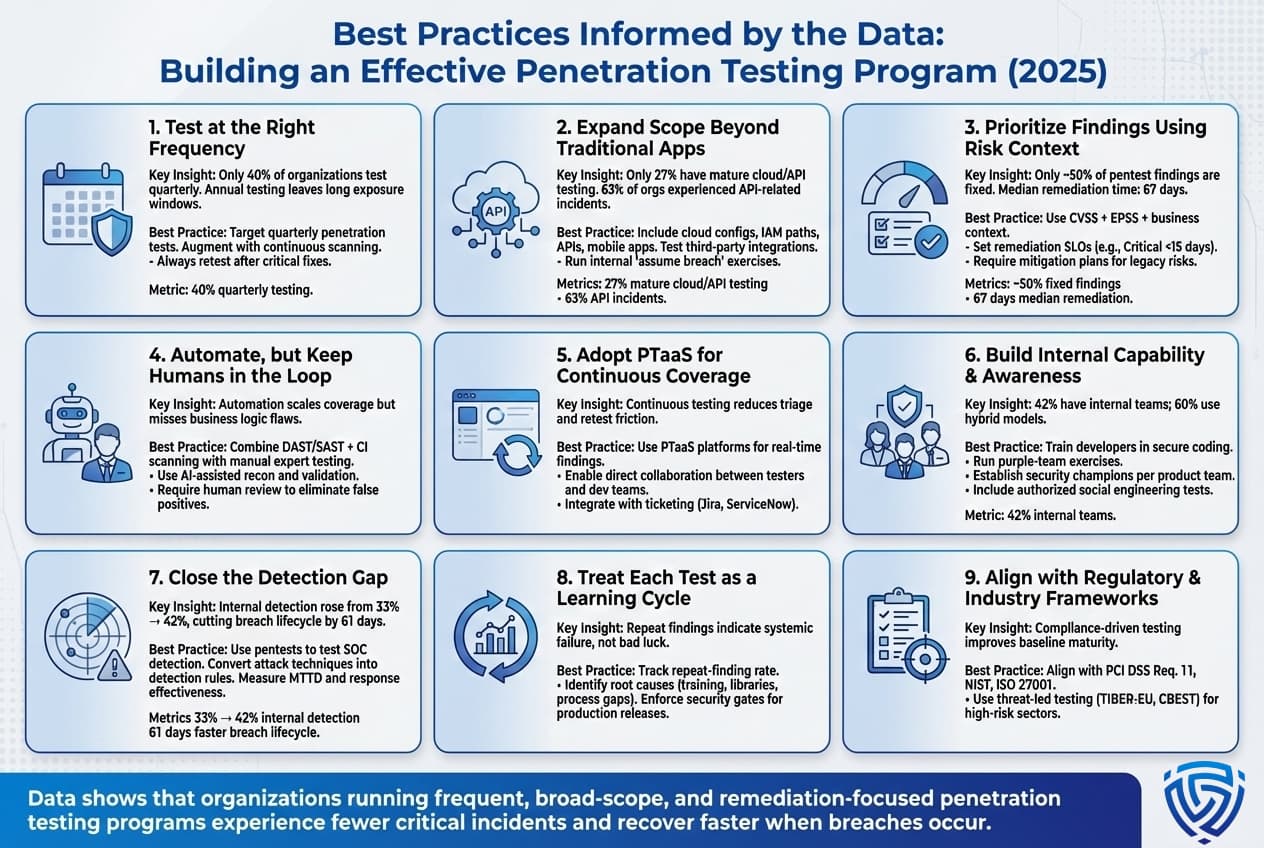
Drawing from these statistics and trends, organizations can refine their security strategies. Here are evidence backed best practices for penetration testing programs:
Implementing these best practices can significantly elevate your security posture. The common theme is to make testing frequent, comprehensive, and tied closely to improvement cycles. Penetration testing isn’t a silver bullet, but as the statistics have shown, organizations that excel in utilizing pentesting data by rapidly fixing issues and learning from them experience far fewer costly incidents. It’s about turning a reactive exercise into a proactive process and ultimately into a competitive advantage. Customers and partners are increasingly asking about security measures, and having a robust pentest program is a strong answer.
By focusing on these practices, you not only respond to what the stats are telling us more testing, faster fixes, covering new technology but also create a culture of continuous security which is really the endgame. When security is integrated so deeply that development and operations anticipate and prevent issues that pentesters would find, you know you’ve internalized the lessons behind the numbers.
Ideally, penetration testing should be done at least annually, and for many organizations a quarterly or continuous approach is recommended. The frequency depends on how rapidly your IT environment changes and regulatory requirements. If you deploy new code or systems weekly, you need more frequent testing monthly or integrated into each release cycle. Industry best practice is shifting towards continuous pentesting, where automated checks run constantly and human led tests occur whenever significant changes or time elapsed. A survey shows only ~32% of organizations still test just once or twice a year, the rest are moving to more frequent schedules to keep up with evolving threats.
Yes, when combined with timely remediation, pentesting significantly reduces breach risk. By simulating attacks, pentesters uncover critical security holes that can then be fixed before real attackers exploit them. Statistics indicate organizations that regularly pentest have fewer successful breaches and lower breach costs. For example, companies with robust testing and incident response save on average $248k per breach in mitigation costs. And one study found a 10:1 ROI every $1 on pentesting saved up to $10 in potential breach losses. However, the key is acting on the findings, pentesting without remediation follows through yields little risk reduction.
In most cases, yes. Continuous pentesting via PTaaS platforms or frequent small scope tests provides ongoing assurance and catches issues sooner. Annual tests leave long gaps. An attacker might find a new vulnerability in your system the day after your annual test ends, and you wouldn’t catch it for a year. Continuous approaches shrink that window of exposure. Data shows a trend towards continuous testing because it aligns with agile development and the continuous delivery of new code. For instance, 40% of organizations now prefer quarterly or more frequent pentests, and many are adopting on demand testing for every major app update. Continuous testing also enables real time collaboration developers to fix issues in near real time and get them retested, improving remediation speed. Annual tests can still be part of a strategy e.g., an annual comprehensive audit, but supplementing with continuous methods is considered a best practice in 2025.
The most common vulnerabilities tend to be misconfigurations, outdated software, and web application flaws. Specifically, testers frequently find things like: Security misconfiguration improper server settings, open cloud storage, default passwords this is often the #1 category. Weak authentication weak passwords, no MFA is extremely common e.g. testers often crack admin credentials or find user accounts with Password123. Injection flaws such as SQL Injection and Cross Site Scripting XSS remain common, with SQLi being the top critical web vuln and XSS appearing in many reports though slightly declining. Broken access controls are also a leading issue testers find they can access data or functions they shouldn’t by manipulating IDs or tokens. On internal networks, unpatched vulnerabilities missing critical patches and poor segmentation are common. Essentially, basic weaknesses account for the bulk of findings: one source noted over 75% of pentest issues fell into just five categories misconfig, crypto issues, access control, injections, outdated components.
It varies, but on average it takes on the order of 2–3 months to remediate critical issues which is quite slow. An industry report found the mean time to remediate high/critical app vulnerabilities was 74 days. Some organizations are much faster days or weeks while others take many months or never fully resolve certain findings. Large enterprises often struggle with remediation backlog roughly 45% of discovered vulns remained unresolved after 12 months in one survey. However, organizations are trying to improve: setting SLAs like 30 days for critical fixes, and using agile methods to patch quicker. The top performers can fix criticals in just a couple of weeks or even days if emergency patching, while laggards might exceed 90 days routinely. Metrics like median 67 days to fix as noted in some data show there’s much room for improvement, and many are turning to automation and DevSecOps to speed this up.
Both, if possible. A hybrid approach is considered best by many experts. Internal security staff know your systems well and can do continuous assessments, quick re tests, and advisory during development. They’re great for day to day and integrating security into the dev process. However, they might have blind spots or conflicts of interest. External consultants bring a fresh perspective, specialized skills, and impartial view plus in many cases, certifications or reputational credibility useful for compliance reports. Statistics show ~60% of companies use a mix of internal and third party testing. If forced to choose one: smaller companies or those without skilled internal hackers should definitely use reputable external pentesters you get a team with varied expertise. Larger enterprises often invest in an internal red team and still do annual external tests or bug bounty programs. In summary, use internal talent for continuous efforts and quick fixes, and external teams for periodic deep dives, advanced adversary simulations, or to validate the internal team’s work.
A vulnerability scan is an automated sweep of systems using a tool to identify known issues, missing patches, misconfigurations, etc., whereas a penetration test involves skilled humans actively exploiting vulnerabilities and digging deeper. Vulnerability scans using tools like Nessus, Qualys are broad and can cover many assets quickly, but they only find surface level known problems and often produce false positives. They don’t actually exploit anything. A penetration test, on the other hand, will confirm vulnerabilities and show the impact by chaining them, often discovering issues that scanners miss e.g., business logic flaws. Think of vuln scanning as a routine health check quick, automated, cheaper and pentesting as a thorough diagnostic and treatment plan by a specialist. The stats highlight the difference in depth e.g., manual pentests found 20x more unique issues than automated scans in one study. Both are important: many organizations do continuous vuln scanning and periodic pentesting. The scan might tell you these 50 servers need patches while the pentest might reveal using a combination of an unpatched server and a misconfiguration, an attacker could steal customer data. Penetration tests yield far richer insight into your true security posture.
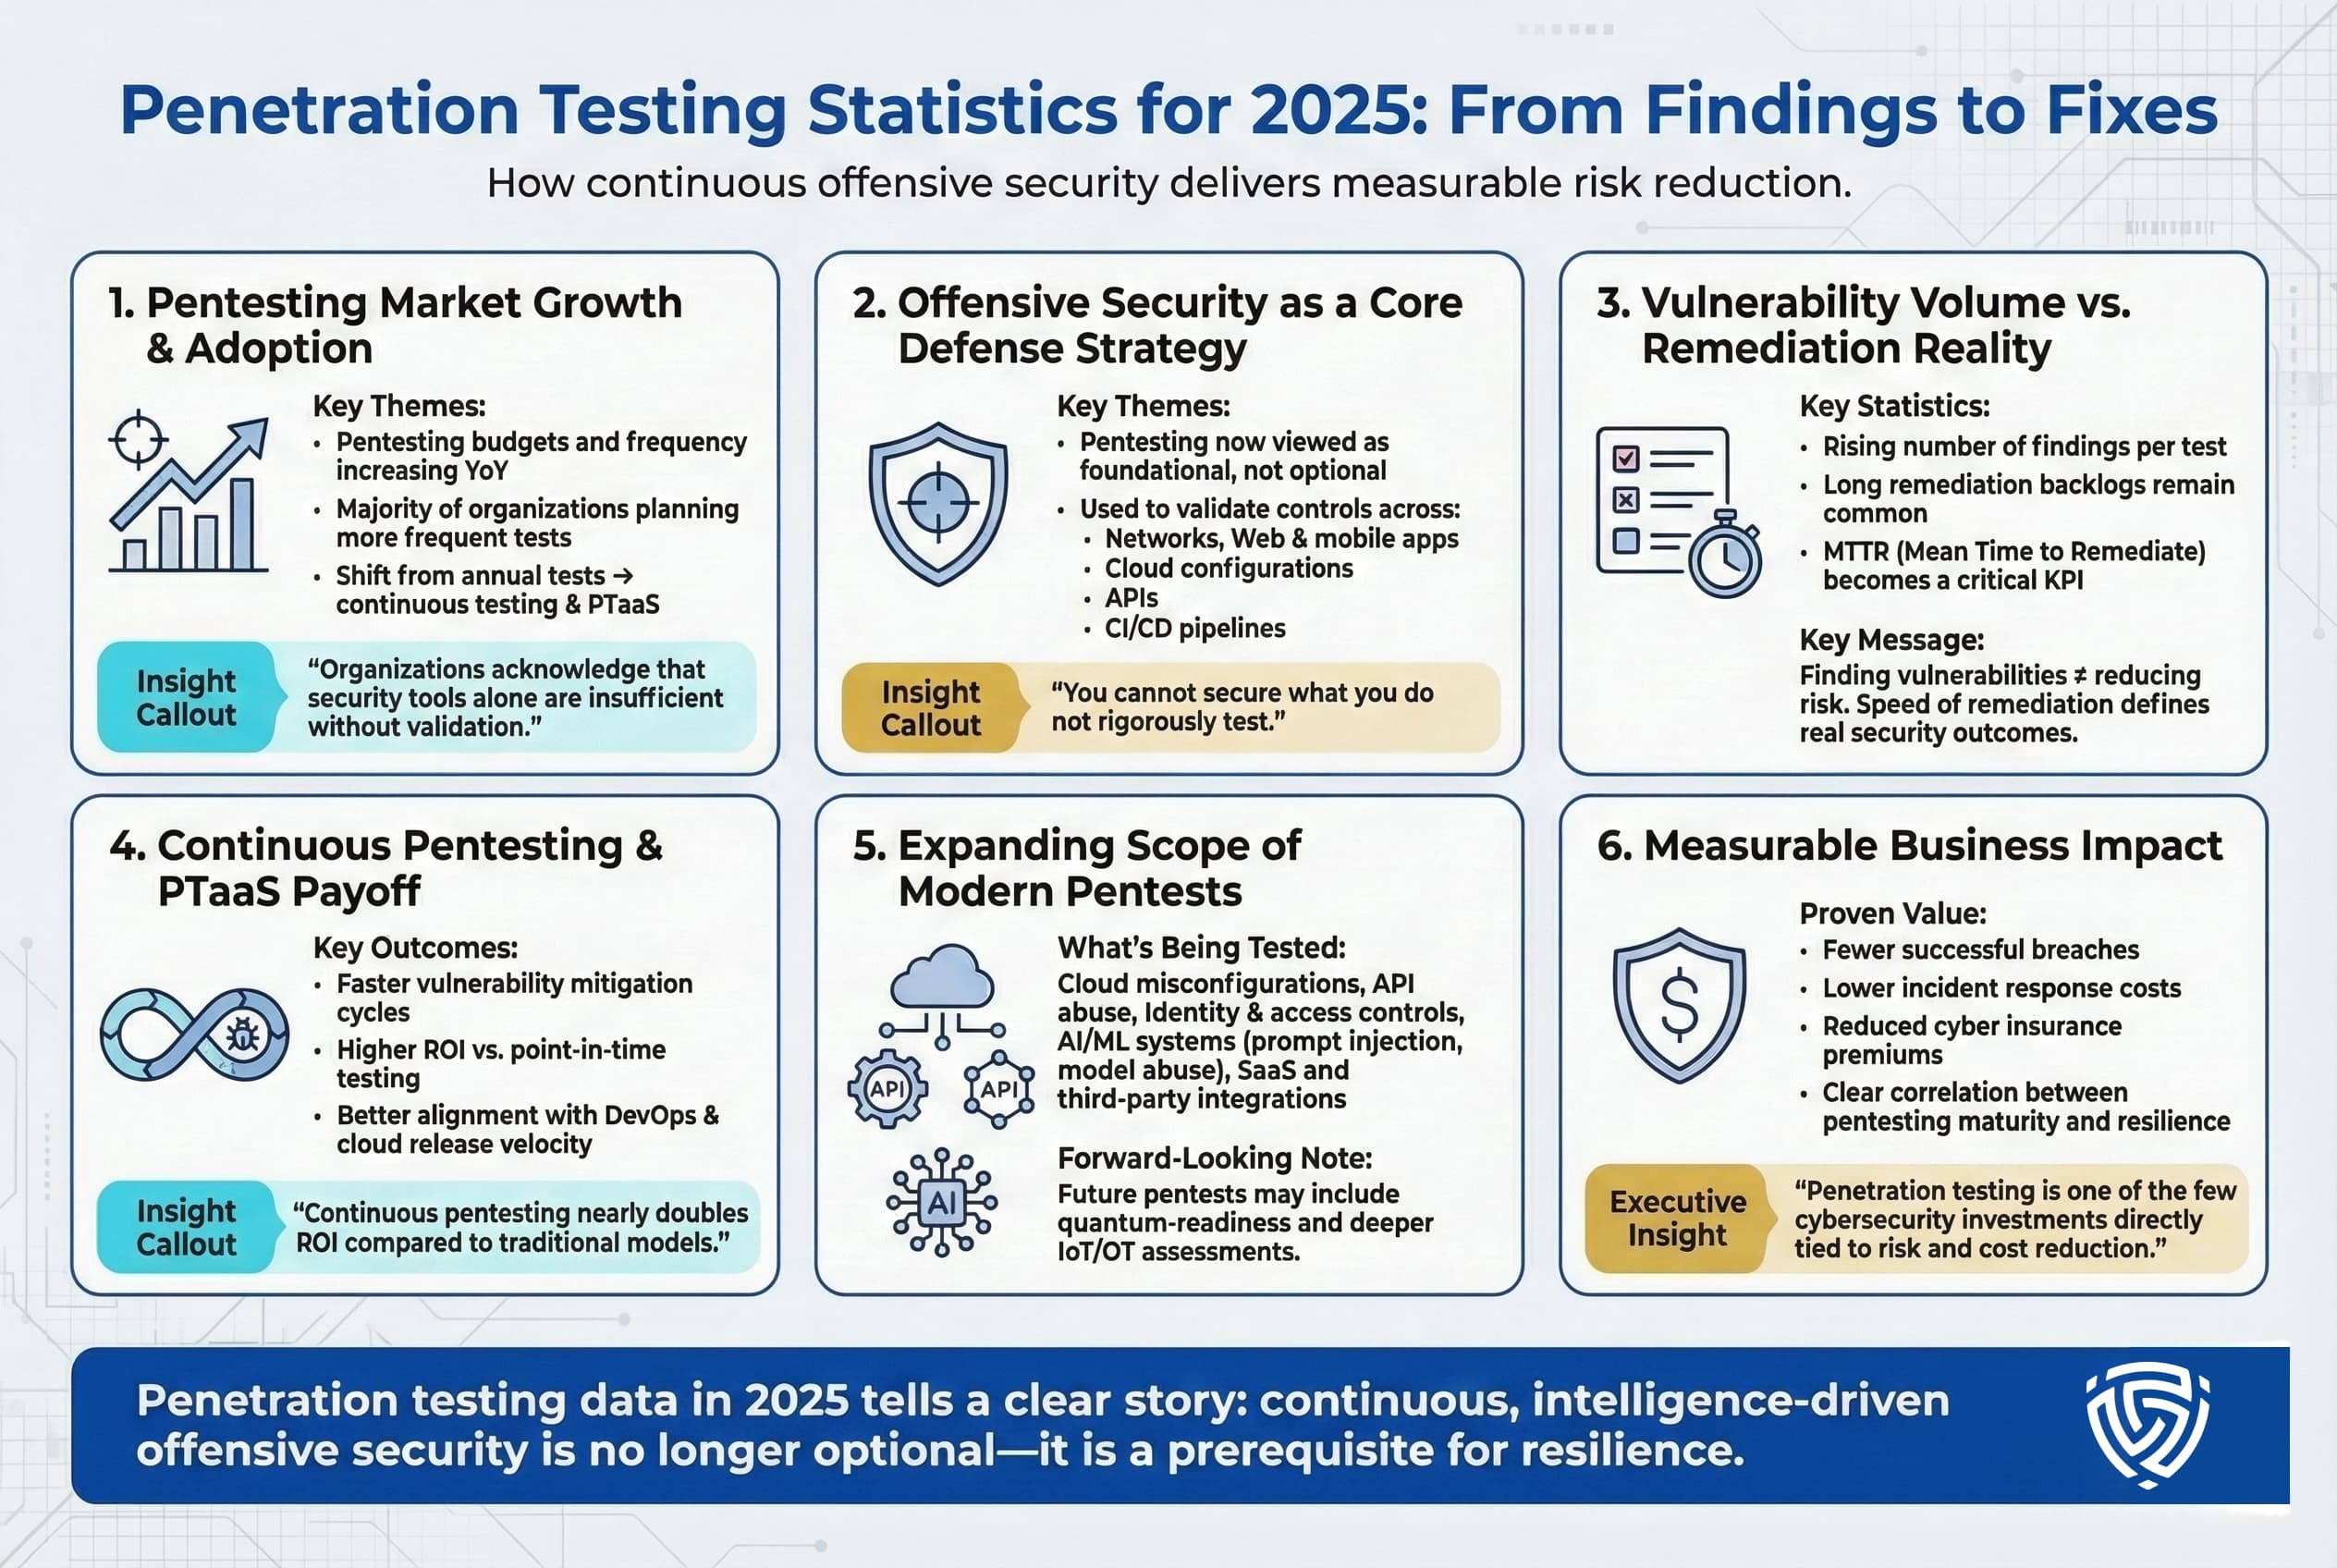
Penetration testing statistics for 2025 reveal a cybersecurity landscape in transition. Organizations are conducting more tests, finding more vulnerabilities, but also facing the challenge of fixing them in a timely manner. The data underscores a few overarching points: offensive security has become a cornerstone of cyber defense, and those who approach it as a continuous, intelligence driven practice reap significant benefits in risk reduction and resilience.
We’ve seen that the pentesting market is growing rapidly as companies invest to close the disconnect between their heavy security spending and continued breach rates. While billions are spent on defensive tools, it’s the validation through pentesting that often highlights where those defenses have gaps. It’s telling that a majority of firms plan to increase pentest budgets and frequency, essentially acknowledging that you cannot secure what you don’t rigorously test. The shift to PTaaS and continuous testing is a direct response to modern IT realities: cloud deployments, DevOps, and adaptive adversaries demand an always on approach to security assessment.
At the same time, statistics around vulnerability backlogs and long remediation times are a sobering reminder that finding bugs is not the same as fixing them. True security outcomes depend on the latter. Pentesting is most powerful when coupled with agile remediation and strategic improvements. Metrics like MTTR are just as important as the number of findings. The organizations leading the pack are those that use pentesting data to drive quick action patching critical holes in days, not months, and learning from each test to prevent repeat issues.
Another clear trend is the broadening scope of what pentests cover not just networks and web apps, but cloud configs, APIs, and even AI systems. The attack surface is expanding almost exponentially, and pentesting is evolving to cover new frontiers like prompt injection attacks on AI or security of API driven microservices. This evolution will continue, we can anticipate that next year’s reports might include stats on quantum computing risks or deeper IoT penetration results, reflecting whatever technologies rise in prominence.
Crucially, the stats illustrate that penetration testing delivers measurable value. Organizations with robust testing programs have fewer breaches, lower incident costs, and often lower insurance premiums. Industry surveys even show improved efficiency for example, companies using continuous pentesting saw much faster vulnerability mitigation cycles and nearly double ROI compared to traditional approaches. It’s one of the rare cybersecurity measures that can be directly correlated with both reduced risk and cost savings through avoided incidents.
In conclusion, penetration testing statistics aren’t just numbers on a report, they tell the story of how well we’re doing in the constant battle between attackers and defenders. The story in 2025 is one of progress: more awareness, more testing, more integration of security into development. But it’s also one of challenges: an overwhelming volume of vulnerabilities and a need for speed in addressing them. Organizations that succeed will be those that heed the data, adopting a culture of continuous improvement in security. As the adage goes, forewarned is forearmed. The wealth of data from pentesting gives us the forewarning, it’s up to each organization to arm themselves by acting on it. The endgame is a state where continuous, realistic security validation is as embedded in business operations as quality control or financial auditing, only then can one truly stay a step ahead of threats. The statistics in this report provide the map, the journey to a secure posture is ongoing and guided by these insights.
About the Author
Mohammed Khalil is a Cybersecurity Architect at DeepStrike Specializing in advanced penetration testing and offensive security operations, he holds certifications including CISSP, OSCP, and OSWE. Mohammed has led numerous red team engagements for Fortune 500 companies, focusing on cloud security, application vulnerabilities, and adversary emulation. His work involves dissecting complex attack chains and developing resilient defense strategies for clients in the finance, healthcare, and technology sectors.

Stay secure with DeepStrike penetration testing services. Reach out for a quote or customized technical proposal today
Contact Us